
BJ's (BJRI)
BJ's keeps us up at night. Its weak sales growth and low returns on capital show it struggled to generate demand and profits.― StockStory Analyst Team
1. News


2. Summary
Why We Think BJ's Will Underperform
Founded in 1978 in California, BJ’s Restaurants (NASDAQ:BJRI) is a chain of restaurants whose menu features classic American dishes, often with a twist.
- Challenging supply chain dynamics and bad unit economics are reflected in its low gross margin of 14.9%
- ROIC of 4.5% reflects management’s challenges in identifying attractive investment opportunities
- Projected sales growth of 2.6% for the next 12 months suggests sluggish demand


BJ's doesn’t meet our quality standards. We’ve identified better opportunities elsewhere.
Why There Are Better Opportunities Than BJ's


At $33.42 per share, BJ's trades at 14.5x forward P/E. This multiple is lower than most restaurant companies, but for good reason.
Our advice is to pay up for elite businesses whose advantages are tailwinds to earnings growth. Don’t get sucked into lower-quality businesses just because they seem like bargains. These mediocre businesses often never achieve a higher multiple as hoped, a phenomenon known as a “value trap”.
3. BJ's (BJRI) Research Report: Q4 CY2025 Update
American restaurant chain BJ’s Restaurants (NASDAQ:BJRI) announced better-than-expected revenue in Q4 CY2025, with sales up 3.2% year on year to $355.4 million. Its non-GAAP profit of $0.66 per share was 5.7% above analysts’ consensus estimates.
BJ's (BJRI) Q4 CY2025 Highlights:
- Revenue: $355.4 million vs analyst estimates of $353.4 million (3.2% year-on-year growth, 0.6% beat)
- Adjusted EPS: $0.66 vs analyst estimates of $0.62 (5.7% beat)
- Adjusted EBITDA: $35.55 million vs analyst estimates of $37.12 million (10% margin, 4.2% miss)
- EBITDA guidance for the upcoming financial year 2026 is $145 million at the midpoint, above analyst estimates of $143.3 million
- Operating Margin: 3.1%, up from -1.4% in the same quarter last year
- Locations: 219 at quarter end, up from 218 in the same quarter last year
- Same-Store Sales rose 2.6% year on year (5.5% in the same quarter last year)
- Market Capitalization: $853.4 million
Company Overview
Founded in 1978 in California, BJ’s Restaurants (NASDAQ:BJRI) is a chain of restaurants whose menu features classic American dishes, often with a twist.
The concept began as a simple pizza joint but has since grown into a more comprehensive casual dining experience. BJ's is known for its deep-dish pizza, desserts, and craft beers. As mentioned, there is often creativity in the dishes, as seen by offerings such as the cheeseburger pizza that features a ground beef crumble and bacon on top of traditional pizza ingredients. The fan-favorite Pizookie is a dessert that is a chocolate chip cookie baked into a pizza pan and topped with marshmallows for the family to share.
The core BJ’s Restaurants customer is a middle-income family looking for a special night out on the one hand, but an experience that is also relaxed and affordable on the other hand. The kids can get some creative pizza or chicken dishes while being a little rowdy while adults can have some grownup fare and a drink. Everyone leaves full without breaking the bank.
Stepping into a BJ's location, you’ll notice ample space with seating options for groups large and small. The interiors have a contemporary vibe, adorned with wood finishes and soft lighting. In short, the decor is nice but not overly memorable. And because BJ’s caters to families, the atmosphere is usually lively, especially during peak lunch and dinner times on the weekends.
4. Sit-Down Dining
Sit-down restaurants offer a complete dining experience with table service. These establishments span various cuisines and are renowned for their warm hospitality and welcoming ambiance, making them perfect for family gatherings, special occasions, or simply unwinding. Their extensive menus range from appetizers to indulgent desserts and wines and cocktails. This space is extremely fragmented and competition includes everything from publicly-traded companies owning multiple chains to single-location mom-and-pop restaurants.
Competitors offering a full-service, casual family dining experience include Darden (NYSE:DRI), Dine Brands (NYSE:DIN), Brinker International (NYSE:EAT), and The Cheesecake Factory (NASDAQ:CAKE).
5. Revenue Growth
A company’s long-term sales performance can indicate its overall quality. Any business can put up a good quarter or two, but many enduring ones grow for years.
With $1.40 billion in revenue over the past 12 months, BJ's is a mid-sized restaurant chain, which sometimes brings disadvantages compared to larger competitors benefiting from better brand awareness and economies of scale.
As you can see below, BJ’s 3.2% annualized revenue growth over the last six years was sluggish as its restaurant footprint remained unchanged and it barely increased sales at existing, established dining locations.
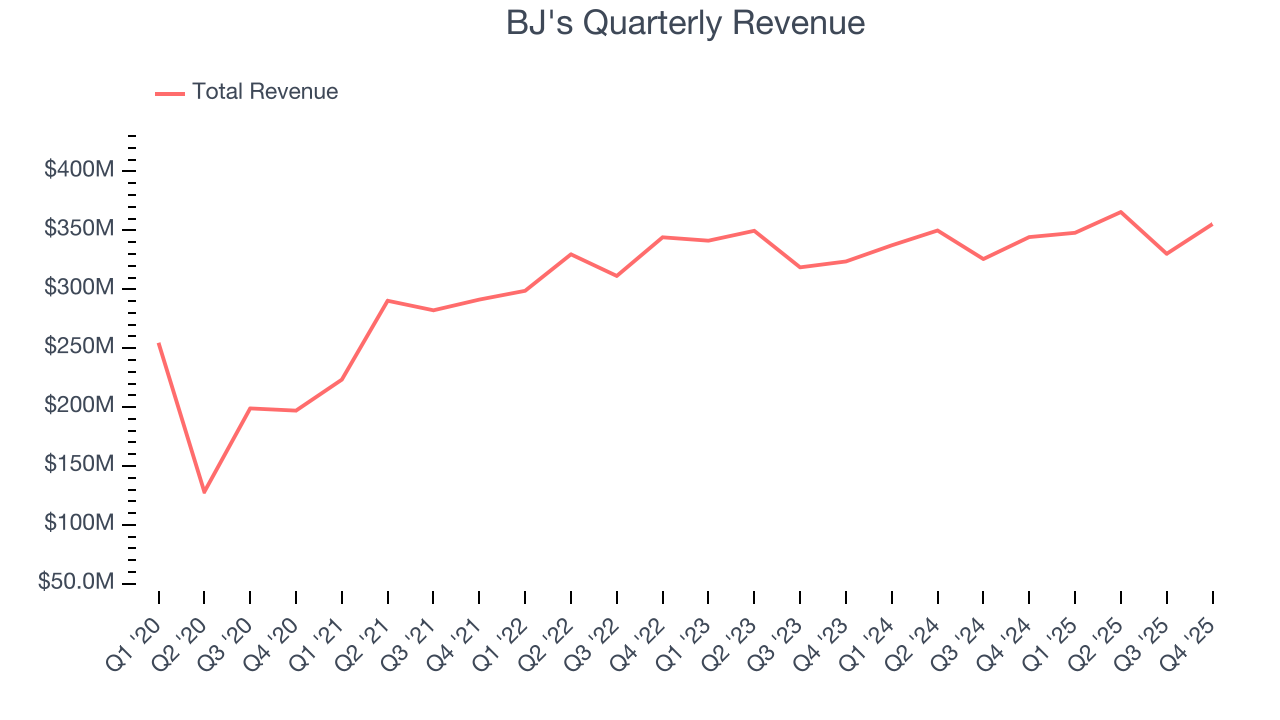
This quarter, BJ's reported modest year-on-year revenue growth of 3.2% but beat Wall Street’s estimates by 0.6%.
Looking ahead, sell-side analysts expect revenue to grow 2.5% over the next 12 months, similar to its six-year rate. This projection doesn't excite us and suggests its newer menu offerings will not lead to better top-line performance yet.
6. Restaurant Performance
Number of Restaurants
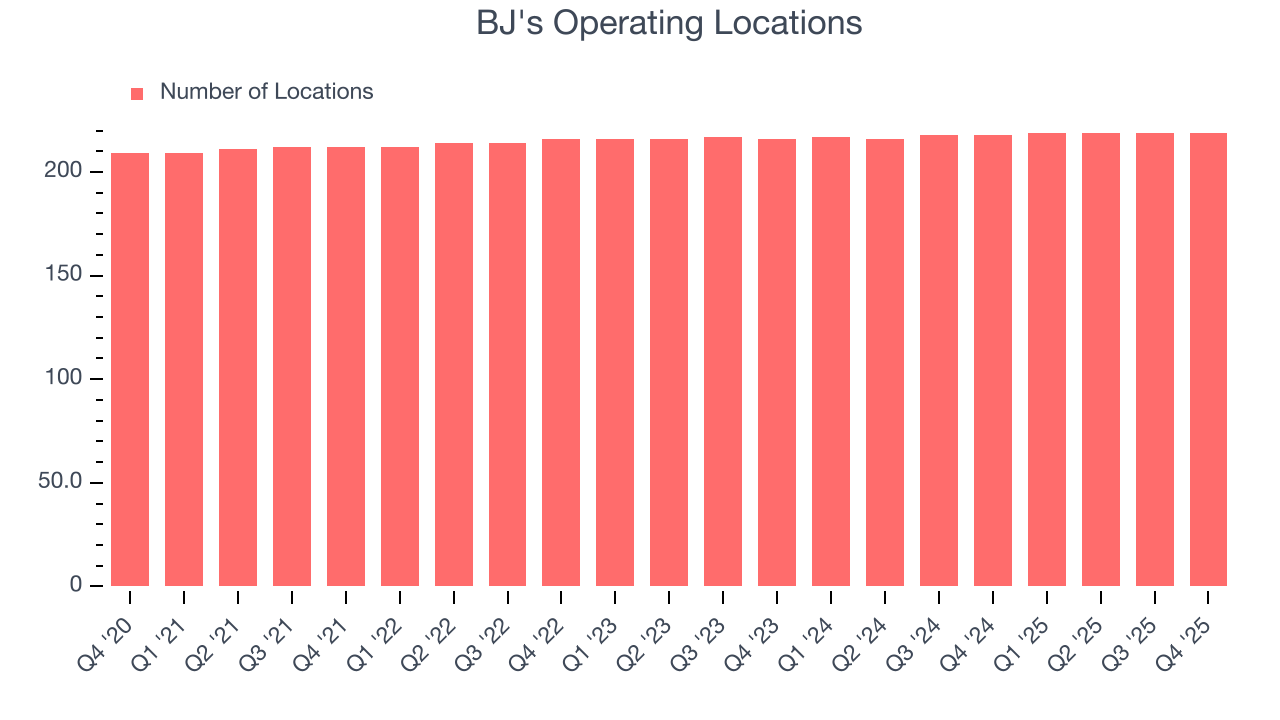
The number of dining locations a restaurant chain operates is a critical driver of how quickly company-level sales can grow.
BJ's operated 219 locations in the latest quarter, and over the last two years, has kept its restaurant count flat while other restaurant businesses have opted for growth.
When a chain doesn’t open many new restaurants, it usually means there’s stable demand for its meals and it’s focused on improving operational efficiency to increase profitability.
Same-Store Sales
A company's restaurant base only paints one part of the picture. When demand is high, it makes sense to open more. But when demand is low, it’s prudent to close some locations and use the money in other ways. Same-store sales is an industry measure of whether revenue is growing at those existing restaurants and is driven by customer visits (often called traffic) and the average spending per customer (ticket).
BJ’s demand within its existing dining locations has been relatively stable over the last two years but was below most restaurant chains. On average, the company’s same-store sales have grown by 1.6% per year. Given its flat restaurant base over the same period, this performance stems from a mixture of higher prices and increased foot traffic at existing locations.
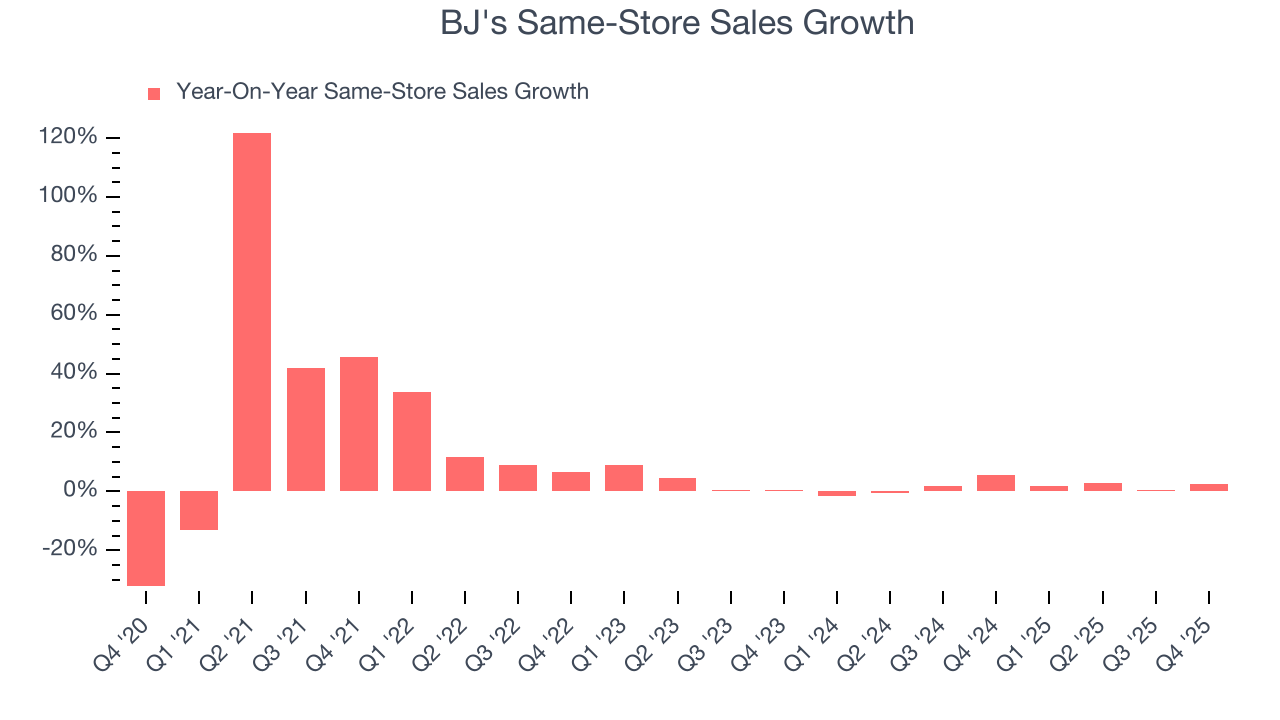
In the latest quarter, BJ’s same-store sales rose 2.6% year on year. This growth was an acceleration from its historical levels, which is always an encouraging sign.
7. Gross Margin & Pricing Power
We prefer higher gross margins because they not only make it easier to generate more operating profits but also indicate pricing power and differentiation, whether it be the dining experience or quality and taste of food.
BJ's has bad unit economics for a restaurant company, signaling it operates in a competitive market and has little room for error if demand unexpectedly falls. As you can see below, it averaged a 14.9% gross margin over the last two years. Said differently, BJ's had to pay a chunky $85.06 to its suppliers for every $100 in revenue. 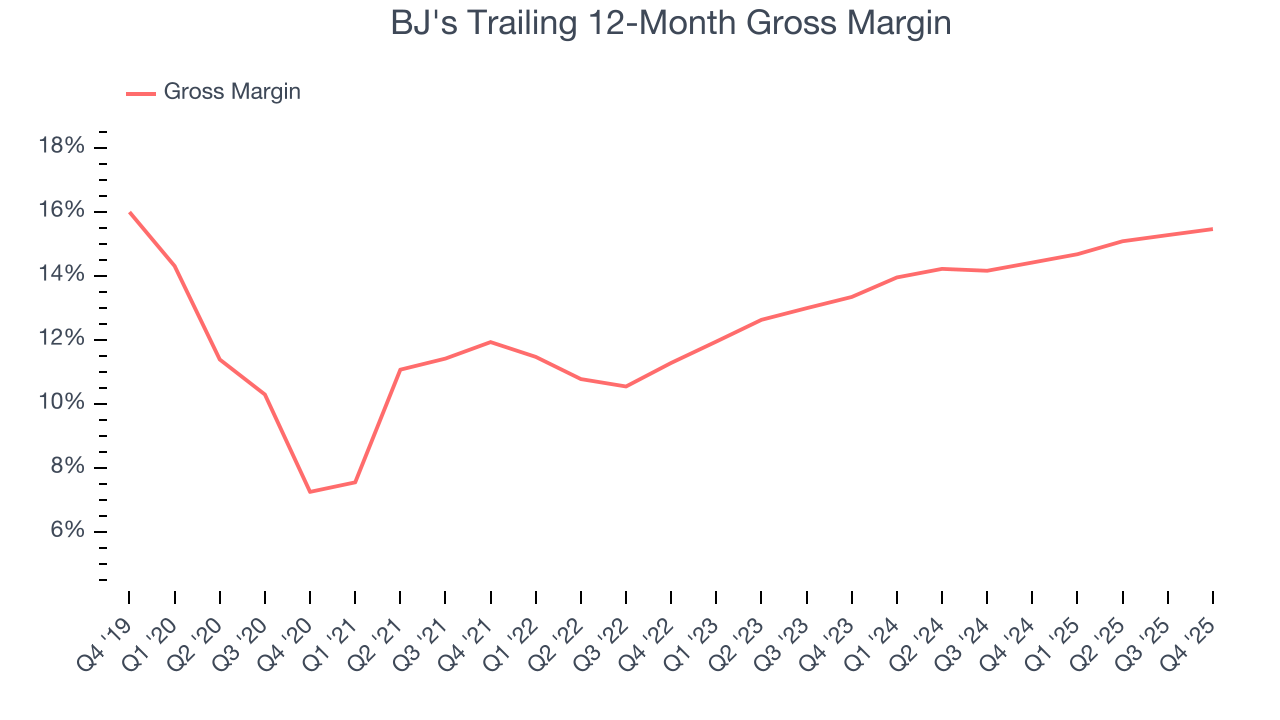
BJ's produced a 16.1% gross profit margin in Q4, in line with the same quarter last year. Zooming out, BJ’s full-year margin has been trending up over the past 12 months, increasing by 1 percentage points. If this move continues, it could suggest better unit economics due to more leverage from its growing sales on the fixed portion of its cost of goods sold
8. Operating Margin
Operating margin is an important measure of profitability as it shows the portion of revenue left after accounting for all core expenses – everything from the cost of goods sold to advertising and wages. It’s also useful for comparing profitability across companies with different levels of debt and tax rates because it excludes interest and taxes.
BJ's was profitable over the last two years but held back by its large cost base. Its average operating margin of 2.2% was weak for a restaurant business. This result isn’t too surprising given its low gross margin as a starting point.
On the plus side, BJ’s operating margin rose by 2.3 percentage points over the last year, as its sales growth gave it operating leverage.
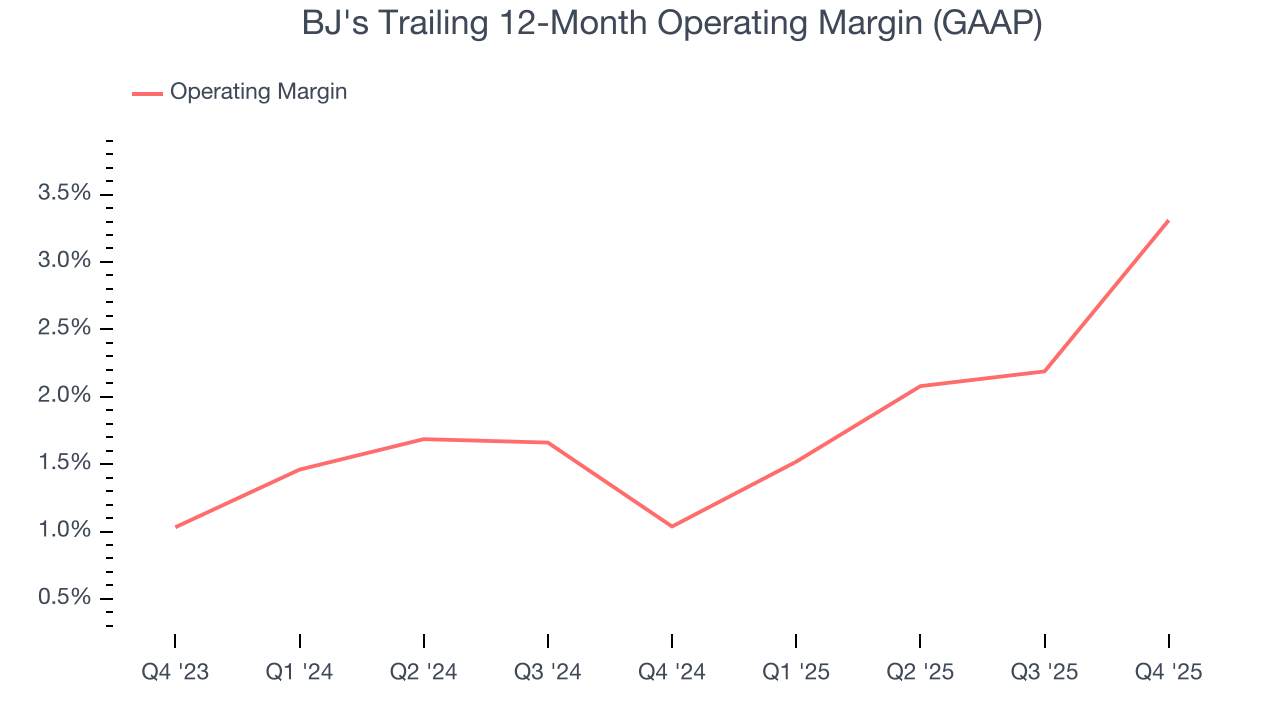
In Q4, BJ's generated an operating margin profit margin of 3.1%, up 4.5 percentage points year on year. The increase was encouraging, and because its operating margin rose more than its gross margin, we can infer it was more efficient with expenses such as marketing, and administrative overhead.
9. Earnings Per Share
Revenue trends explain a company’s historical growth, but the long-term change in earnings per share (EPS) points to the profitability of that growth – for example, a company could inflate its sales through excessive spending on advertising and promotions.
BJ’s unimpressive 2.1% annual EPS growth over the last six years aligns with its revenue performance. This tells us it maintained its per-share profitability as it expanded.
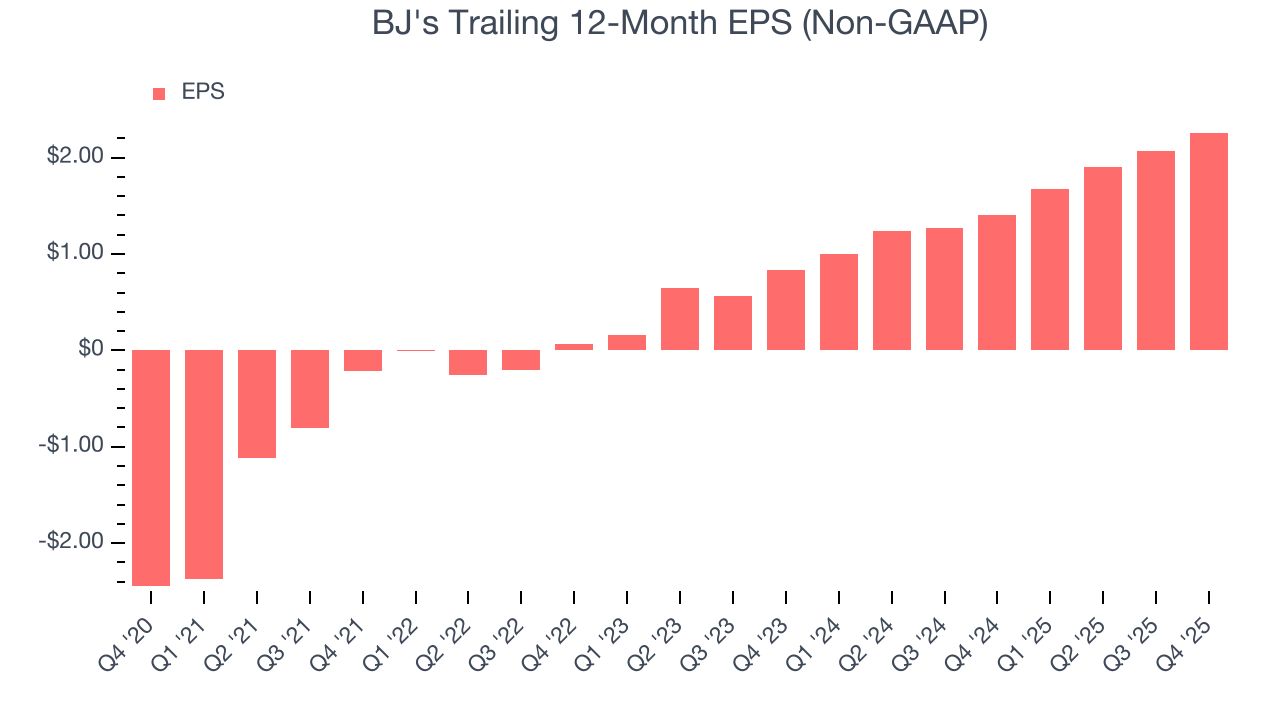
In Q4, BJ's reported adjusted EPS of $0.66, up from $0.47 in the same quarter last year. This print beat analysts’ estimates by 5.7%. Over the next 12 months, Wall Street expects BJ’s full-year EPS of $2.26 to grow 3.1%.
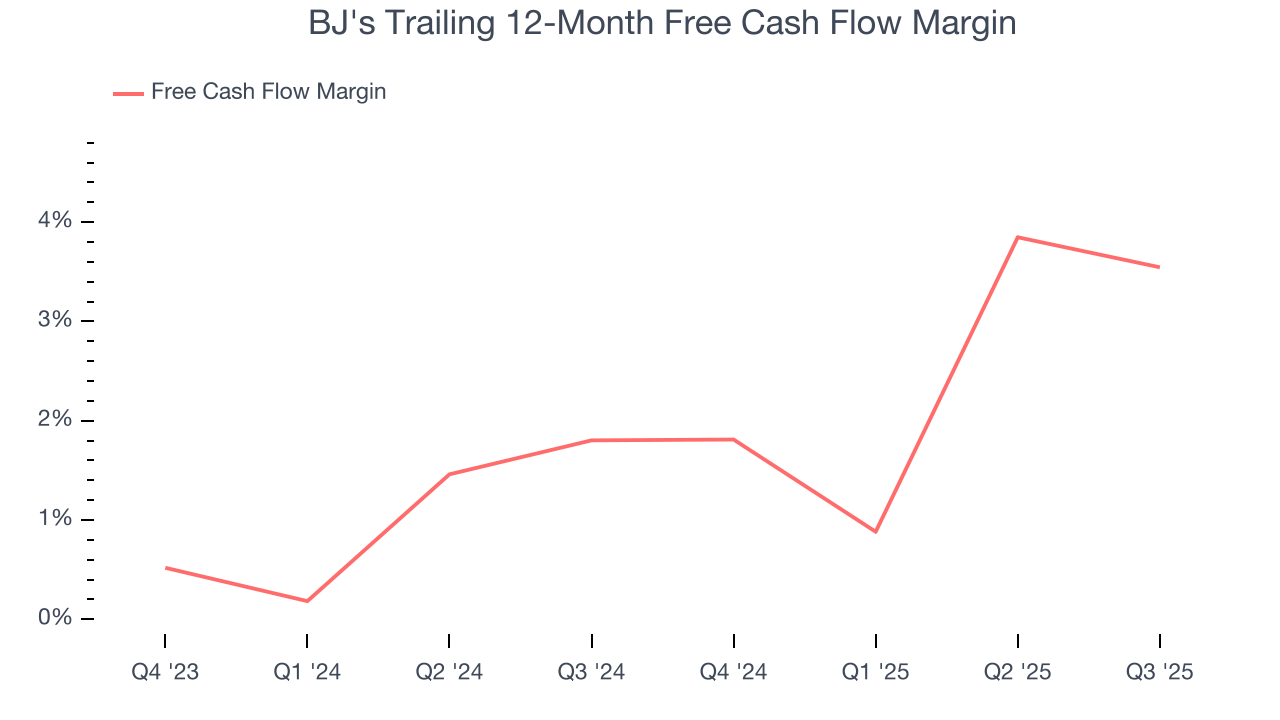
10. Cash Is King
Although earnings are undoubtedly valuable for assessing company performance, we believe cash is king because you can’t use accounting profits to pay the bills.
BJ's has shown mediocre cash profitability over the last two years, giving the company limited opportunities to return capital to shareholders. Its free cash flow margin averaged 2.4%, subpar for a restaurant business.
11. Return on Invested Capital (ROIC)
EPS and free cash flow tell us whether a company was profitable while growing its revenue. But was it capital-efficient? Enter ROIC, a metric showing how much operating profit a company generates relative to the money it has raised (debt and equity).
BJ's historically did a mediocre job investing in profitable growth initiatives. Its five-year average ROIC was 4.5%, lower than the typical cost of capital (how much it costs to raise money) for restaurant companies.
12. Balance Sheet Assessment
BJ's reported $23.78 million of cash and $85 million of debt on its balance sheet in the most recent quarter. As investors in high-quality companies, we primarily focus on two things: 1) that a company’s debt level isn’t too high and 2) that its interest payments are not excessively burdening the business.
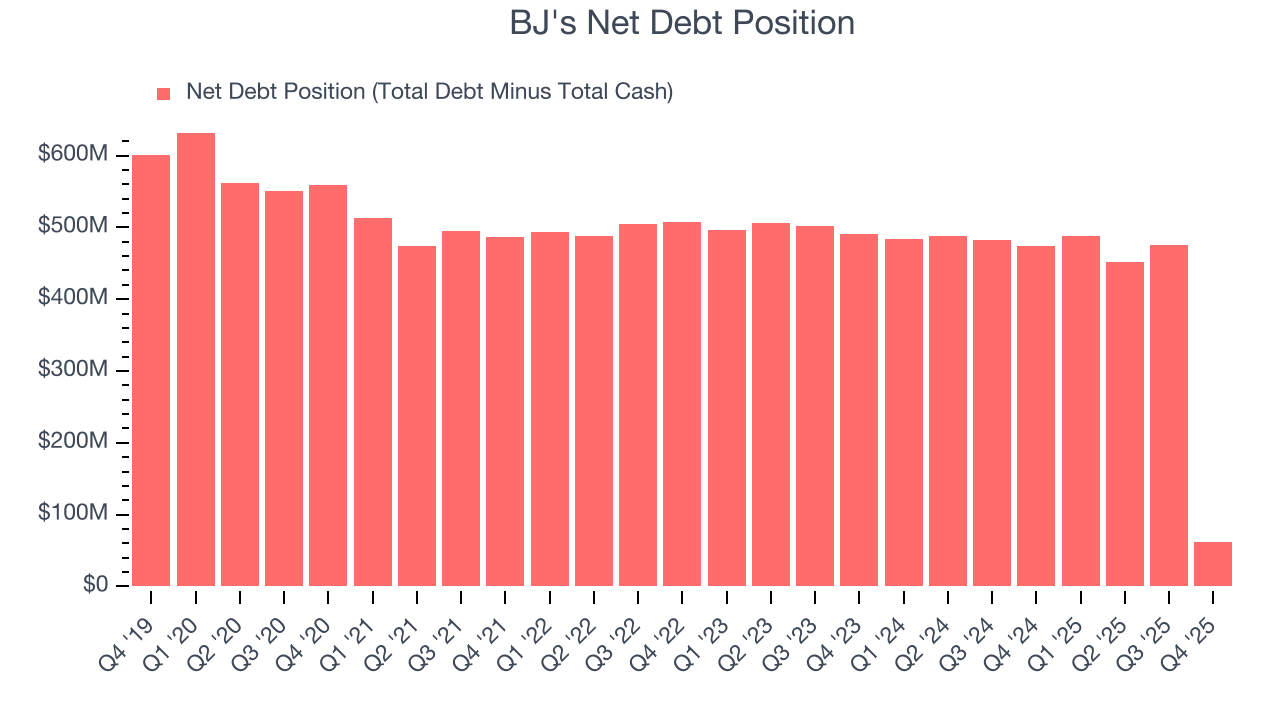
With $134.1 million of EBITDA over the last 12 months, we view BJ’s 0.5× net-debt-to-EBITDA ratio as safe. We also see its $4.75 million of annual interest expenses as appropriate. The company’s profits give it plenty of breathing room, allowing it to continue investing in growth initiatives.
13. Key Takeaways from BJ’s Q4 Results
It was good to see BJ's meet analysts’ same-store sales expectations this quarter. We were also glad its full-year EBITDA guidance slightly exceeded Wall Street’s estimates. On the other hand, its EBITDA missed. Overall, this was a softer quarter. The stock remained flat at $41.00 immediately following the results.
14. Is Now The Time To Buy BJ's?
Updated: March 13, 2026 at 10:52 PM EDT
Before investing in or passing on BJ's, we urge you to understand the company’s business quality (or lack thereof), valuation, and the latest quarterly results - in that order.
BJ's falls short of our quality standards. First off, its revenue growth was weak over the last six years, and analysts don’t see anything changing over the next 12 months. While its decent growth in new restaurants shows it’s staying on track and slowly expanding its presence, the downside is its gross margins make it more challenging to reach positive operating profits compared to other restaurant businesses. On top of that, its relatively low ROIC suggests management has struggled to find compelling investment opportunities.
BJ’s P/E ratio based on the next 12 months is 14.5x. This valuation is reasonable, but the company’s shaky fundamentals present too much downside risk. There are more exciting stocks to buy at the moment.
Wall Street analysts have a consensus one-year price target of $45.22 on the company (compared to the current share price of $33.42).
Although the price target is bullish, readers should exercise caution because analysts tend to be overly optimistic. The firms they work for, often big banks, have relationships with companies that extend into fundraising, M&A advisory, and other rewarding business lines. As a result, they typically hesitate to say bad things for fear they will lose out. We at StockStory do not suffer from such conflicts of interest, so we’ll always tell it like it is.