
Blue Bird (BLBD)
We see solid potential in Blue Bird. Its impressive sales growth and high returns on capital tee it up for fast and profitable expansion.― StockStory Analyst Team
1. News


2. Summary
Why We Like Blue Bird
With around a century of experience, Blue Bird (NASDAQ:BLBD) is a manufacturer of school buses and complementary parts.
- Incremental sales significantly boosted profitability as its annual earnings per share growth of 42.9% over the last five years outstripped its revenue performance
- Stellar returns on capital showcase management’s ability to surface highly profitable business ventures, and its returns are growing as it capitalizes on even better market opportunities
- Market share has increased this cycle as its 11.9% annual revenue growth over the last five years was exceptional


We’re optimistic about Blue Bird. The price seems reasonable relative to its quality, so this could be a favorable time to invest in some shares.
Why Is Now The Time To Buy Blue Bird?


Blue Bird is trading at $53.41 per share, or 11.8x forward P/E. Most industrials companies are more expensive, so we think Blue Bird is a good deal when considering its quality characteristics.
Our analysis and backtests show high-quality businesses routinely outperform the market over a multi-year period, especially when priced like this.
3. Blue Bird (BLBD) Research Report: Q4 CY2025 Update
School bus company Blue Bird (NASDAQ:BLBD) reported Q4 CY2025 results exceeding the market’s revenue expectations, with sales up 6.1% year on year to $333.1 million. On the other hand, the company’s full-year revenue guidance of $1.5 billion at the midpoint came in 1.5% below analysts’ estimates. Its non-GAAP profit of $1 per share was 24.8% above analysts’ consensus estimates.
Blue Bird (BLBD) Q4 CY2025 Highlights:
- Revenue: $333.1 million vs analyst estimates of $330 million (6.1% year-on-year growth, 0.9% beat)
- Adjusted EPS: $1 vs analyst estimates of $0.80 (24.8% beat)
- Adjusted EBITDA: $50.06 million vs analyst estimates of $43.21 million (15% margin, 15.8% beat)
- The company reconfirmed its revenue guidance for the full year of $1.5 billion at the midpoint
- EBITDA guidance for the full year is $225 million at the midpoint, above analyst estimates of $219.9 million
- Operating Margin: 11.3%, in line with the same quarter last year
- Free Cash Flow Margin: 9.3%, up from 7% in the same quarter last year
- Sales Volumes were flat year on year, in line with the same quarter last year
- Market Capitalization: $1.66 billion
Company Overview
With around a century of experience, Blue Bird (NASDAQ:BLBD) is a manufacturer of school buses and complementary parts.
Blue Bird, founded in 1927, began as a small bus body manufacturer for local schools. Over the following decades, it expanded its geographic presence to school districts nationwide.
Today, Blue Bird offers school buses that differ in size and configuration, ranging from buses designed for ~20 students to larger buses that accommodate upwards of 90 passengers. Its buses can be customized with a range of features including air conditioning, collision mitigation systems, and GPS tracking. While the majority of its sales derive from its diesel bus, the company also offers electric and hybrid alternatives.
In addition to its bus sales, it also provides replacement parts and accessories. Specifically, this consists of OEM (original equipment manufacturer) parts such as engines and transmissions as well as aftermarket parts like seating options and electronic systems.
Blue Bird typically engages in supply agreements, particularly for providing fleets of buses to larger school districts. These contracts may span several years and include provisions for ongoing parts and services. In addition to bus sales, Blue Bird offers leasing or financing options to accommodate the budgetary constraints of schools and organizations. Rentals are less common but are an option for short-term needs.
4. Heavy Transportation Equipment
Heavy transportation equipment companies are investing in automated vehicles that increase efficiencies and connected machinery that collects actionable data. Some are also developing electric vehicles and mobility solutions to address customers’ concerns about carbon emissions, creating new sales opportunities. Additionally, they are increasingly offering automated equipment that increases efficiencies and connected machinery that collects actionable data. On the other hand, heavy transportation equipment companies are at the whim of economic cycles. Interest rates, for example, can greatly impact the construction and transport volumes that drive demand for these companies’ offerings.
Competitors offering similar products include Lion Electric (NYSE:LEV), IC Bus (NYSE:NAV), and Thomas Built Buses (FRA:DAI).
5. Revenue Growth
A company’s long-term sales performance can indicate its overall quality. Even a bad business can shine for one or two quarters, but a top-tier one grows for years. Luckily, Blue Bird’s sales grew at an impressive 11.9% compounded annual growth rate over the last five years. Its growth surpassed the average industrials company and shows its offerings resonate with customers, a great starting point for our analysis.
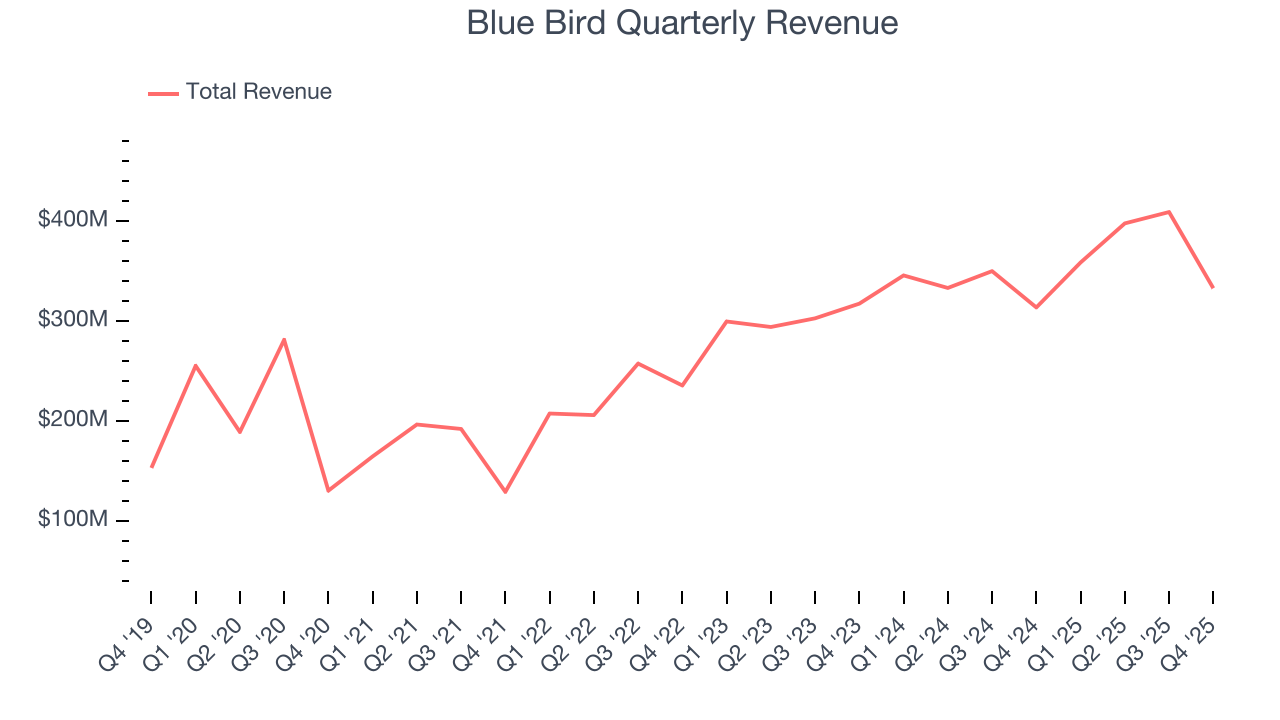
We at StockStory place the most emphasis on long-term growth, but within industrials, a half-decade historical view may miss cycles, industry trends, or a company capitalizing on catalysts such as a new contract win or a successful product line. Blue Bird’s annualized revenue growth of 11.1% over the last two years aligns with its five-year trend, suggesting its demand was predictably strong. Blue Bird’s recent performance shows it’s one of the better Heavy Transportation Equipment businesses as many of its peers faced declining sales because of cyclical headwinds. 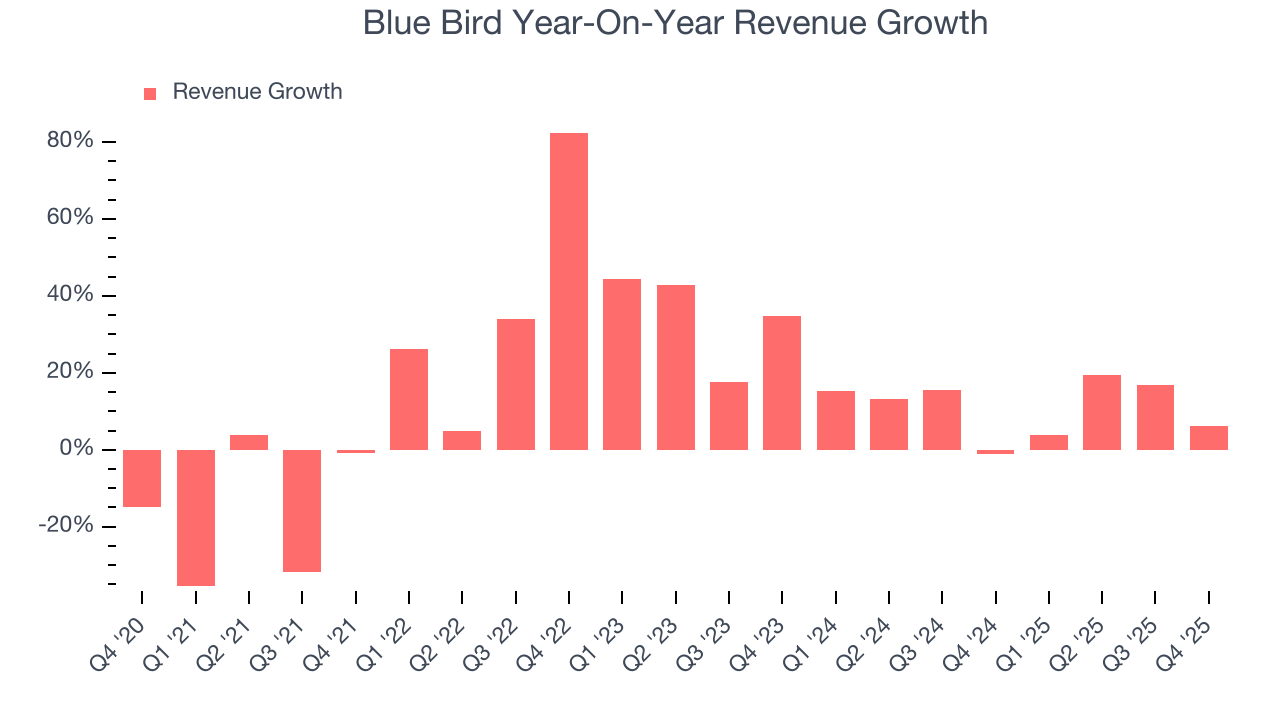
Blue Bird also reports its number of units sold, which reached 2,135 in the latest quarter. Over the last two years, Blue Bird’s units sold averaged 4.2% year-on-year growth. Because this number is lower than its revenue growth, we can see the company benefited from price increases. 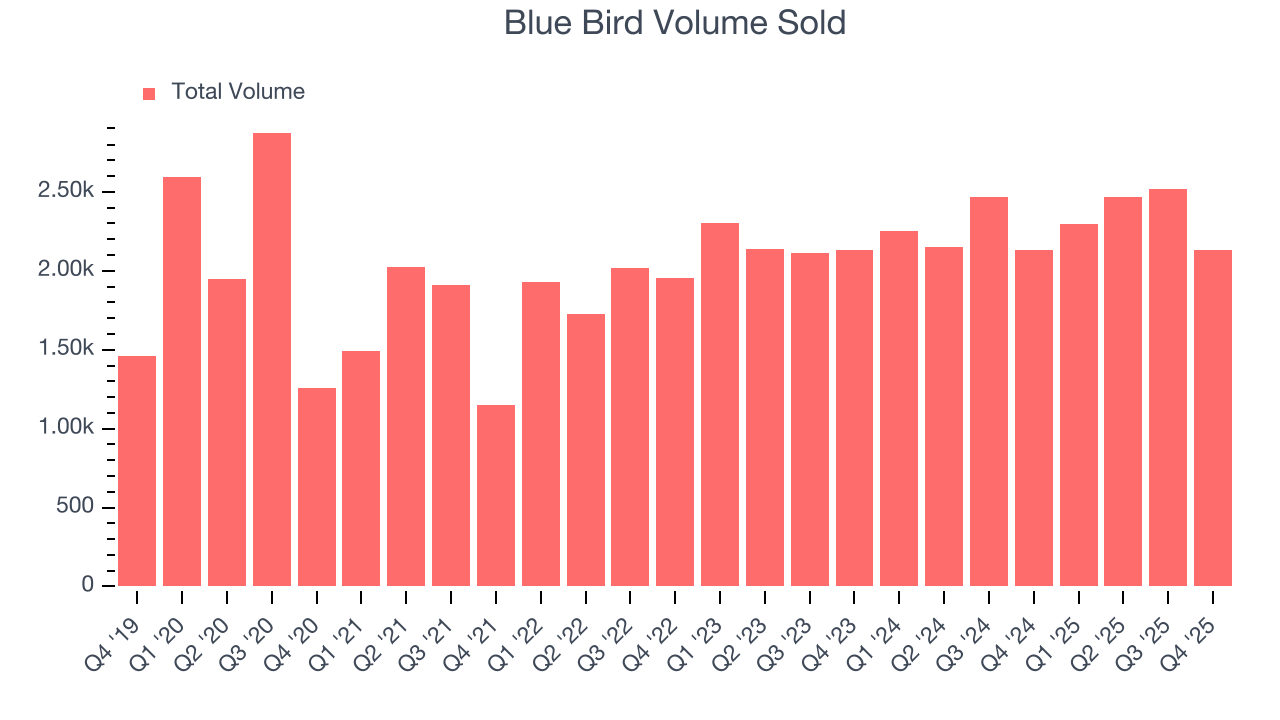
This quarter, Blue Bird reported year-on-year revenue growth of 6.1%, and its $333.1 million of revenue exceeded Wall Street’s estimates by 0.9%.
Looking ahead, sell-side analysts expect revenue to grow 3% over the next 12 months, a deceleration versus the last two years. This projection doesn't excite us and indicates its products and services will face some demand challenges. At least the company is tracking well in other measures of financial health.
6. Gross Margin & Pricing Power
Gross profit margin is a critical metric to track because it sheds light on its pricing power, complexity of products, and ability to procure raw materials, equipment, and labor.
Blue Bird has bad unit economics for an industrials business, signaling it operates in a competitive market. As you can see below, it averaged a 15.3% gross margin over the last five years. Said differently, Blue Bird had to pay a chunky $84.70 to its suppliers for every $100 in revenue. 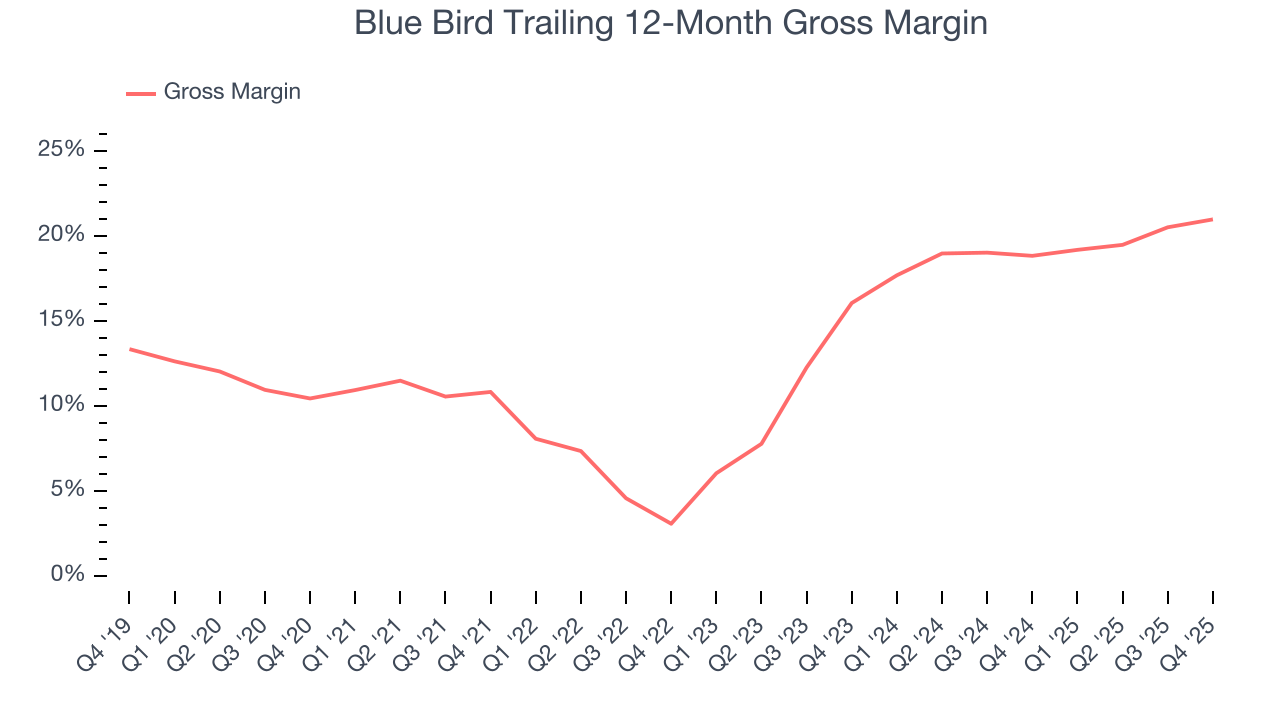
Blue Bird produced a 21.4% gross profit margin in Q4, marking a 2.2 percentage point increase from 19.2% in the same quarter last year. Blue Bird’s full-year margin has also been trending up over the past 12 months, increasing by 2.1 percentage points. If this move continues, it could suggest better unit economics due to more leverage from its growing sales on the fixed portion of its cost of goods sold (such as manufacturing expenses).
7. Operating Margin
Blue Bird was profitable over the last five years but held back by its large cost base. Its average operating margin of 6.4% was weak for an industrials business. This result isn’t too surprising given its low gross margin as a starting point.
On the plus side, Blue Bird’s operating margin rose by 10.8 percentage points over the last five years, as its sales growth gave it immense operating leverage.
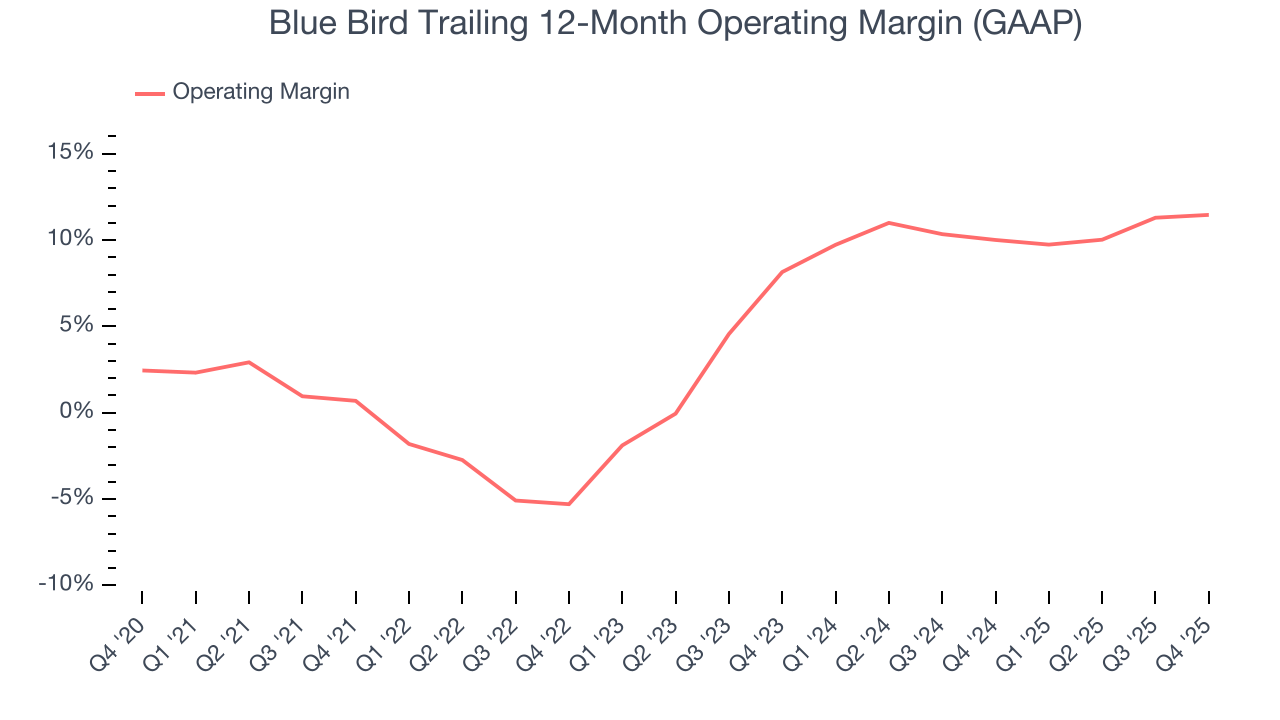
This quarter, Blue Bird generated an operating margin profit margin of 11.3%, in line with the same quarter last year. This indicates the company’s cost structure has recently been stable.
8. Earnings Per Share
Revenue trends explain a company’s historical growth, but the long-term change in earnings per share (EPS) points to the profitability of that growth – for example, a company could inflate its sales through excessive spending on advertising and promotions.
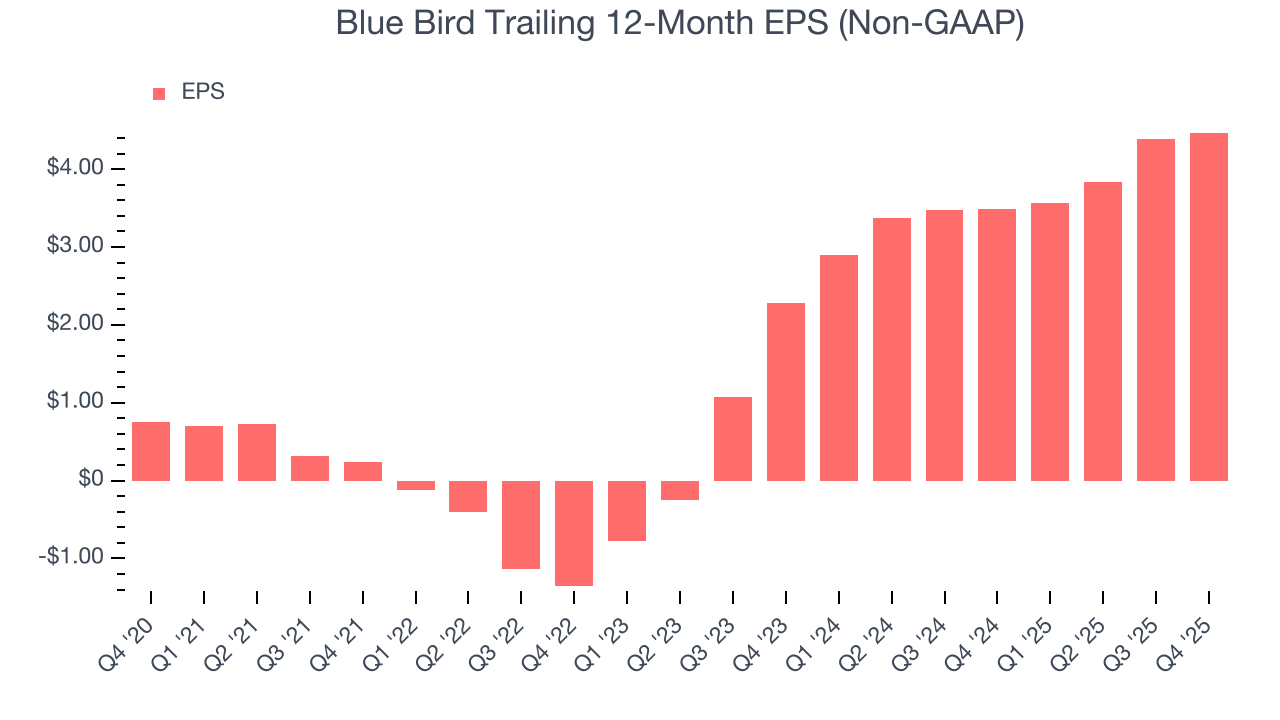
Blue Bird’s EPS grew at an astounding 42.9% compounded annual growth rate over the last five years, higher than its 11.9% annualized revenue growth. This tells us the company became more profitable on a per-share basis as it expanded.
We can take a deeper look into Blue Bird’s earnings quality to better understand the drivers of its performance. As we mentioned earlier, Blue Bird’s operating margin was flat this quarter but expanded by 10.8 percentage points over the last five years. This was the most relevant factor (aside from the revenue impact) behind its higher earnings; interest expenses and taxes can also affect EPS but don’t tell us as much about a company’s fundamentals.
Like with revenue, we analyze EPS over a more recent period because it can provide insight into an emerging theme or development for the business.
For Blue Bird, its two-year annual EPS growth of 40% was lower than its five-year trend. We still think its growth was good and hope it can accelerate in the future.
In Q4, Blue Bird reported adjusted EPS of $1, up from $0.92 in the same quarter last year. This print easily cleared analysts’ estimates, and shareholders should be content with the results. Over the next 12 months, Wall Street expects Blue Bird’s full-year EPS of $4.47 to stay about the same.
9. Cash Is King
Although earnings are undoubtedly valuable for assessing company performance, we believe cash is king because you can’t use accounting profits to pay the bills.
Blue Bird has shown mediocre cash profitability over the last five years, giving the company limited opportunities to return capital to shareholders. Its free cash flow margin averaged 5.5%, subpar for an industrials business.
Taking a step back, an encouraging sign is that Blue Bird’s margin expanded by 23.5 percentage points during that time. The company’s improvement shows it’s heading in the right direction, and we can see it became a less capital-intensive business because its free cash flow profitability rose more than its operating profitability.
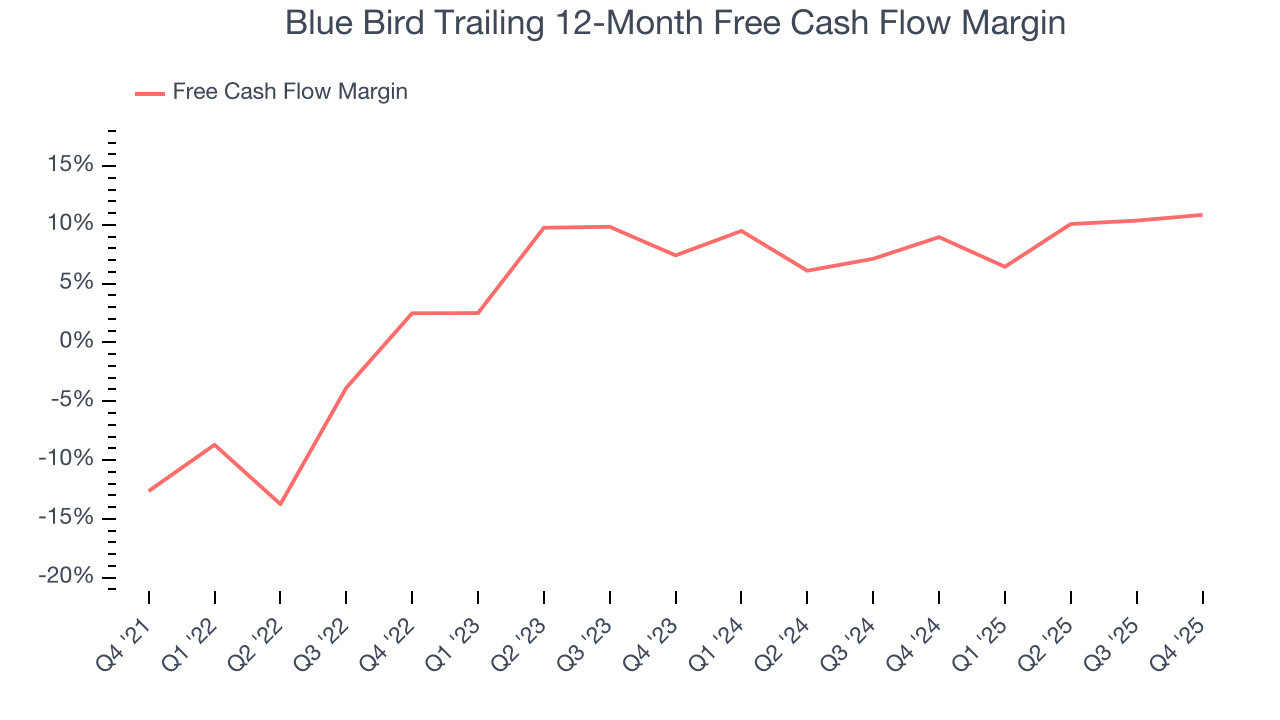
Blue Bird’s free cash flow clocked in at $31.11 million in Q4, equivalent to a 9.3% margin. This result was good as its margin was 2.4 percentage points higher than in the same quarter last year, building on its favorable historical trend.
10. Return on Invested Capital (ROIC)
EPS and free cash flow tell us whether a company was profitable while growing its revenue. But was it capital-efficient? A company’s ROIC explains this by showing how much operating profit it makes compared to the money it has raised (debt and equity).
Blue Bird’s five-year average ROIC was 32.7%, placing it among the best industrials companies. This illustrates its management team’s ability to invest in highly profitable ventures and produce tangible results for shareholders.
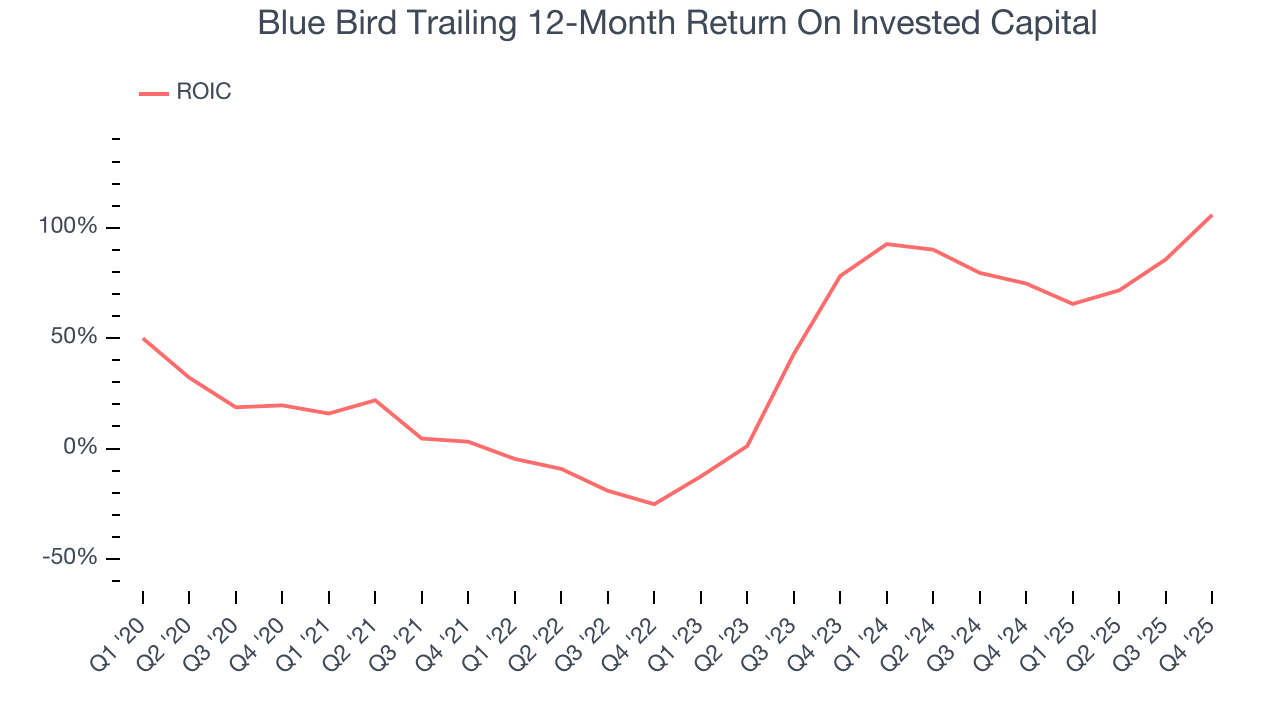
We like to invest in businesses with high returns, but the trend in a company’s ROIC is what often surprises the market and moves the stock price. Over the last few years, Blue Bird’s ROIC has increased. This is a great sign when paired with its already strong returns, but we also recognize its lack of profitable growth during the COVID era was the primary reason for the change.
11. Balance Sheet Assessment
Companies with more cash than debt have lower bankruptcy risk.
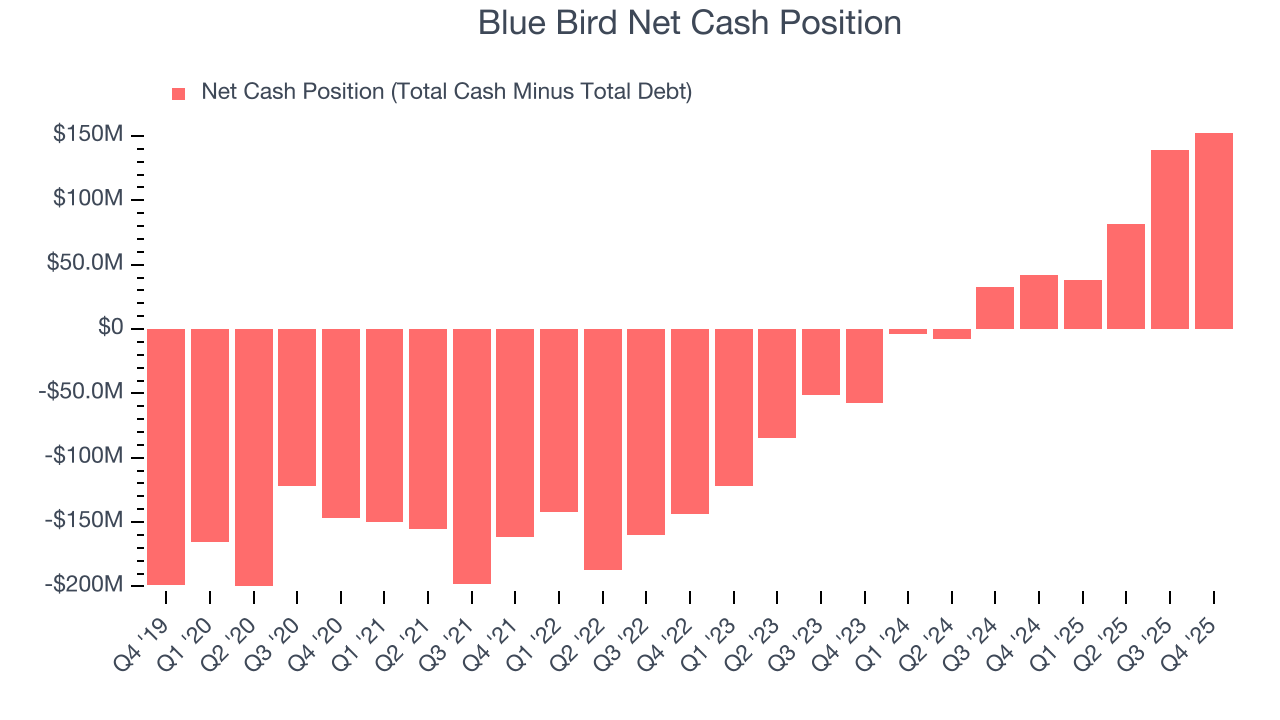
Blue Bird is a profitable, well-capitalized company with $241.7 million of cash and $89.15 million of debt on its balance sheet. This $152.6 million net cash position is 9.2% of its market cap and gives it the freedom to borrow money, return capital to shareholders, or invest in growth initiatives. Leverage is not an issue here.
12. Key Takeaways from Blue Bird’s Q4 Results
We were impressed by how significantly Blue Bird blew past analysts’ EBITDA expectations this quarter. We were also glad its EPS outperformed Wall Street’s estimates. Full-year EBITDA guidance came in ahead, but on the negative side, full-year revenue guidance missed. Overall, we think this was a decent quarter with some key metrics above expectations. The stock traded up 2.7% to $51.21 immediately following the results.
13. Is Now The Time To Buy Blue Bird?
Updated: March 15, 2026 at 11:11 PM EDT
Before making an investment decision, investors should account for Blue Bird’s business fundamentals and valuation in addition to what happened in the latest quarter.
Blue Bird is a rock-solid business worth owning. First of all, the company’s revenue growth was impressive over the last five years. And while its low gross margins indicate some combination of competitive pressures and high production costs, its rising cash profitability gives it more optionality. On top of that, Blue Bird’s expanding operating margin shows the business has become more efficient.
Blue Bird’s P/E ratio based on the next 12 months is 11.8x. Looking at the industrials landscape today, Blue Bird’s fundamentals really stand out, and we like it at this price.
Wall Street analysts have a consensus one-year price target of $69.29 on the company (compared to the current share price of $53.41), implying they see 29.7% upside in buying Blue Bird in the short term.