Bloomin' Brands (BLMN)
Bloomin' Brands is up against the odds. Its plummeting sales and returns on capital show its profits are shrinking as demand fizzles out.― StockStory Analyst Team
1. News


2. Summary
Why We Think Bloomin' Brands Will Underperform
Owner of the iconic Australian-themed Outback Steakhouse, Bloomin’ Brands (NASDAQ:BLMN) is a leading American restaurant company that owns and operates a portfolio of popular restaurant brands.
- Flat sales over the last six years suggest it must innovate and find new ways to grow
- Demand will likely be weak over the next 12 months as Wall Street expects flat revenue
- Gross margin of 15.7% reflects the bad unit economics inherent in most restaurant businesses


Bloomin' Brands’s quality doesn’t meet our hurdle. We’re redirecting our focus to better businesses.
Why There Are Better Opportunities Than Bloomin' Brands


At $5.49 per share, Bloomin' Brands trades at 6.6x forward P/E. Bloomin' Brands’s valuation may seem like a bargain, but we think there are valid reasons why it’s so cheap.
It’s better to pay up for high-quality businesses with higher long-term earnings potential rather than to buy lower-quality stocks because they appear cheap. These challenged businesses often don’t re-rate, a phenomenon known as a “value trap”.
3. Bloomin' Brands (BLMN) Research Report: Q4 CY2025 Update
Restaurant company Bloomin’ Brands (NASDAQ:BLMN) missed Wall Street’s revenue expectations in Q4 CY2025, with sales flat year on year at $975.2 million. Its non-GAAP profit of $0.25 per share was in line with analysts’ consensus estimates.
Bloomin' Brands (BLMN) Q4 CY2025 Highlights:
- Revenue: $975.2 million vs analyst estimates of $981.8 million (flat year on year, 0.7% miss)
- Adjusted EPS: $0.25 vs analyst estimates of $0.24 (in line)
- Adjusted EPS guidance for the upcoming financial year 2026 is $0.83 at the midpoint, missing analyst estimates by 4.2%
- Operating Margin: -1.4%, down from 1.7% in the same quarter last year
- Locations: 1,460 at quarter end, down from 1,463 in the same quarter last year
- Same-Store Sales were flat year on year (-1.1% in the same quarter last year)
- Market Capitalization: $500.2 million
Company Overview
Owner of the iconic Australian-themed Outback Steakhouse, Bloomin’ Brands (NASDAQ:BLMN) is a leading American restaurant company that owns and operates a portfolio of popular restaurant brands.
The company was founded in 1988 when a group of three visionary restauranteurs (Chris Sullivan, Bob Basham, and Tim Gannon) came together to form Multi-Venture Partners, whose objective was to build durable restaurant franchises.
They launched their first eatery, Outback Steakhouse, shortly after forming the company and have since expanded its banners to include Carrabba's Italian Grill, Bonefish Grill, and Fleming's Prime Steakhouse & Wine Bar. Aside from the upscale Fleming’s, each restaurant caters to those seeking a casual dining experience.
Each banner within the Bloomin’ Brands’ family offers a unique culinary journey. Outback is known for its heavy appetizers such as the Bloomin’ Onion and hearty portions of grilled steaks, seafood, and chicken. Carrabba's captures the essence of Italian cuisine with its made-from-scratch pastas and wood-fired pizzas. Bonefish specializes in fresh seafood dishes prepared with unique and vibrant flavors, and Fleming's sets the stage for a sophisticated dining experience with its prime steaks, indulgent sides, and extensive wine selection.
Bloomin’ Brands’ restaurants are typically located in suburban areas and designed to create an inviting ambiance for guests, providing the perfect setting for any occasion whether it be a family dinner, romantic date night, or celebratory gathering.
4. Sit-Down Dining
Sit-down restaurants offer a complete dining experience with table service. These establishments span various cuisines and are renowned for their warm hospitality and welcoming ambiance, making them perfect for family gatherings, special occasions, or simply unwinding. Their extensive menus range from appetizers to indulgent desserts and wines and cocktails. This space is extremely fragmented and competition includes everything from publicly-traded companies owning multiple chains to single-location mom-and-pop restaurants.
Multi-brand full-service restaurant competitors include Brinker International (NYSE:EAT), Darden (NYSE:DRI), Dine Brands (NYSE:DIN), Texas Roadhouse (NASDAQ:TXRH), and The Cheesecake Factory (NASDAQ:CAKE).
5. Revenue Growth
A company’s long-term performance is an indicator of its overall quality. Any business can put up a good quarter or two, but many enduring ones grow for years.
With $3.96 billion in revenue over the past 12 months, Bloomin' Brands is one of the larger restaurant chains in the industry and benefits from a well-known brand that influences consumer purchasing decisions. However, its scale is a double-edged sword because it’s harder to find incremental growth when your existing restaurant banners have penetrated most of the market. To expand meaningfully, Bloomin' Brands likely needs to tweak its prices, start new chains, or enter new markets.
As you can see below, Bloomin' Brands struggled to increase demand as its $3.96 billion of sales for the trailing 12 months was close to its revenue six years ago. This was mainly because it didn’t open many new restaurants.
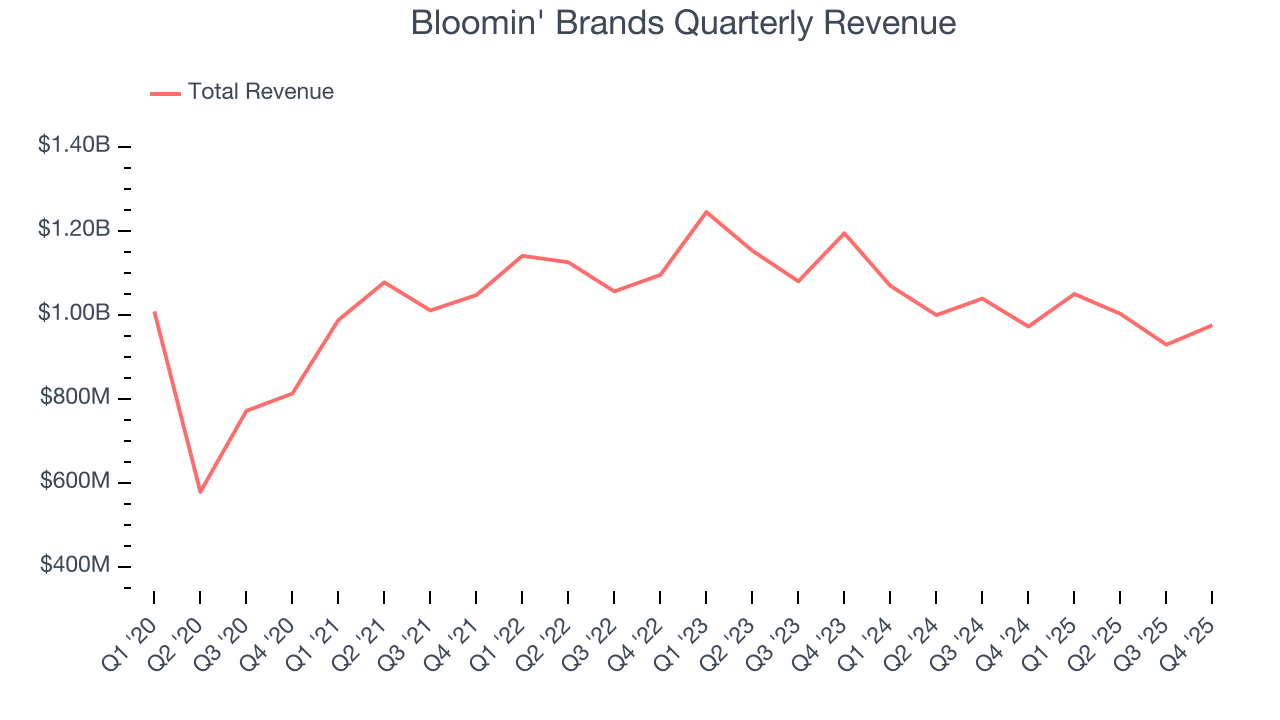
This quarter, Bloomin' Brands’s $975.2 million of revenue was flat year on year, falling short of Wall Street’s estimates.
Looking ahead, sell-side analysts expect revenue to remain flat over the next 12 months. Although this projection implies its newer menu offerings will catalyze better top-line performance, it is still below average for the sector.
6. Restaurant Performance
Number of Restaurants
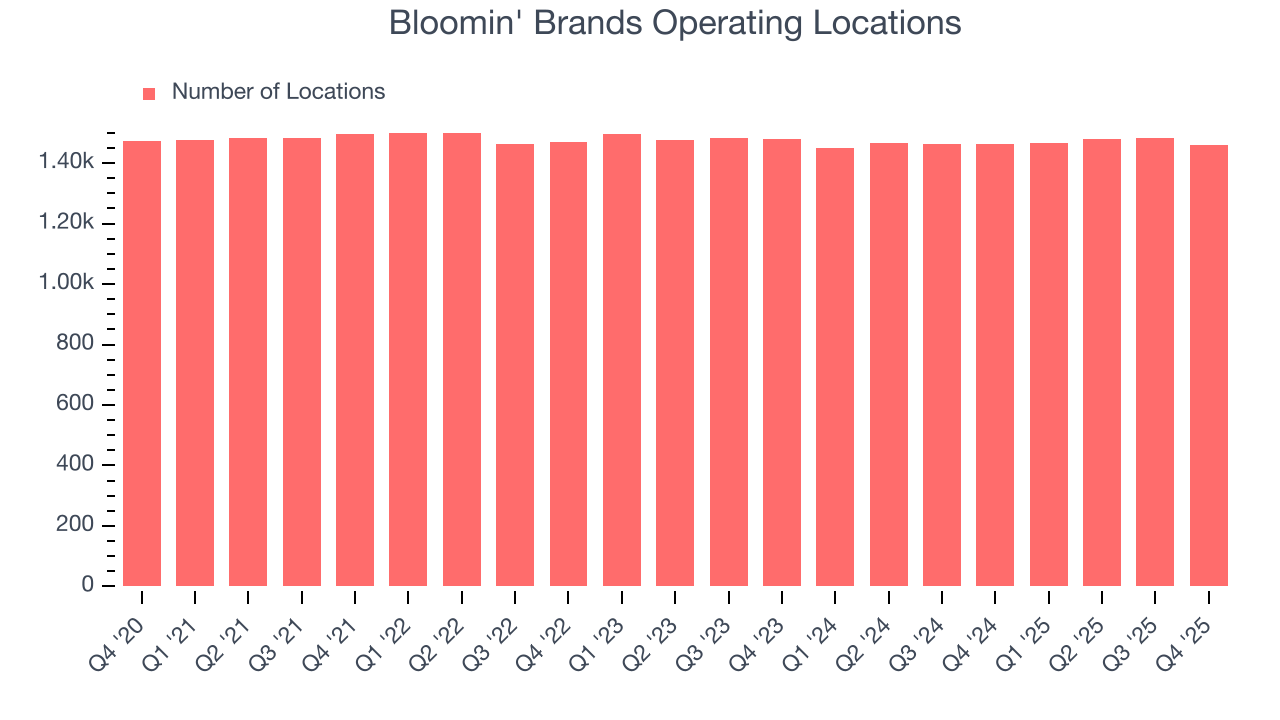
The number of dining locations a restaurant chain operates is a critical driver of how quickly company-level sales can grow.
Bloomin' Brands listed 1,460 locations in the latest quarter and has kept its restaurant count flat over the last two years while other restaurant businesses have opted for growth.
When a chain doesn’t open many new restaurants, it usually means there’s stable demand for its meals and it’s focused on improving operational efficiency to increase profitability.
Same-Store Sales
A company's restaurant base only paints one part of the picture. When demand is high, it makes sense to open more. But when demand is low, it’s prudent to close some locations and use the money in other ways. Same-store sales is an industry measure of whether revenue is growing at those existing restaurants and is driven by customer visits (often called traffic) and the average spending per customer (ticket).
Bloomin' Brands’s demand within its existing dining locations has barely increased over the last two years as its same-store sales were flat. This performance isn’t ideal, and we’d be skeptical if Bloomin' Brands starts opening new restaurants to artificially boost revenue growth.
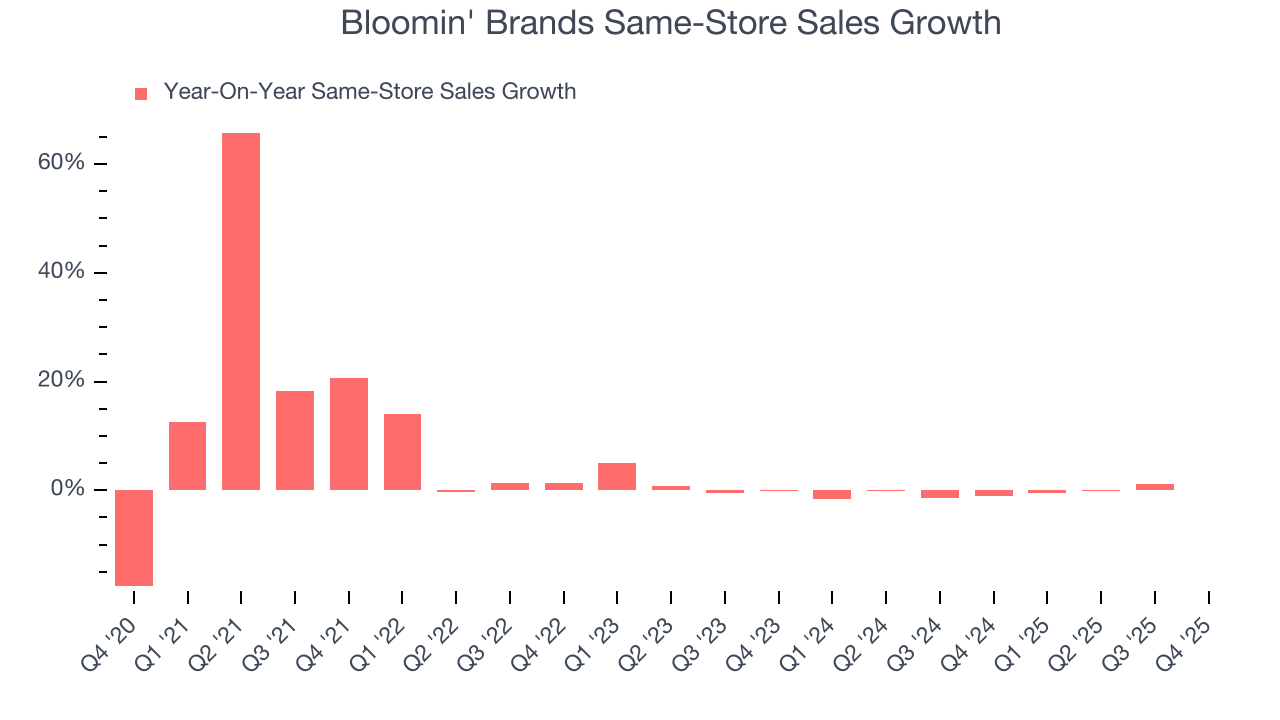
In the latest quarter, Bloomin' Brands’s year on year same-store sales were flat. This performance was more or less in line with its historical levels.
7. Gross Margin & Pricing Power
Gross profit margins are an important measure of a restaurant’s pricing power and differentiation, whether it be the dining experience or quality and taste of food.
Bloomin' Brands has bad unit economics for a restaurant company, signaling it operates in a competitive market and has little room for error if demand unexpectedly falls. As you can see below, it averaged a 15.6% gross margin over the last two years. That means Bloomin' Brands paid its suppliers a lot of money ($84.39 for every $100 in revenue) to run its business. 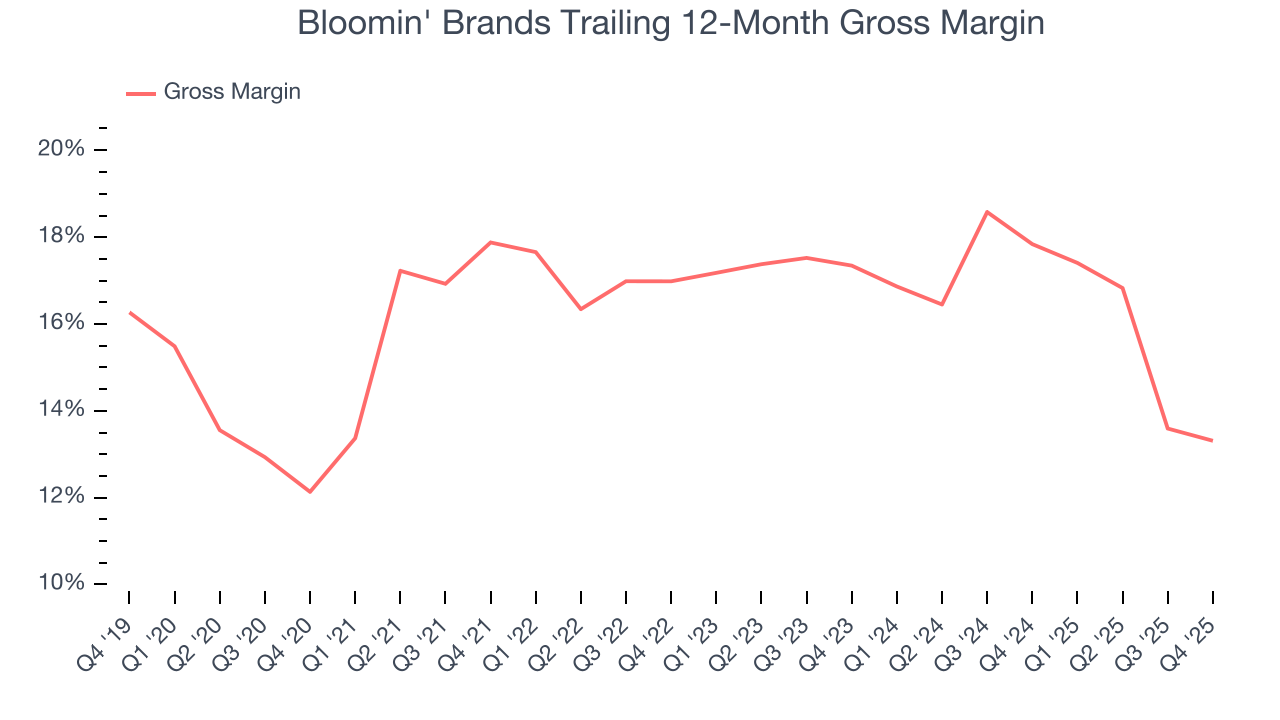
This quarter, Bloomin' Brands’s gross profit margin was 13.1%, marking a 1.1 percentage point decrease from 14.2% in the same quarter last year. Bloomin' Brands’s full-year margin has also been trending down over the past 12 months, decreasing by 4.5 percentage points. If this move continues, it could suggest a more competitive environment with some pressure to lower prices and higher input costs (such as ingredients and transportation expenses).
8. Operating Margin
Operating margin is an important measure of profitability as it shows the portion of revenue left after accounting for all core expenses – everything from the cost of goods sold to advertising and wages. It’s also useful for comparing profitability across companies with different levels of debt and tax rates because it excludes interest and taxes.
Bloomin' Brands was profitable over the last two years but held back by its large cost base. Its average operating margin of 2.3% was weak for a restaurant business. This result isn’t too surprising given its low gross margin as a starting point.
Looking at the trend in its profitability, Bloomin' Brands’s operating margin decreased by 2.7 percentage points over the last year. Bloomin' Brands’s performance was poor no matter how you look at it - it shows that costs were rising and it couldn’t pass them onto its customers.
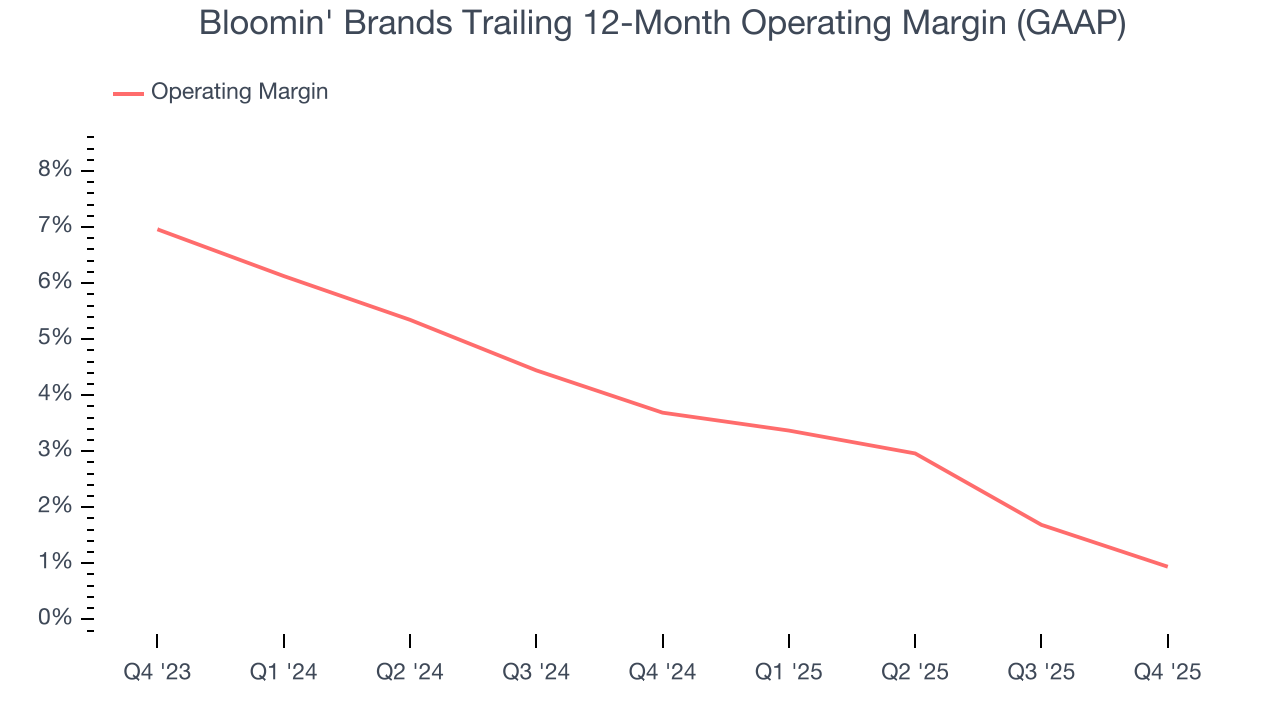
In Q4, Bloomin' Brands generated an operating margin profit margin of negative 1.4%, down 3 percentage points year on year. Since Bloomin' Brands’s operating margin decreased more than its gross margin, we can assume it was less efficient because expenses such as marketing, and administrative overhead increased.
9. Earnings Per Share
Revenue trends explain a company’s historical growth, but the long-term change in earnings per share (EPS) points to the profitability of that growth – for example, a company could inflate its sales through excessive spending on advertising and promotions.
Sadly for Bloomin' Brands, its EPS declined by 4.9% annually over the last six years while its revenue was flat. This tells us the company struggled because its fixed cost base made it difficult to adjust to choppy demand.
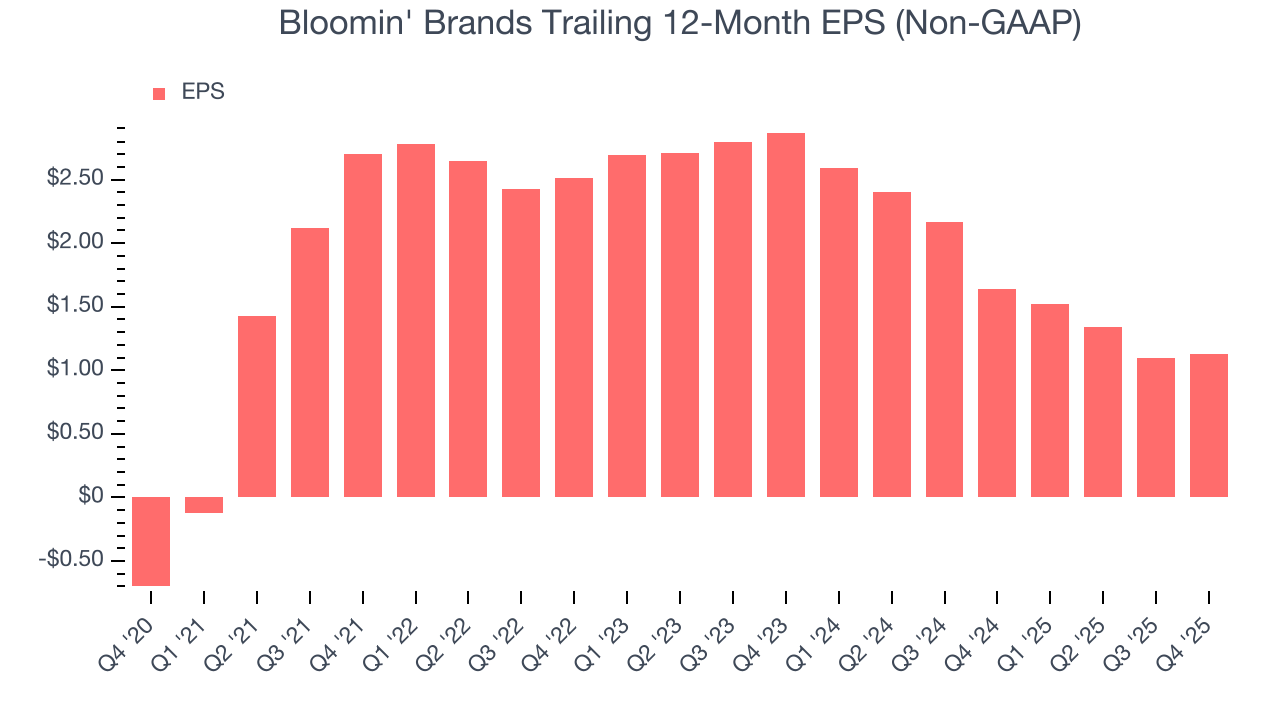
In Q4, Bloomin' Brands reported adjusted EPS of $0.25, up from $0.22 in the same quarter last year. This print beat analysts’ estimates by 2.4%. Over the next 12 months, Wall Street expects Bloomin' Brands’s full-year EPS of $1.13 to shrink by 21%.
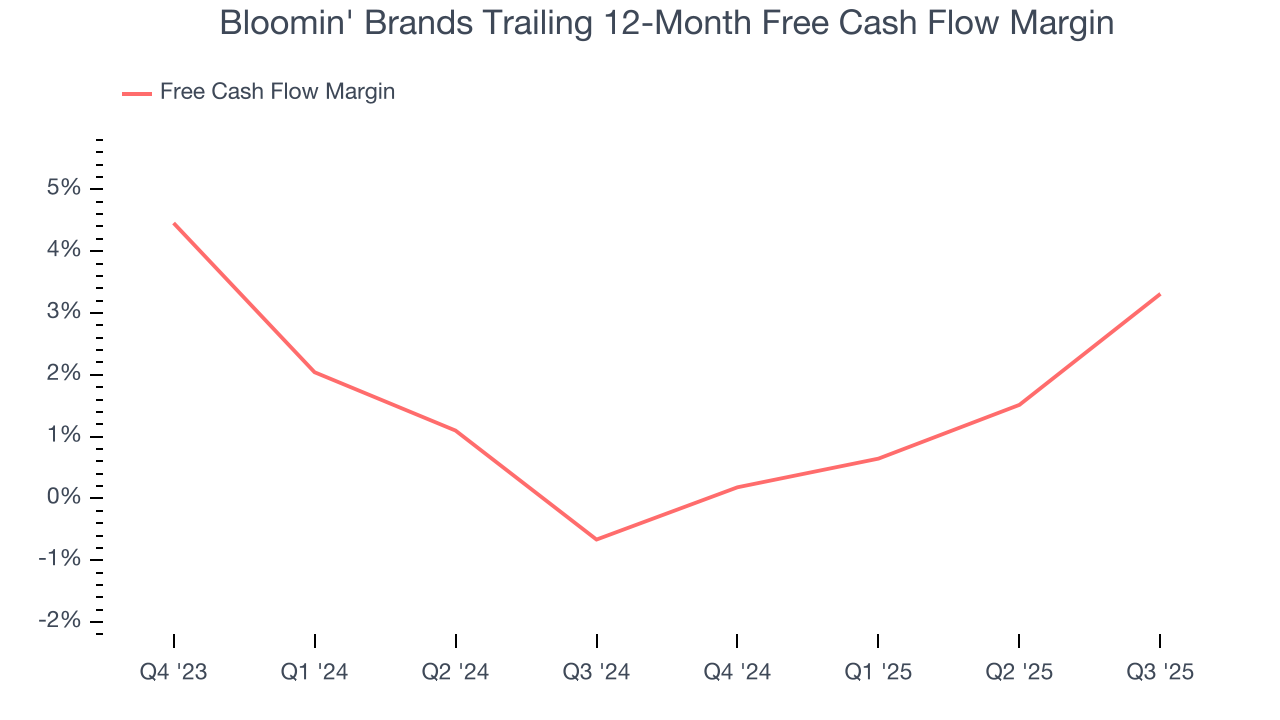
10. Cash Is King
Although earnings are undoubtedly valuable for assessing company performance, we believe cash is king because you can’t use accounting profits to pay the bills.
Bloomin' Brands broke even from a free cash flow perspective over the last two years, giving the company limited opportunities to return capital to shareholders.
11. Return on Invested Capital (ROIC)
EPS and free cash flow tell us whether a company was profitable while growing its revenue. But was it capital-efficient? A company’s ROIC explains this by showing how much operating profit it makes compared to the money it has raised (debt and equity).
Although Bloomin' Brands hasn’t been the highest-quality company lately because of its poor revenue and EPS performance, it historically found a few growth initiatives that worked. Its five-year average ROIC was 12%, higher than most restaurant businesses.
12. Balance Sheet Assessment
Bloomin' Brands reported $59.46 million of cash and $787.4 million of debt on its balance sheet in the most recent quarter. As investors in high-quality companies, we primarily focus on two things: 1) that a company’s debt level isn’t too high and 2) that its interest payments are not excessively burdening the business.
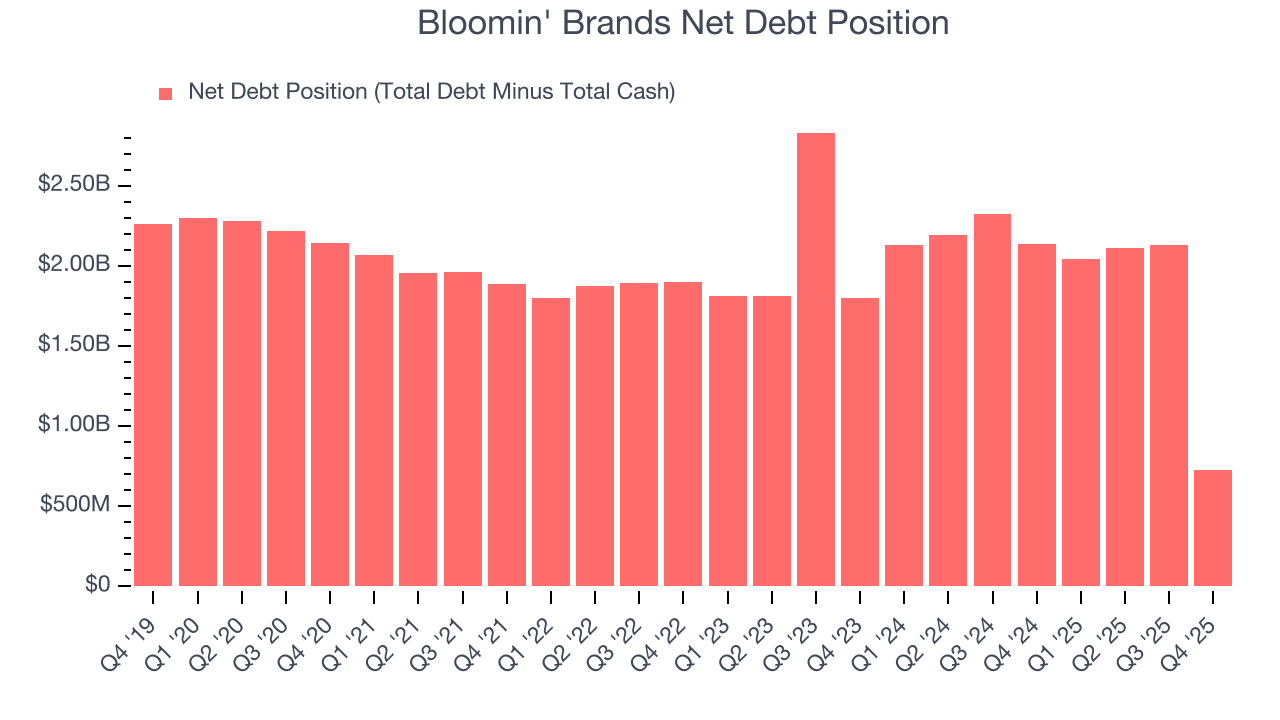
With $271.2 million of EBITDA over the last 12 months, we view Bloomin' Brands’s 2.7× net-debt-to-EBITDA ratio as safe. We also see its $45.35 million of annual interest expenses as appropriate. The company’s profits give it plenty of breathing room, allowing it to continue investing in growth initiatives.
13. Key Takeaways from Bloomin' Brands’s Q4 Results
We were impressed by Bloomin' Brands’s optimistic EPS guidance for next quarter, which blew past analysts’ expectations. On the other hand, its EBITDA missed and its full-year EPS guidance fell short of Wall Street’s estimates. Overall, this quarter could have been better. The stock traded up 4.3% to $6.12 immediately following the results.
14. Is Now The Time To Buy Bloomin' Brands?
Updated: March 12, 2026 at 10:52 PM EDT
We think that the latest earnings result is only one piece of the bigger puzzle. If you’re deciding whether to own Bloomin' Brands, you should also grasp the company’s longer-term business quality and valuation.
We cheer for all companies serving everyday consumers, but in the case of Bloomin' Brands, we’ll be cheering from the sidelines. First off, its revenue has declined over the last six years. While its favorable reputation gives it meaningful influence over consumers’ dining decisions, the downside is its projected EPS for the next year is lacking. On top of that, its gross margins make it more challenging to reach positive operating profits compared to other restaurant businesses.
Bloomin' Brands’s P/E ratio based on the next 12 months is 6.6x. While this valuation is optically cheap, the potential downside is huge given its shaky fundamentals. There are more exciting stocks to buy at the moment.
Wall Street analysts have a consensus one-year price target of $7.35 on the company (compared to the current share price of $5.49).
Although the price target is bullish, readers should exercise caution because analysts tend to be overly optimistic. The firms they work for, often big banks, have relationships with companies that extend into fundraising, M&A advisory, and other rewarding business lines. As a result, they typically hesitate to say bad things for fear they will lose out. We at StockStory do not suffer from such conflicts of interest, so we’ll always tell it like it is.