
G-III (GIII)
G-III is in for a bumpy ride. Its weak sales growth and low returns on capital show it struggled to generate demand and profits.― StockStory Analyst Team
1. News


2. Summary
Why We Think G-III Will Underperform
Founded as a small leather goods business, G-III (NASDAQ:GIII) is a fashion and apparel conglomerate with a diverse portfolio of brands.
- Sales trends were unexciting over the last five years as its 7.5% annual growth was below the typical consumer discretionary company
- Forecasted revenue decline of 8.3% for the upcoming 12 months implies demand will fall even further
- Operating margin falls short of the industry average, and the smaller profit dollars make it harder to react to unexpected market developments


G-III doesn’t satisfy our quality benchmarks. There are more promising prospects in the market.
Why There Are Better Opportunities Than G-III


At $25.76 per share, G-III trades at 11.2x forward P/E. G-III’s multiple may seem like a great deal among consumer discretionary peers, but we think there are valid reasons why it’s this cheap.
Our advice is to pay up for elite businesses whose advantages are tailwinds to earnings growth. Don’t get sucked into lower-quality businesses just because they seem like bargains. These mediocre businesses often never achieve a higher multiple as hoped, a phenomenon known as a “value trap”.
3. G-III (GIII) Research Report: Q4 CY2025 Update
Fashion conglomerate G-III (NASDAQ:GIII) fell short of the market’s revenue expectations in Q4 CY2025, with sales falling 8.1% year on year to $771.5 million. On the other hand, the company’s outlook for the full year was close to analysts’ estimates with revenue guided to $2.71 billion at the midpoint. Its non-GAAP profit of $0.30 per share was 49% below analysts’ consensus estimates.
G-III (GIII) Q4 CY2025 Highlights:
- Revenue: $771.5 million vs analyst estimates of $792 million (8.1% year-on-year decline, 2.6% miss)
- Adjusted EPS: $0.30 vs analyst expectations of $0.59 (49% miss)
- Adjusted EPS guidance for the upcoming financial year 2027 is $2.05 at the midpoint, missing analyst estimates by 30%
- EBITDA guidance for the upcoming financial year 2027 is $160 million at the midpoint, below analyst estimates of $214.2 million
- Operating Margin: -3.8%, down from 8.5% in the same quarter last year
- Market Capitalization: $1.25 billion
Company Overview
Founded as a small leather goods business, G-III (NASDAQ:GIII) is a fashion and apparel conglomerate with a diverse portfolio of brands.
G-III's portfolio of licensed and owned brands caters to both the luxury and mass market segments. The company holds licenses for household names such as Calvin Klein, Tommy Hilfiger, Levi's, and Champion, allowing it to produce and sell products under these esteemed labels. G-III also owns brands such as DKNY, Donna Karan, Vilebrequin, G.H. Bass, and Andrew Marc.
The G-III customer is the average consumer who seeks a combination of style and value. These customers tend to value name brands and have been conditioned to shop for items that are on sale or offered at a promotional price.
G-III leverages an extensive distribution network to reach its customers, including department stores, specialty retailers, online retailers, and its own branded brick-and-mortar stores. This multi-channel distribution strategy enables G-III to sell its products globally.
4. Consumer Discretionary - Apparel and Accessories
The Consumer Discretionary sector, by definition, is made up of companies selling non-essential goods and services. When economic conditions deteriorate or tastes shift, consumers can easily cut back or eliminate these purchases. For long-term investors with five-year holding periods, this creates a structural challenge: the sector is inherently hit-driven, with low switching costs and fickle customers. As a result, only a handful of companies can reliably grow demand and compound earnings over long periods, which is why our bar is high and High Quality ratings are rare.
Apparel and accessories companies design, brand, and distribute clothing, handbags, jewelry, and related lifestyle products, often spanning multiple price tiers. Tailwinds include premiumization trends (consumers trading up for perceived quality), international expansion into emerging markets, and growing digital commerce penetration. However, these businesses face headwinds from highly cyclical demand, intense promotional environments, and counterfeit competition undermining brand equity. Tariff volatility and sourcing concentration in a handful of countries add risk. Additionally, rapidly changing fashion cycles and the rise of ultra-fast-fashion digital competitors compress product life cycles and make demand forecasting exceptionally difficult.
G-III’s primary competitors include Ralph Lauren (NYSE:RL), VF Corp (NYSE:VFC), owner of The North Face and Timberland, and Capri Holdings (NYSE:CPRI), owner of Michael Kors and Versace.
5. Revenue Growth
A company’s long-term sales performance is one signal of its overall quality. Any business can experience short-term success, but top-performing ones enjoy sustained growth for years. Unfortunately, G-III’s 7.5% annualized revenue growth over the last five years was weak. This fell short of our benchmark for the consumer discretionary sector and is a poor baseline for our analysis.
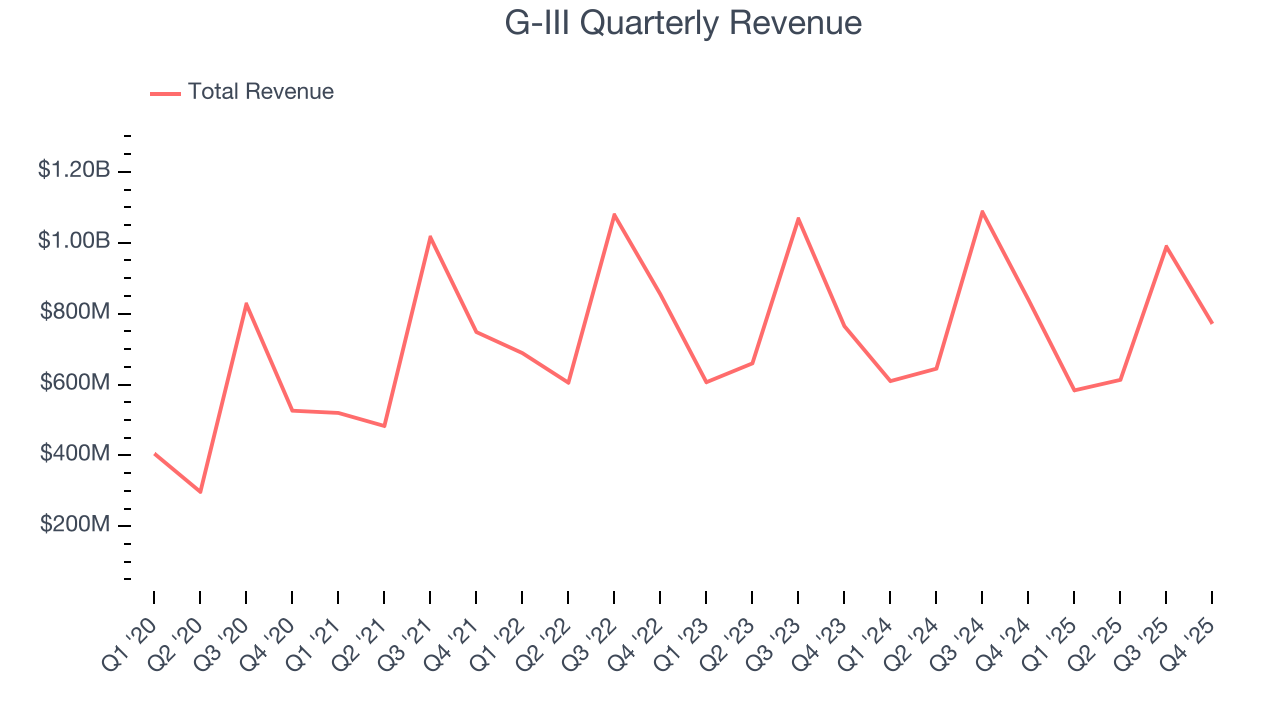
Long-term growth is the most important, but within consumer discretionary, product cycles are short and revenue can be hit-driven due to rapidly changing trends and consumer preferences. G-III’s performance shows it grew in the past but relinquished its gains over the last two years, as its revenue fell by 2.3% annually. 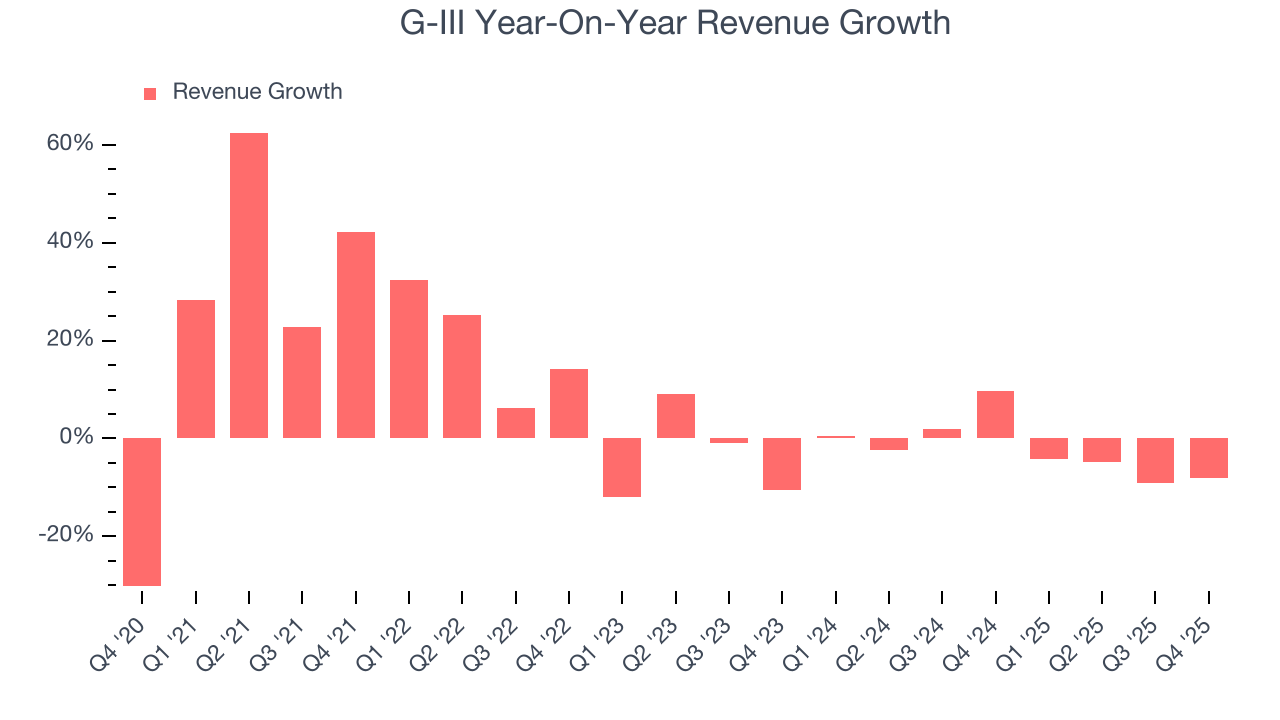
This quarter, G-III missed Wall Street’s estimates and reported a rather uninspiring 8.1% year-on-year revenue decline, generating $771.5 million of revenue.
Looking ahead, sell-side analysts expect revenue to decline by 7% over the next 12 months, a deceleration versus the last two years. This projection doesn't excite us and indicates its products and services will face some demand challenges.
6. Operating Margin
Operating margin is a key measure of profitability. Think of it as net income - the bottom line - excluding the impact of taxes and interest on debt, which are less connected to business fundamentals.
G-III’s operating margin has shrunk over the last 12 months and averaged 6.5% over the last two years. The company’s profitability was mediocre for a consumer discretionary business and shows it couldn’t pass its higher operating expenses onto its customers.
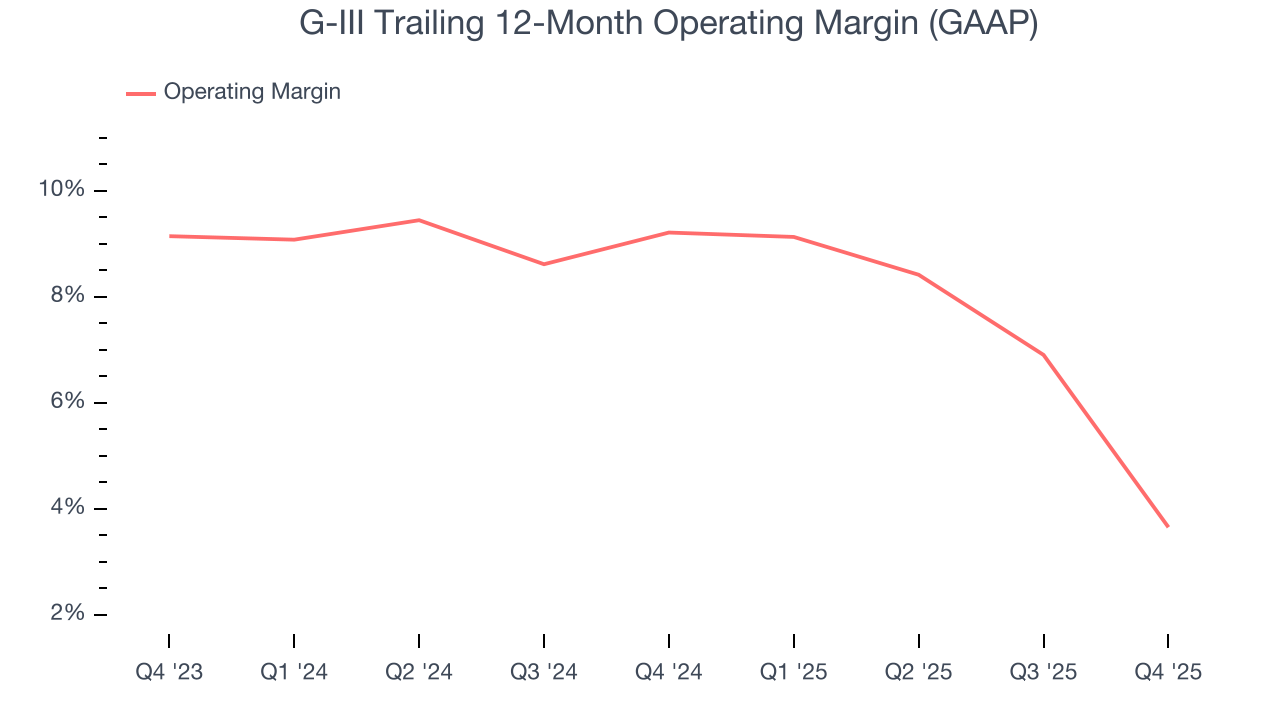
In Q4, G-III generated an operating margin profit margin of negative 3.8%, down 12.3 percentage points year on year. This contraction shows it was less efficient because its expenses increased relative to its revenue.
7. Earnings Per Share
Revenue trends explain a company’s historical growth, but the long-term change in earnings per share (EPS) points to the profitability of that growth – for example, a company could inflate its sales through excessive spending on advertising and promotions.
G-III’s EPS grew at 34% compounded annual growth rate over the last five years, higher than its 7.5% annualized revenue growth. However, this alone doesn’t tell us much about its business quality because its operating margin didn’t improve.
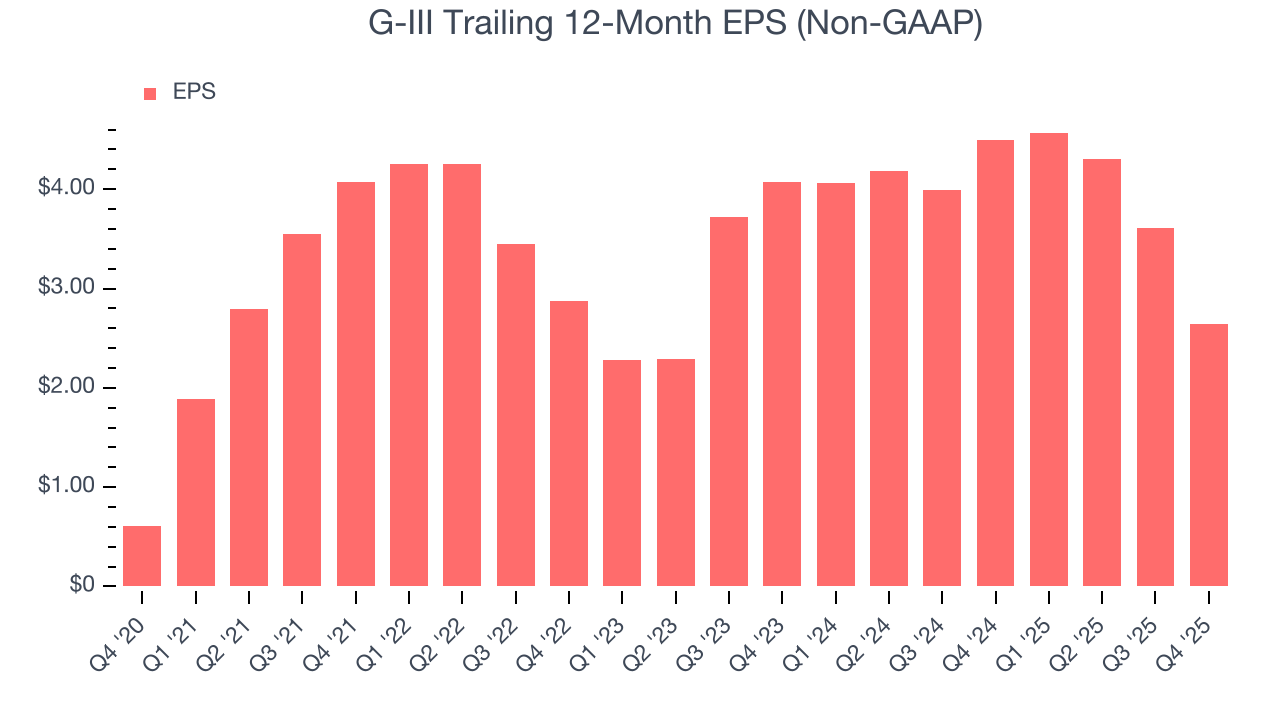
In Q4, G-III reported adjusted EPS of $0.30, down from $1.27 in the same quarter last year. This print missed analysts’ estimates, but we care more about long-term adjusted EPS growth than short-term movements. Over the next 12 months, Wall Street expects G-III’s full-year EPS of $2.64 to grow 14.9%.
8. Cash Is King
Free cash flow isn't a prominently featured metric in company financials and earnings releases, but we think it's telling because it accounts for all operating and capital expenses, making it tough to manipulate. Cash is king.
G-III has shown poor cash profitability relative to peers over the last two years, giving the company fewer opportunities to return capital to shareholders. Its free cash flow margin averaged 5.9%, below what we’d expect for a consumer discretionary business.

9. Return on Invested Capital (ROIC)
EPS and free cash flow tell us whether a company was profitable while growing its revenue. But was it capital-efficient? Enter ROIC, a metric showing how much operating profit a company generates relative to the money it has raised (debt and equity).
G-III historically did a mediocre job investing in profitable growth initiatives. Its five-year average ROIC was 7.8%, somewhat low compared to the best consumer discretionary companies that consistently pump out 25%+.
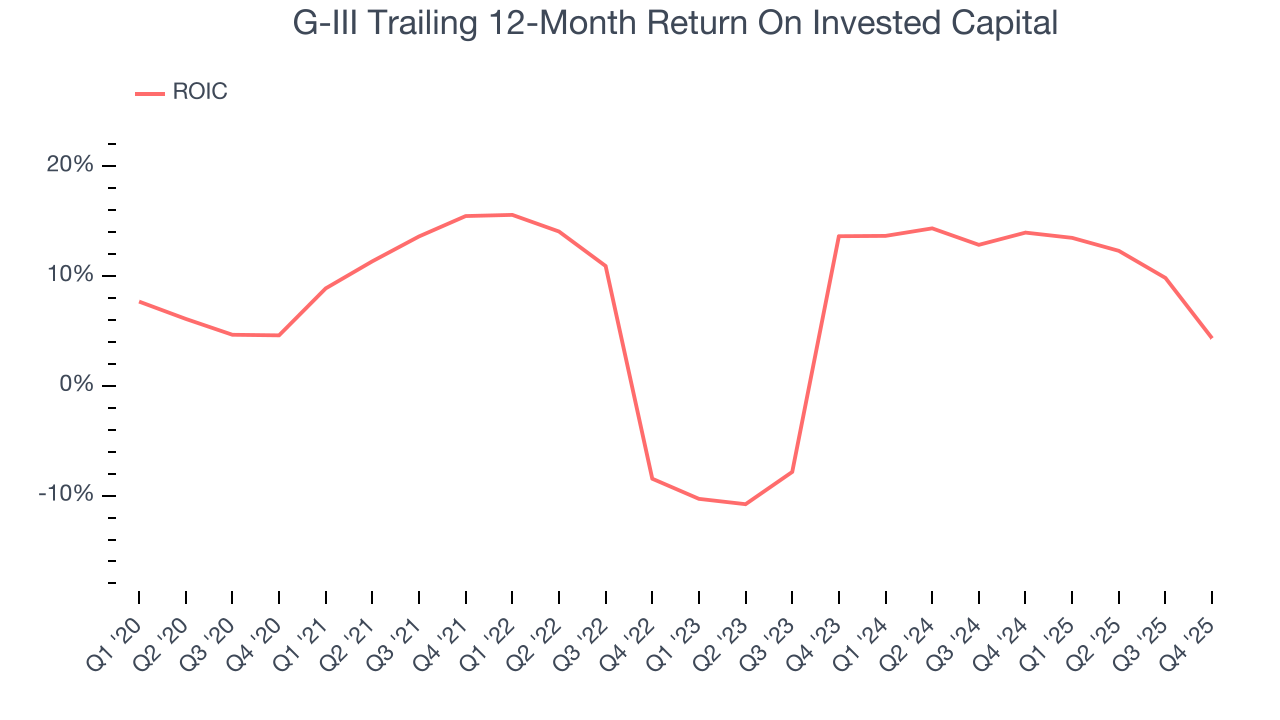
We like to invest in businesses with high returns, but the trend in a company’s ROIC is what often surprises the market and moves the stock price. Over the last few years, G-III’s ROIC has increased. This is a good sign, and we hope the company can continue improving.
10. Balance Sheet Assessment
One of the best ways to mitigate bankruptcy risk is to hold more cash than debt.
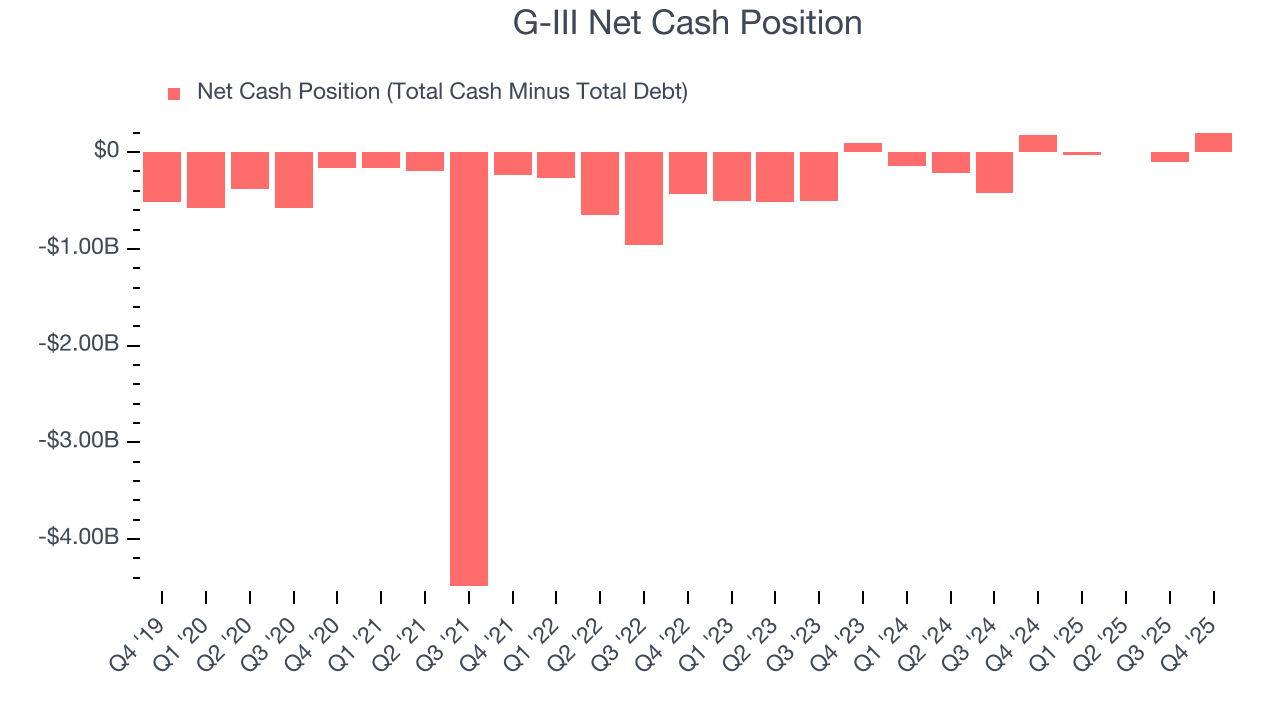
G-III is a profitable, well-capitalized company with $374.9 million of cash and $172.8 million of debt on its balance sheet. This $202.1 million net cash position is 18.2% of its market cap and gives it the freedom to borrow money, return capital to shareholders, or invest in growth initiatives. Leverage is not an issue here.
11. Key Takeaways from G-III’s Q4 Results
We struggled to find many positives in these results. Its full-year EBITDA guidance missed and its EPS fell short of Wall Street’s estimates. Overall, this quarter could have been better. The stock traded down 12.3% to $25.93 immediately after reporting.
12. Is Now The Time To Buy G-III?
Updated: March 13, 2026 at 10:44 PM EDT
The latest quarterly earnings matters, sure, but we actually think longer-term fundamentals and valuation matter more. Investors should consider all these pieces before deciding whether or not to invest in G-III.
G-III falls short of our quality standards. While its decent EPS growth over the last five years shows its profits are trickling down to shareholders, the downside is its Forecasted free cash flow margin suggests the company will ramp up its investments next year. On top of that, its projected EPS for the next year is lacking.
G-III’s P/E ratio based on the next 12 months is 11.2x. This valuation is reasonable, but the company’s shaky fundamentals present too much downside risk. There are better investments elsewhere.
Wall Street analysts have a consensus one-year price target of $32 on the company (compared to the current share price of $25.76).
Although the price target is bullish, readers should exercise caution because analysts tend to be overly optimistic. The firms they work for, often big banks, have relationships with companies that extend into fundraising, M&A advisory, and other rewarding business lines. As a result, they typically hesitate to say bad things for fear they will lose out. We at StockStory do not suffer from such conflicts of interest, so we’ll always tell it like it is.