
Stitch Fix (SFIX)
Stitch Fix faces an uphill battle. Its shrinking sales suggest demand is waning and its lousy free cash flow generation doesn’t do it any favors.― StockStory Analyst Team
1. News
2. Summary
Why We Think Stitch Fix Will Underperform
One of the original subscription box companies, Stitch Fix (NASDAQ:SFIX) is an online personal styling and fashion service that curates personalized clothing selections for customers.
- Products and services have few die-hard fans as sales have declined by 6.1% annually over the last five years
- Poor expense management has led to operating margin losses
- Poor free cash flow generation means it has few chances to reinvest for growth, repurchase shares, or distribute capital


Stitch Fix’s quality is not up to our standards. We’d search for superior opportunities elsewhere.
Why There Are Better Opportunities Than Stitch Fix


Stitch Fix is trading at $3.29 per share, or 0.3x forward price-to-sales. The market typically values companies like Stitch Fix based on their anticipated profits for the next 12 months, but it expects the business to lose money. We also think the upside isn’t great compared to the potential downside here - there are more exciting stocks to buy.
We’d rather pay a premium for quality. Cheap stocks can look like a great deal at first glance, but they can be value traps. Less earnings power means more reliance on a re-rating to generate good returns; this can be an unlikely scenario for low-quality companies.
3. Stitch Fix (SFIX) Research Report: Q4 CY2025 Update
Personalized clothing company Stitch Fix (NASDAQ:SFIX) reported revenue ahead of Wall Street’s expectations in Q4 CY2025, with sales up 9.4% year on year to $341.3 million. On the other hand, next quarter’s revenue guidance of $332.5 million was less impressive, coming in 0.6% below analysts’ estimates. Its GAAP loss of $0.02 per share was 60.9% above analysts’ consensus estimates.
Stitch Fix (SFIX) Q4 CY2025 Highlights:
- Revenue: $341.3 million vs analyst estimates of $335.7 million (9.4% year-on-year growth, 1.7% beat)
- EPS (GAAP): -$0.02 vs analyst estimates of -$0.05 (60.9% beat)
- Adjusted EBITDA: $15.93 million vs analyst estimates of $11.1 million (4.7% margin, 43.5% beat)
- The company slightly lifted its revenue guidance for the full year to $1.34 billion at the midpoint from $1.34 billion
- EBITDA guidance for the full year is $46 million at the midpoint, above analyst estimates of $42.27 million
- Operating Margin: -1.4%, up from -2.9% in the same quarter last year
- Free Cash Flow was $3.35 million, up from -$19.44 million in the same quarter last year
- Active Clients: 2.29 million, down 83,000 year on year
- Market Capitalization: $465 million
Company Overview
One of the original subscription box companies, Stitch Fix (NASDAQ:SFIX) is an online personal styling and fashion service that curates personalized clothing selections for customers.
The company’s vision is to create a convenient shopping experience that uses data to help people discover and buy clothing that truly suits their style.
Stitch Fix’s unique selling point is its combination of technology and human stylists. Customers fill out detailed online style surveys, and the company’s algorithms and human stylists select clothing items that are a potential match. This apparel, which includes everything from t-shirts to socks, is then shipped to the customer, who can select which items they'd like to purchase and send the rest back.
Stitch Fix operates as a subscription-based personal styling service, generating revenue from subscription fees and the clothing its customers purchase. Consumers who are not subscribed to Stitch Fix can also receive boxes by paying a styling fee to the company.
4. Consumer Discretionary - Apparel and Accessories
The Consumer Discretionary sector, by definition, is made up of companies selling non-essential goods and services. When economic conditions deteriorate or tastes shift, consumers can easily cut back or eliminate these purchases. For long-term investors with five-year holding periods, this creates a structural challenge: the sector is inherently hit-driven, with low switching costs and fickle customers. As a result, only a handful of companies can reliably grow demand and compound earnings over long periods, which is why our bar is high and High Quality ratings are rare.
Apparel and accessories companies design, brand, and distribute clothing, handbags, jewelry, and related lifestyle products, often spanning multiple price tiers. Tailwinds include premiumization trends (consumers trading up for perceived quality), international expansion into emerging markets, and growing digital commerce penetration. However, these businesses face headwinds from highly cyclical demand, intense promotional environments, and counterfeit competition undermining brand equity. Tariff volatility and sourcing concentration in a handful of countries add risk. Additionally, rapidly changing fashion cycles and the rise of ultra-fast-fashion digital competitors compress product life cycles and make demand forecasting exceptionally difficult.
Stitch Fix’s competitors are Trunk Club (owned by Nordstrom, NYSE:JWN), Amazon Prime Wardrobe (NASDAQ:AMZN), and private companies Wantable and Le Tote.
5. Revenue Growth
A company’s long-term performance is an indicator of its overall quality. Any business can experience short-term success, but top-performing ones enjoy sustained growth for years. Over the last five years, Stitch Fix’s demand was weak and its revenue declined by 6.1% per year. This wasn’t a great result and suggests it’s a low quality business.
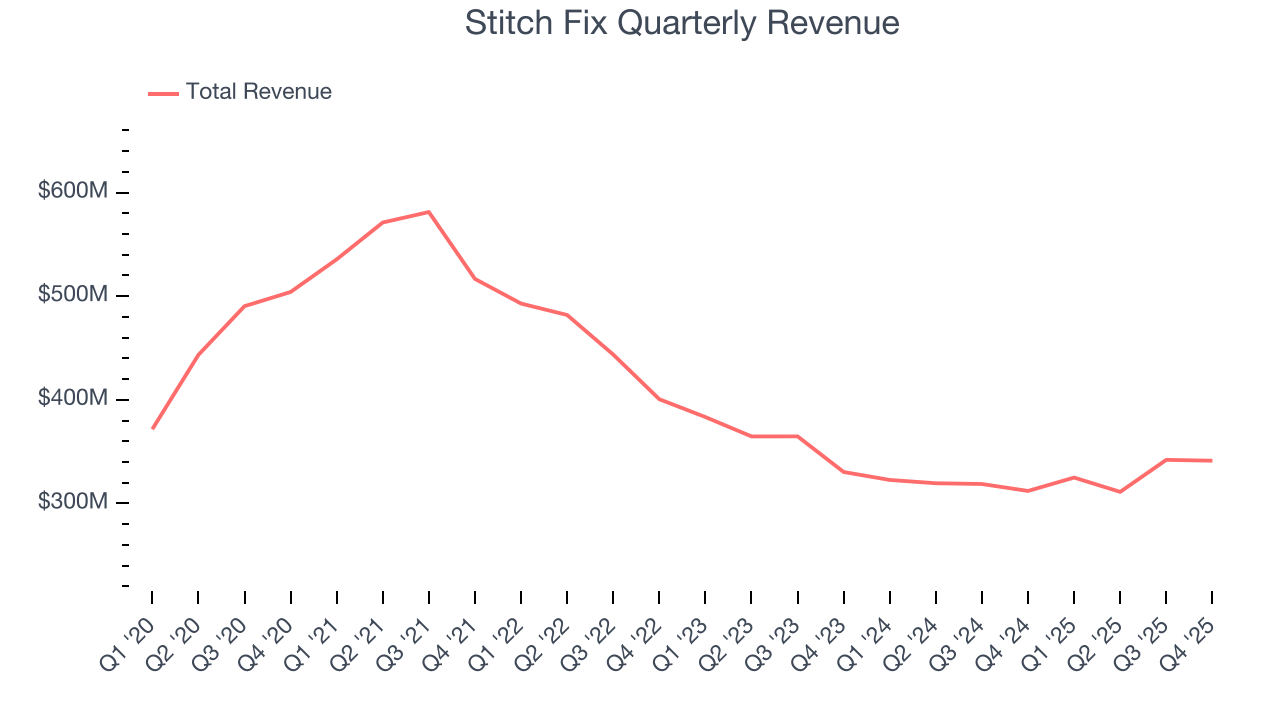
We at StockStory place the most emphasis on long-term growth, but within consumer discretionary, a stretched historical view may miss a company riding a successful new product or trend. Stitch Fix’s annualized revenue declines of 4.4% over the last two years suggest its demand continued shrinking. 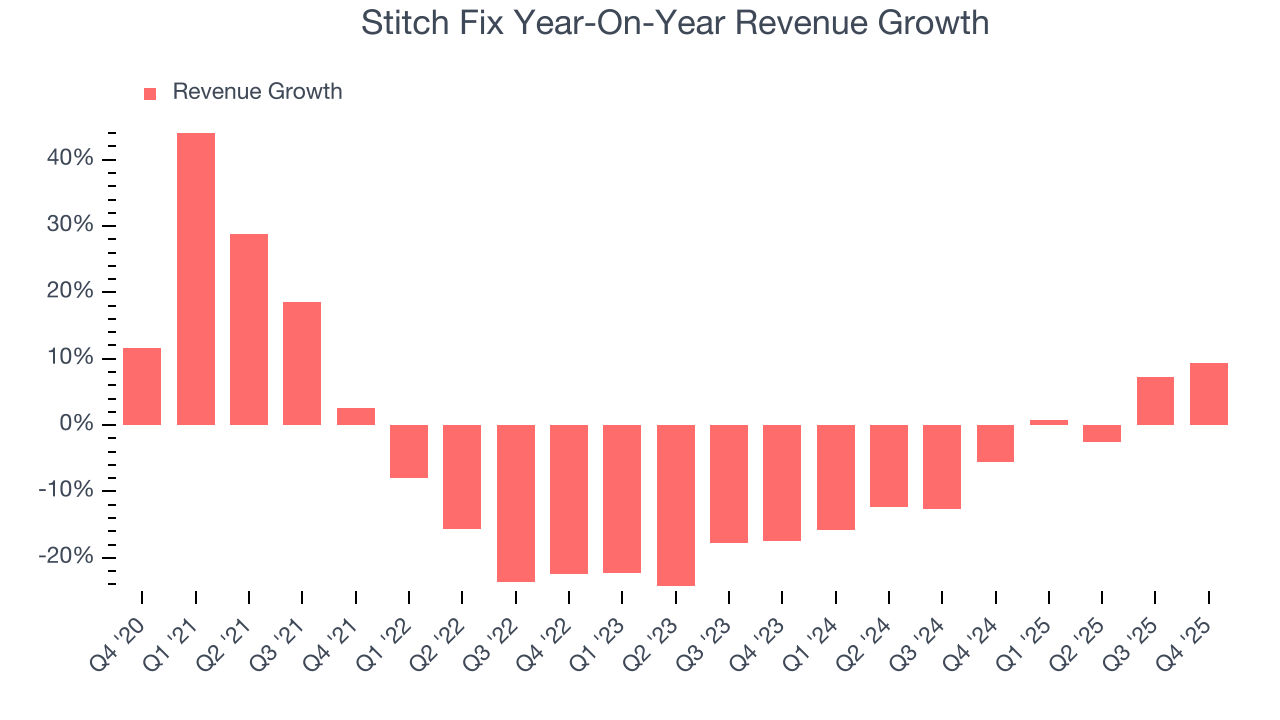
Stitch Fix also discloses its number of active clients, which reached 2.29 million in the latest quarter. Over the last two years, Stitch Fix’s active clients averaged 10.2% year-on-year declines. Because this number is lower than its revenue growth during the same period, we can see the company’s monetization has risen. 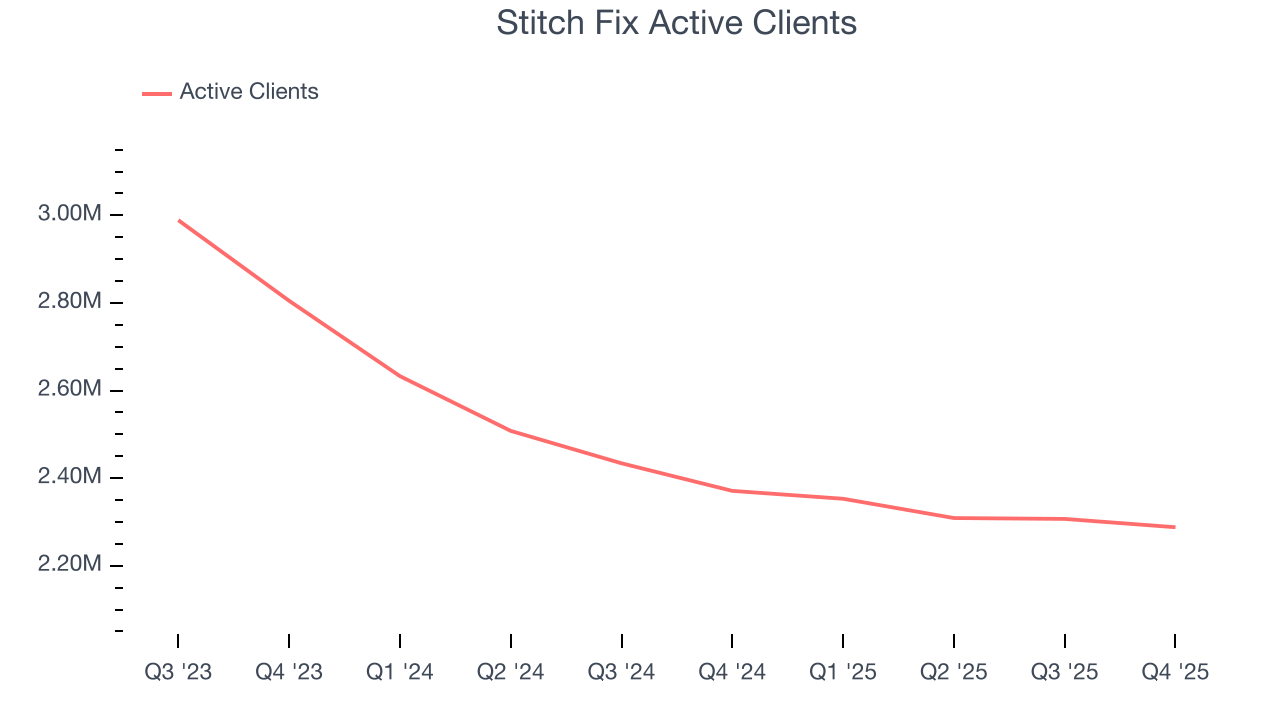
This quarter, Stitch Fix reported year-on-year revenue growth of 9.4%, and its $341.3 million of revenue exceeded Wall Street’s estimates by 1.7%. Company management is currently guiding for a 2.3% year-on-year increase in sales next quarter.
Looking further ahead, sell-side analysts expect revenue to grow 2.8% over the next 12 months. While this projection suggests its newer products and services will fuel better top-line performance, it is still below the sector average.
6. Operating Margin
Stitch Fix’s operating margin has risen over the last 12 months, but it still averaged negative 4.6% over the last two years. This is due to its large expense base and inefficient cost structure.
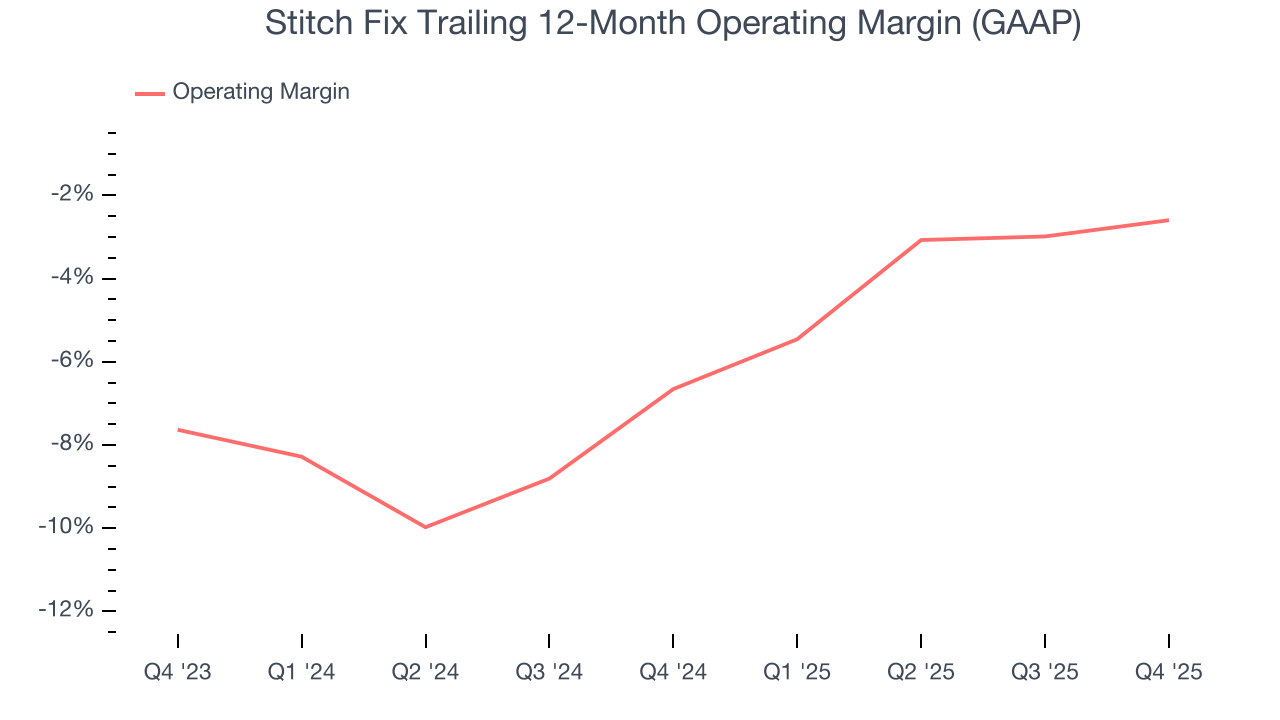
Stitch Fix’s operating margin was negative 1.4% this quarter. The company's consistent lack of profits raise a flag.
7. Earnings Per Share
We track the long-term change in earnings per share (EPS) for the same reason as long-term revenue growth. Compared to revenue, however, EPS highlights whether a company’s growth is profitable.
Although Stitch Fix’s full-year earnings are still negative, it reduced its losses and improved its EPS by 26.3% annually over the last five years. The next few quarters will be critical for assessing its long-term profitability.
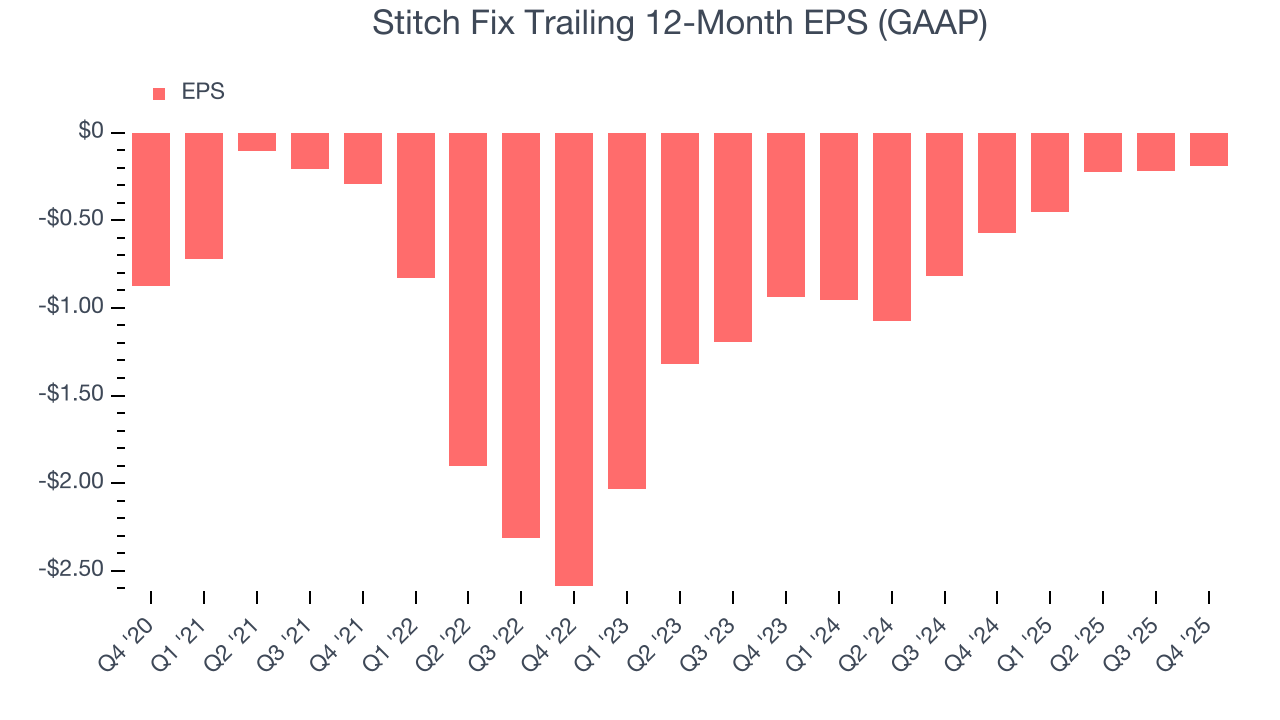
In Q4, Stitch Fix reported EPS of negative $0.02, up from negative $0.05 in the same quarter last year. This print easily cleared analysts’ estimates, and shareholders should be content with the results. Over the next 12 months, Wall Street expects Stitch Fix to improve its earnings losses. Analysts forecast its full-year EPS of negative $0.19 will advance to negative $0.14.
8. Cash Is King
Free cash flow isn't a prominently featured metric in company financials and earnings releases, but we think it's telling because it accounts for all operating and capital expenses, making it tough to manipulate. Cash is king.
Stitch Fix has shown poor cash profitability relative to peers over the last two years, giving the company fewer opportunities to return capital to shareholders. Its free cash flow margin averaged 1.6%, below what we’d expect for a consumer discretionary business.
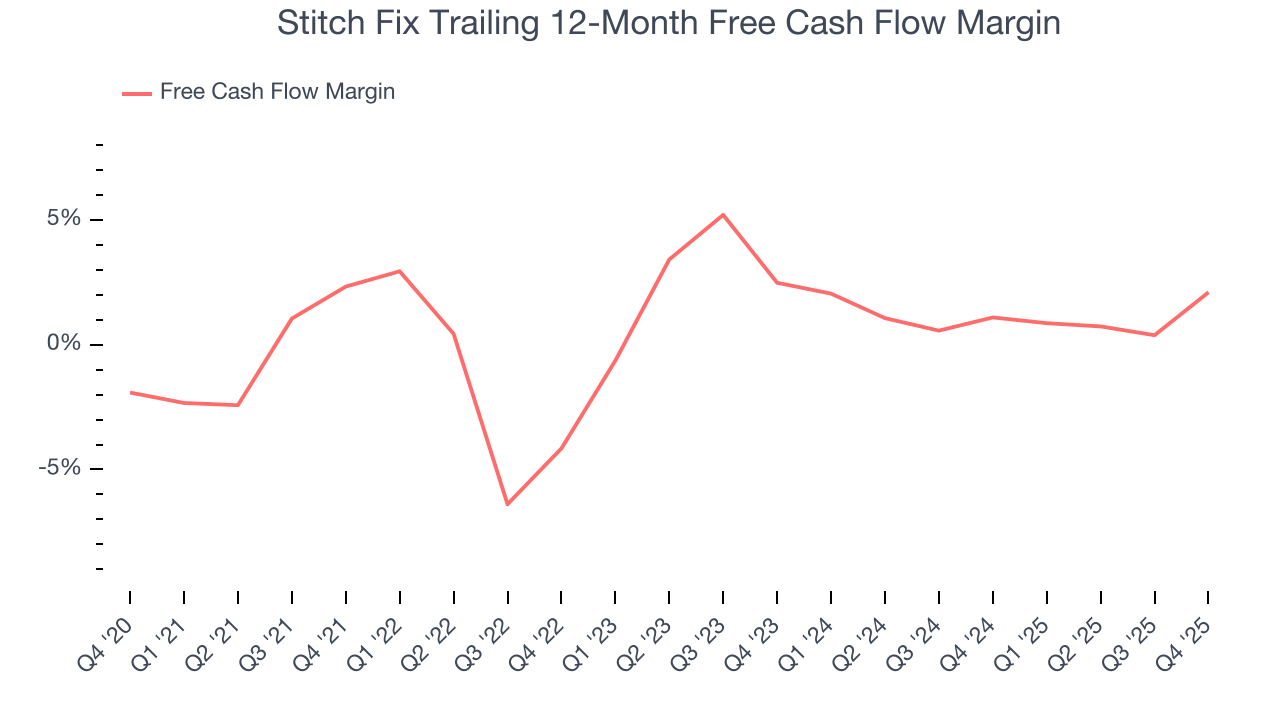
Stitch Fix broke even from a free cash flow perspective in Q4. This result was good as its margin was 7.2 percentage points higher than in the same quarter last year, but we wouldn’t read too much into the short term because investment needs can be seasonal, causing temporary swings. Long-term trends trump fluctuations.
9. Balance Sheet Assessment
Companies with more cash than debt have lower bankruptcy risk.
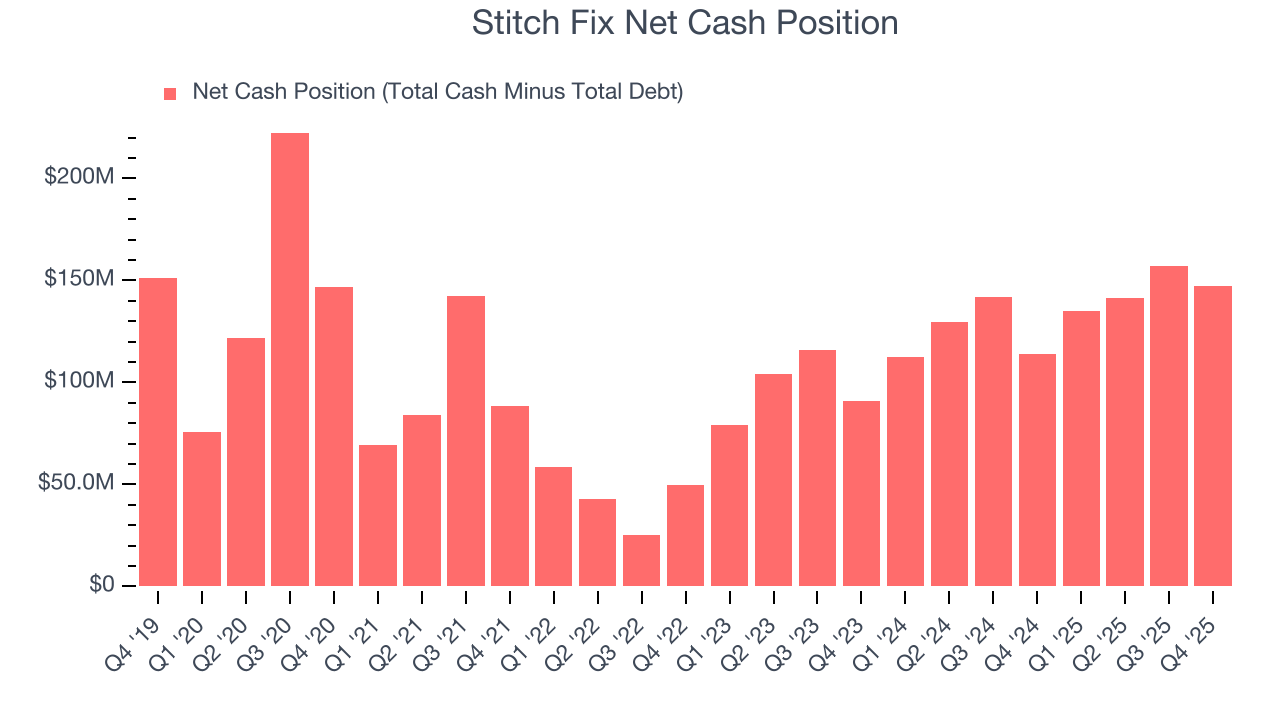
Stitch Fix is a well-capitalized company with $227.7 million of cash and $80.6 million of debt on its balance sheet. This $147.1 million net cash position is 31.6% of its market cap and gives it the freedom to borrow money, return capital to shareholders, or invest in growth initiatives. Leverage is not an issue here.
10. Key Takeaways from Stitch Fix’s Q4 Results
It was good to see Stitch Fix beat analysts’ EPS expectations this quarter. We were also excited its EBITDA outperformed Wall Street’s estimates by a wide margin. On the other hand, its EBITDA guidance for next quarter missed. Overall, we think this was a decent quarter with some key metrics above expectations. The stock traded up 1% to $3.42 immediately after reporting.
11. Is Now The Time To Buy Stitch Fix?
Updated: March 14, 2026 at 10:26 PM EDT
Before making an investment decision, investors should account for Stitch Fix’s business fundamentals and valuation in addition to what happened in the latest quarter.
We see the value of companies helping consumers, but in the case of Stitch Fix, we’re out. On top of that, Stitch Fix’s number of active clients has disappointed, and its projected EPS for the next year is lacking.
Stitch Fix’s forward price-to-sales ratio is 0.3x. The market typically values companies like Stitch Fix based on their anticipated profits for the next 12 months, but it expects the business to lose money. We also think the upside isn’t great compared to the potential downside here - there are more exciting stocks to buy.
Wall Street analysts have a consensus one-year price target of $4.50 on the company (compared to the current share price of $3.29).
Although the price target is bullish, readers should exercise caution because analysts tend to be overly optimistic. The firms they work for, often big banks, have relationships with companies that extend into fundraising, M&A advisory, and other rewarding business lines. As a result, they typically hesitate to say bad things for fear they will lose out. We at StockStory do not suffer from such conflicts of interest, so we’ll always tell it like it is.