Grocery Outlet (GO)
Grocery Outlet faces an uphill battle. Its sales have underperformed and its low returns on capital show it has few growth opportunities.― StockStory Analyst Team
1. News


2. Summary
Why We Think Grocery Outlet Will Underperform
Due to its differentiated procurement and buying approach, Grocery Outlet (NASDAQ:GO) is a discount grocery store chain that offers substantial discounts on name-brand products.
- Historical operating margin losses point to an inefficient cost structure
- Underwhelming 0.3% return on capital reflects management’s difficulties in finding profitable growth opportunities, and its falling returns suggest its earlier profit pools are drying up
- High net-debt-to-EBITDA ratio of 7× could force the company to raise capital at unfavorable terms if market conditions deteriorate


Grocery Outlet’s quality isn’t up to par. We’ve identified better opportunities elsewhere.
Why There Are Better Opportunities Than Grocery Outlet


Grocery Outlet is trading at $6.56 per share, or 12.9x forward P/E. The current valuation may be fair, but we’re still passing on this stock due to better alternatives out there.
We’d rather invest in similarly-priced but higher-quality companies with more reliable earnings growth.
3. Grocery Outlet (GO) Research Report: Q4 CY2025 Update
Discount grocery store chain Grocery Outlet (NASDAQ:GO) fell short of the market’s revenue expectations in Q4 CY2025, but sales rose 10.7% year on year to $1.22 billion. The company’s full-year revenue guidance of $4.66 billion at the midpoint came in 5.4% below analysts’ estimates. Its non-GAAP profit of $0.19 per share was 8.9% below analysts’ consensus estimates.
Grocery Outlet (GO) Q4 CY2025 Highlights:
- Revenue: $1.22 billion vs analyst estimates of $1.22 billion (10.7% year-on-year growth, 0.6% miss)
- Adjusted EPS: $0.19 vs analyst expectations of $0.21 (8.9% miss)
- Adjusted EBITDA: $67.99 million vs analyst estimates of $72.05 million (5.6% margin, 5.6% miss)
- Adjusted EPS guidance for the upcoming financial year 2026 is $0.50 at the midpoint, missing analyst estimates by 38.6%
- EBITDA guidance for the upcoming financial year 2026 is $227.5 million at the midpoint, below analyst estimates of $274 million
- Operating Margin: -19.3%, down from 1% in the same quarter last year
- Free Cash Flow was $32.47 million, up from -$19.61 million in the same quarter last year
- Locations: 570 at quarter end, up from 533 in the same quarter last year
- Same-Store Sales were flat year on year (2.9% in the same quarter last year)
- Market Capitalization: $870.5 million
Company Overview
Due to its differentiated procurement and buying approach, Grocery Outlet (NASDAQ:GO) is a discount grocery store chain that offers substantial discounts on name-brand products.
Specifically, the company purchases closeout merchandise, excess inventory, and discontinued items from manufacturers and other retailers. The result is prices up to 60% less than regular supermarkets. The positive of this approach is low prices whereas the negative is less reliable selection. The core Grocery Outlet customer is a shopper who therefore values the savings and doesn’t mind some inventory inconsistency.
The size of the average Grocery Outlet store is around 18,000 square feet, which is much smaller than the traditional supermarket. The stores are typically located in strip malls or standalone buildings in suburban areas. Overall, the layout of a Grocery Outlet store is similar to a traditional supermarket, just smaller. Fresh produce is towards the front, meat and dairy is towards the back, and the center aisles of packaged goods fill the middle.
A unique feature of Grocery Outlet's layout is the "treasure hunt" section, located towards the front of the store. This section features unique and unusual products at even deeper discounts than the rest of the store. The selection in this section changes regularly, so customers may find potato chips one week and canned soup the next.
4. Grocery Store
Grocery stores are non-discretionary because they sell food, an essential staple for life (maybe not that ice cream?). Selling food, however, is a notoriously tough business as grocers must deal with the costs of procuring and transporting oftentimes perishable products. Plus, the costs of operating stores to sell everything from raw meat to ice cream and fresh fruit are high. Competition is also fierce because grocers and other peers such as wholesale clubs tend to sell very similar brands and products. On the bright side, grocery is one of the least penetrated categories in e-commerce because customers prefer to buy their food in person. Still, the online threat exists and will likely increase over time rather than dwindle.
Grocery competitors with offering brand-name products at competitive prices include Walmart (NYSE:WMT), Dollar General (NYSE:DG), and Kroger (NYSE:KR)
5. Revenue Growth
A company’s long-term performance is an indicator of its overall quality. Any business can put up a good quarter or two, but many enduring ones grow for years.
With $4.69 billion in revenue over the past 12 months, Grocery Outlet is a small retailer, which sometimes brings disadvantages compared to larger competitors benefiting from economies of scale and negotiating leverage with suppliers.
As you can see below, Grocery Outlet grew its sales at a mediocre 9.4% compounded annual growth rate over the last three years as it barely increased sales at existing, established locations.
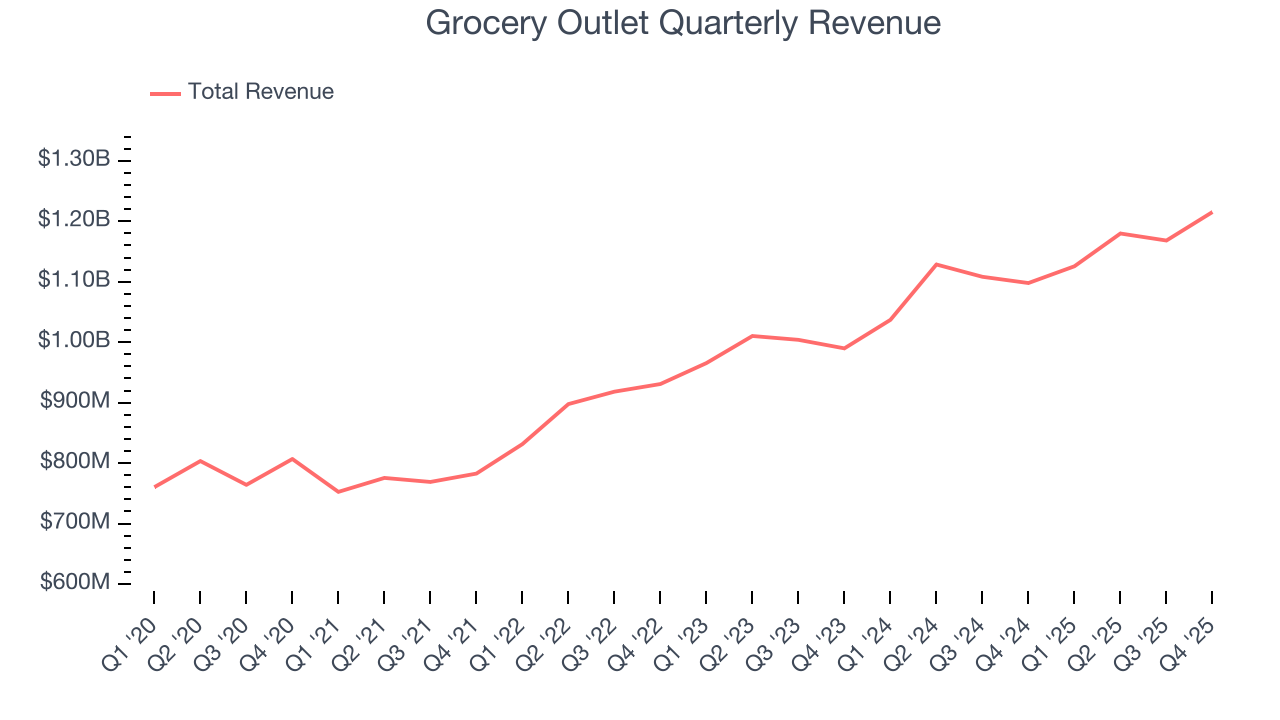
This quarter, Grocery Outlet’s revenue grew by 10.7% year on year to $1.22 billion but fell short of Wall Street’s estimates.
Looking ahead, sell-side analysts expect revenue to grow 5.3% over the next 12 months, a deceleration versus the last three years. Still, this projection is noteworthy and implies the market is baking in success for its products.
6. Store Performance
Number of Stores
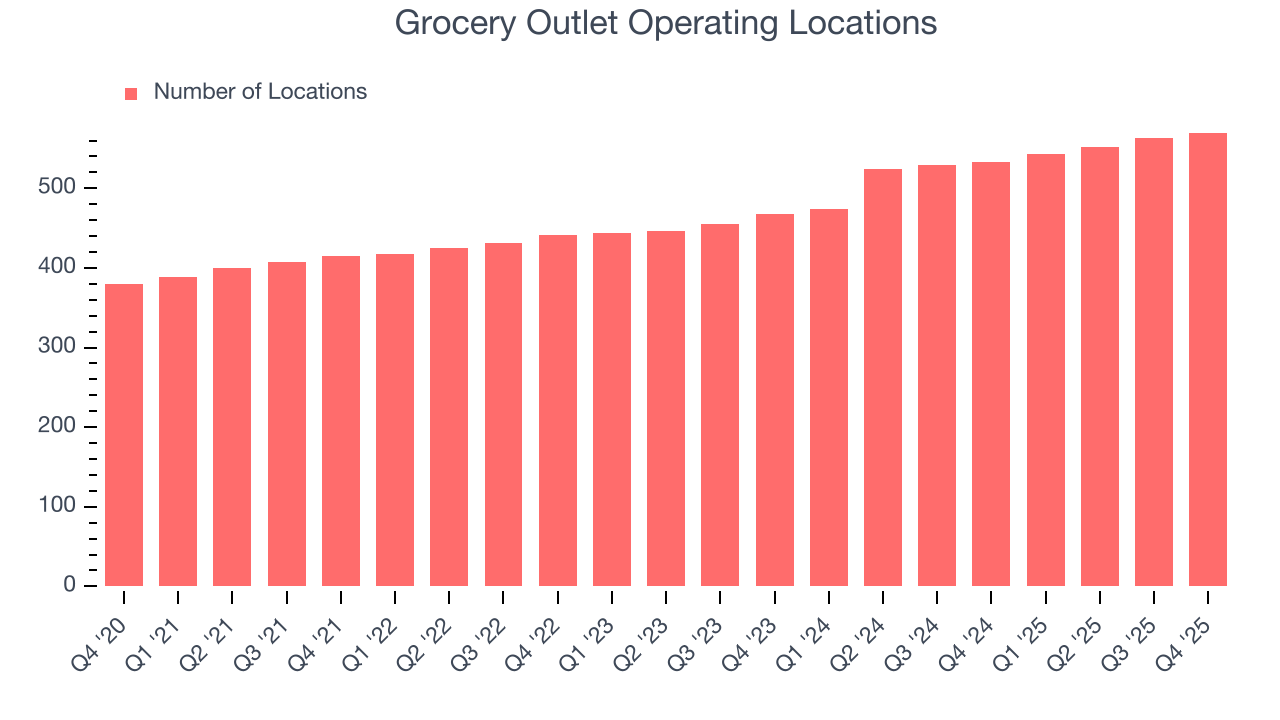
A retailer’s store count influences how much it can sell and how quickly revenue can grow.
Grocery Outlet sported 570 locations in the latest quarter. Over the last two years, it has opened new stores at a rapid clip by averaging 10.9% annual growth, among the fastest in the consumer retail sector. This gives it a chance to scale into a mid-sized business over time.
When a retailer opens new stores, it usually means it’s investing for growth because demand is greater than supply, especially in areas where consumers may not have a store within reasonable driving distance.
Same-Store Sales
The change in a company's store base only tells one side of the story. The other is the performance of its existing locations and e-commerce sales, which informs management teams whether they should expand or downsize their physical footprints. Same-store sales gives us insight into this topic because it measures organic growth for a retailer's e-commerce platform and brick-and-mortar shops that have existed for at least a year.
Grocery Outlet’s demand within its existing locations has been relatively stable over the last two years but was below most retailers. On average, the company’s same-store sales have grown by 1.6% per year. This performance suggests it should consider improving its foot traffic and efficiency before expanding its store base.
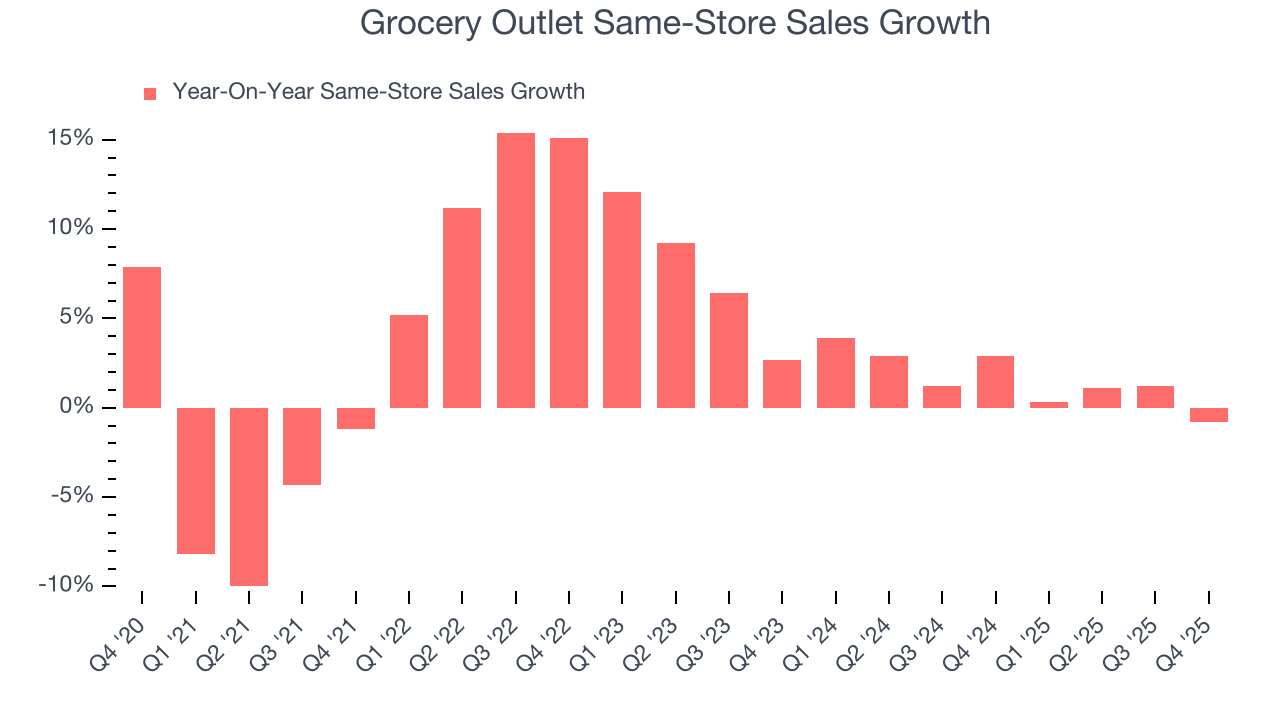
In the latest quarter, Grocery Outlet’s year on year same-store sales were flat. This was a meaningful deceleration from its historical levels. We’ll be watching closely to see if Grocery Outlet can reaccelerate growth.
7. Gross Margin & Pricing Power
Grocery Outlet has bad unit economics for a retailer, signaling it operates in a competitive market and lacks pricing power because its inventory is sold in many places. As you can see below, it averaged a 30.3% gross margin over the last two years.
When compared to other non-discretionary retailers, however, it’s actually pretty solid. That’s because non-discretionary retailers have structurally lower gross margins; they compete on the lowest price, sell products easily found elsewhere, and have high transportation costs to move goods. We believe the best metrics to assess these companies are free cash flow margin, operating leverage, and profit volatility, which account for their scale advantages and non-cyclical demand.
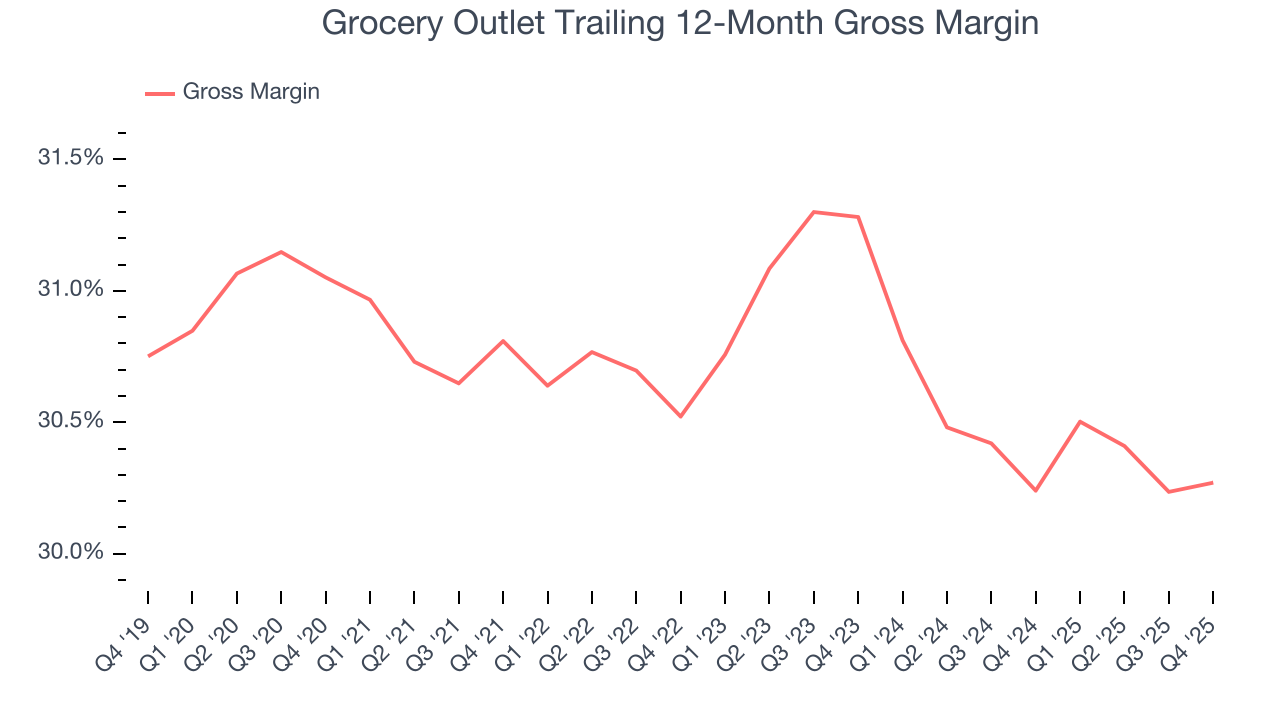
Grocery Outlet produced a 29.7% gross profit margin in Q4, in line with the same quarter last year. On a wider time horizon, the company’s full-year margin has remained steady over the past four quarters, suggesting it strives to keep prices low for customers and has stable input costs (such as labor and freight expenses to transport goods).
8. Operating Margin
Despite the consumer retail industry’s secular decline, unprofitable public companies are few and far between. Unfortunately, Grocery Outlet was one of them over the last two years as its high expenses contributed to an average operating margin of negative 1.6%.
Analyzing the trend in its profitability, Grocery Outlet’s operating margin decreased by 6.5 percentage points over the last year. This raises questions about the company’s expense base because its revenue growth should have given it leverage on its fixed costs, resulting in better economies of scale and profitability. Grocery Outlet’s performance was poor no matter how you look at it - it shows that costs were rising and it couldn’t pass them onto its customers.
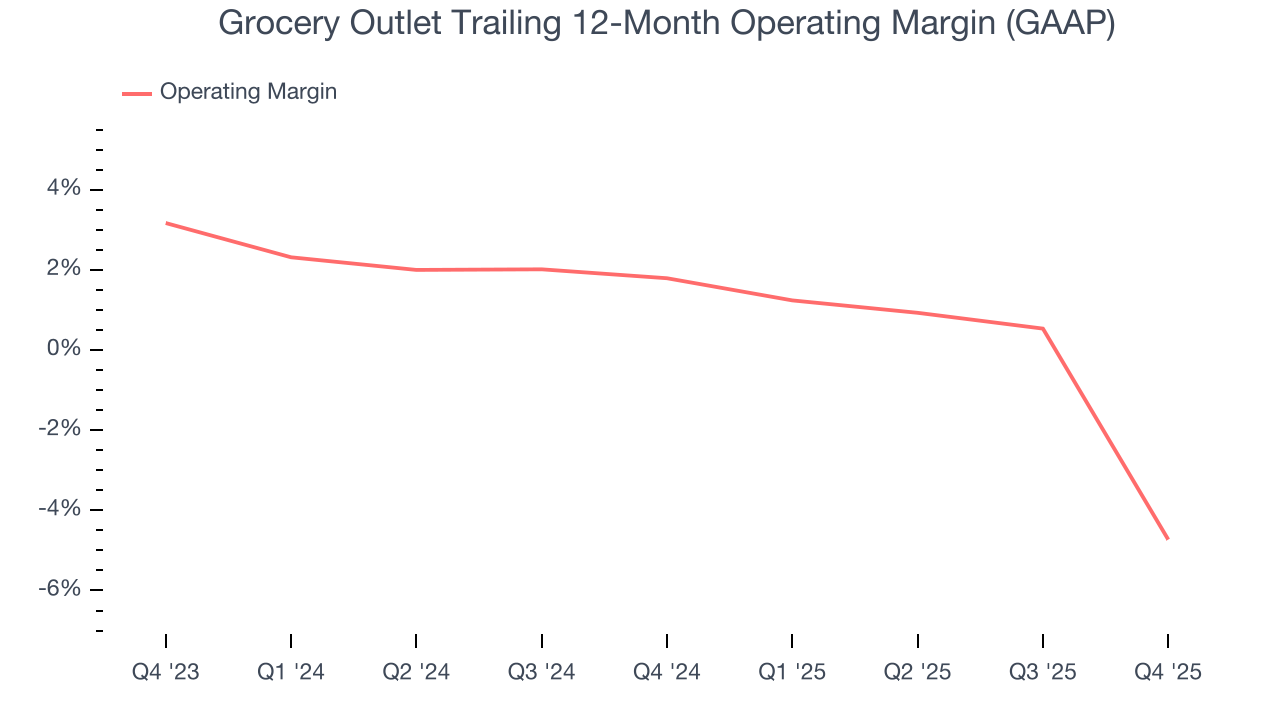
This quarter, Grocery Outlet generated a negative 19.3% operating margin. The company's consistent lack of profits raise a flag.
9. Earnings Per Share
We track the long-term change in earnings per share (EPS) for the same reason as long-term revenue growth. Compared to revenue, however, EPS highlights whether a company’s growth is profitable.
Sadly for Grocery Outlet, its EPS declined by 9.6% annually over the last three years while its revenue grew by 9.4%. This tells us the company became less profitable on a per-share basis as it expanded due to non-fundamental factors such as interest expenses and taxes.
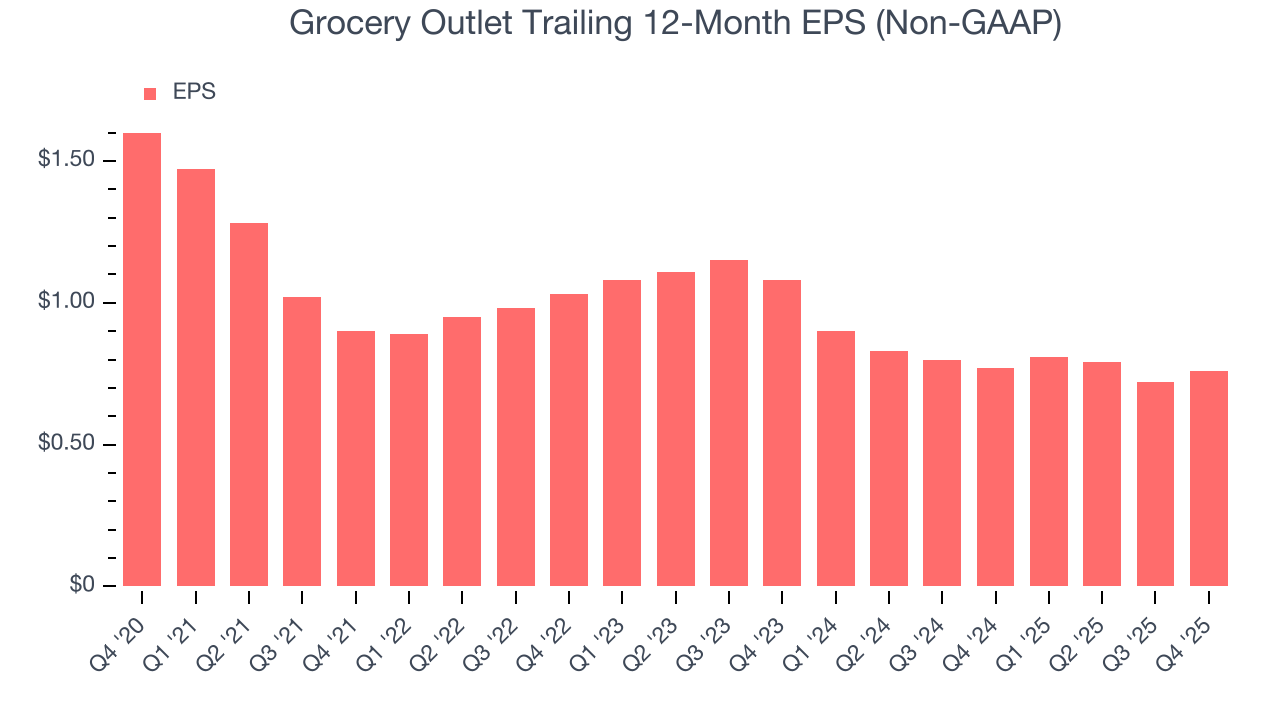
In Q4, Grocery Outlet reported adjusted EPS of $0.19, up from $0.15 in the same quarter last year. Despite growing year on year, this print missed analysts’ estimates. Over the next 12 months, Wall Street expects Grocery Outlet’s full-year EPS of $0.76 to grow 7.4%.
10. Cash Is King
Free cash flow isn't a prominently featured metric in company financials and earnings releases, but we think it's telling because it accounts for all operating and capital expenses, making it tough to manipulate. Cash is king.
Grocery Outlet broke even from a free cash flow perspective over the last two years, giving the company limited opportunities to return capital to shareholders.
Taking a step back, an encouraging sign is that Grocery Outlet’s margin expanded by 2.2 percentage points over the last year. The company’s improvement shows it’s heading in the right direction, and we can see it became a less capital-intensive business because its free cash flow profitability rose while its operating profitability fell.
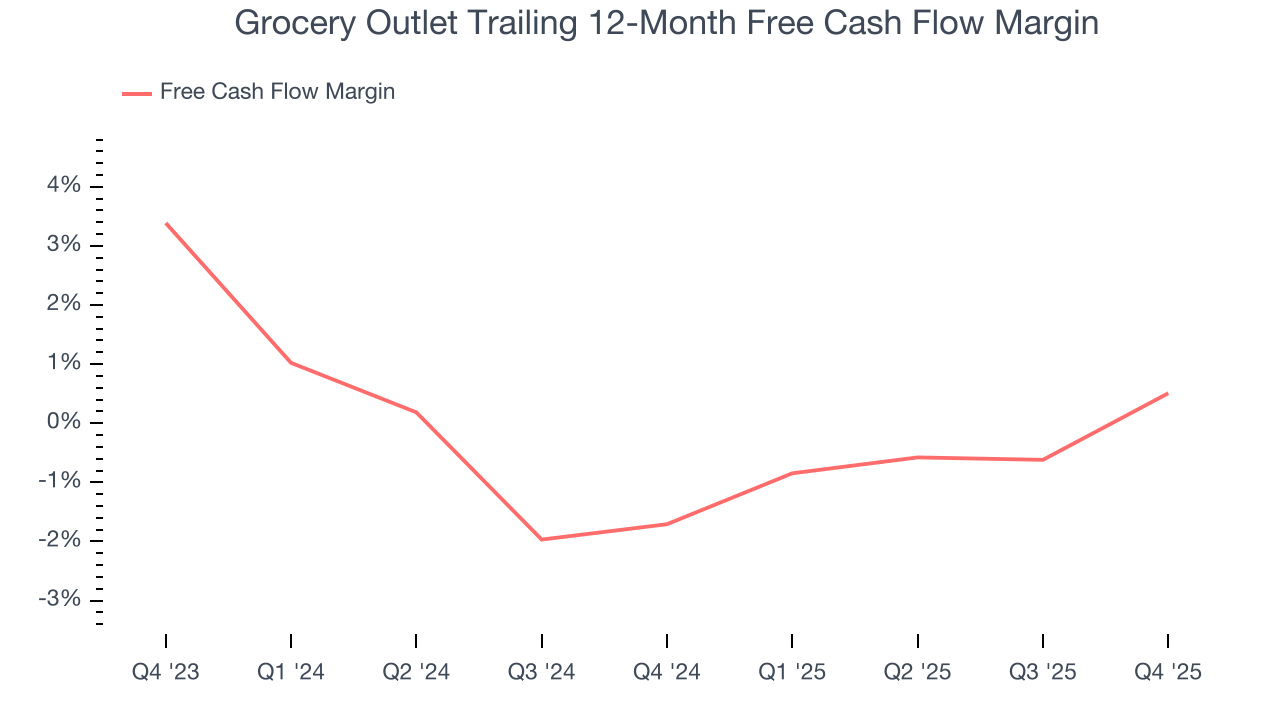
Grocery Outlet’s free cash flow clocked in at $32.47 million in Q4, equivalent to a 2.7% margin. Its cash flow turned positive after being negative in the same quarter last year, building on its favorable historical trend.
11. Return on Invested Capital (ROIC)
EPS and free cash flow tell us whether a company was profitable while growing its revenue. But was it capital-efficient? Enter ROIC, a metric showing how much operating profit a company generates relative to the money it has raised (debt and equity).
Grocery Outlet historically did a mediocre job investing in profitable growth initiatives. Its five-year average ROIC was 0.5%, lower than the typical cost of capital (how much it costs to raise money) for consumer retail companies.
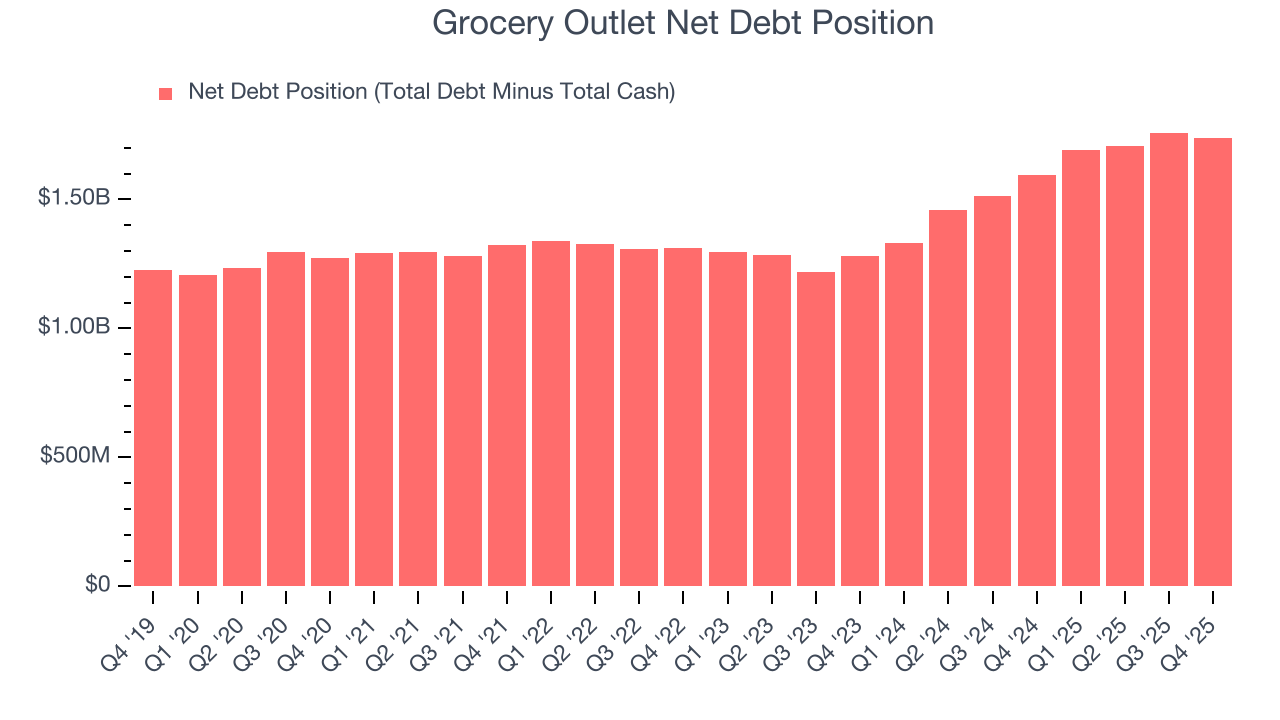
12. Balance Sheet Risk
As long-term investors, the risk we care about most is the permanent loss of capital, which can happen when a company goes bankrupt or raises money from a disadvantaged position. This is separate from short-term stock price volatility, something we are much less bothered by.
Grocery Outlet’s $1.81 billion of debt exceeds the $69.6 million of cash on its balance sheet. Furthermore, its 7× net-debt-to-EBITDA ratio (based on its EBITDA of $254.3 million over the last 12 months) shows the company is overleveraged.
At this level of debt, incremental borrowing becomes increasingly expensive and credit agencies could downgrade the company’s rating if profitability falls. Grocery Outlet could also be backed into a corner if the market turns unexpectedly – a situation we seek to avoid as investors in high-quality companies.
We hope Grocery Outlet can improve its balance sheet and remain cautious until it increases its profitability or pays down its debt.
13. Key Takeaways from Grocery Outlet’s Q4 Results
We struggled to find many positives in these results. Its full-year revenue guidance missed and its full-year EBITDA guidance fell short of Wall Street’s estimates. Overall, this quarter could have been better. The stock traded down 20.5% to $7.01 immediately following the results.
14. Is Now The Time To Buy Grocery Outlet?
Updated: March 24, 2026 at 10:39 PM EDT
When considering an investment in Grocery Outlet, investors should account for its valuation and business qualities as well as what’s happened in the latest quarter.
Grocery Outlet falls short of our quality standards. First off, its revenue growth was mediocre over the last three years, and analysts expect its demand to deteriorate over the next 12 months. While its new store openings have increased its brand equity, the downside is its relatively low ROIC suggests management has struggled to find compelling investment opportunities. On top of that, its operating margins reveal poor profitability compared to other retailers.
Grocery Outlet’s P/E ratio based on the next 12 months is 12.9x. While this valuation is fair, the upside isn’t great compared to the potential downside. There are superior stocks to buy right now.
Wall Street analysts have a consensus one-year price target of $7.62 on the company (compared to the current share price of $6.56).
Although the price target is bullish, readers should exercise caution because analysts tend to be overly optimistic. The firms they work for, often big banks, have relationships with companies that extend into fundraising, M&A advisory, and other rewarding business lines. As a result, they typically hesitate to say bad things for fear they will lose out. We at StockStory do not suffer from such conflicts of interest, so we’ll always tell it like it is.