
LKQ (LKQ)
LKQ faces an uphill battle. Its sales have underperformed and its low returns on capital show it has few growth opportunities.― StockStory Analyst Team
1. News


2. Summary
Why We Think LKQ Will Underperform
A global distributor of vehicle parts and accessories, LKQ (NASDAQ:LKQ) offers its customers a comprehensive selection of high-quality, affordably priced automobile products.
- Scale is a double-edged sword because it limits the company’s growth potential compared to its smaller competitors, as reflected in its below-average annual revenue increases of 3.5% for the last five years
- Earnings growth over the last five years fell short of the peer group average as its EPS only increased by 6.7% annually
- Sales are projected to remain flat over the next 12 months as demand decelerates from its two-year trend


LKQ doesn’t measure up to our expectations. We believe there are better businesses elsewhere.
Why There Are Better Opportunities Than LKQ


LKQ is trading at $33.99 per share, or 10.8x forward P/E. Yes, this valuation multiple is lower than that of other consumer discretionary peers, but we’ll remind you that you often get what you pay for.
Cheap stocks can look like great bargains at first glance, but you often get what you pay for. These mediocre businesses often have less earnings power, meaning there is more reliance on a re-rating to generate good returns - an unlikely scenario for low-quality companies.
3. LKQ (LKQ) Research Report: Q3 CY2025 Update
Automotive parts company LKQ (NASDAQ:LKQ) fell short of the markets revenue expectations in Q3 CY2025, with sales falling 2.4% year on year to $3.50 billion. Its non-GAAP profit of $0.84 per share was 11% above analysts’ consensus estimates.
LKQ (LKQ) Q3 CY2025 Highlights:
- Revenue: $3.50 billion vs analyst estimates of $3.53 billion (2.4% year-on-year decline, 0.9% miss)
- Adjusted EPS: $0.84 vs analyst estimates of $0.76 (11% beat)
- Adjusted EBITDA: $381 million vs analyst estimates of $373.5 million (10.9% margin, 2% beat)
- Management lowered its full-year Adjusted EPS guidance to $3.08 at the midpoint, a 2.4% decrease
- EBITDA guidance for the full year is $794 million at the midpoint, below analyst estimates of $1.57 billion
- Operating Margin: 7.8%, in line with the same quarter last year
- Free Cash Flow Margin: 11.1%, up from 9.5% in the same quarter last year
- Organic Revenue fell 1% year on year vs analyst estimates of 2.6% declines (159 basis point beat)
- Market Capitalization: $7.73 billion
Company Overview
A global distributor of vehicle parts and accessories, LKQ (NASDAQ:LKQ) offers its customers a comprehensive selection of high-quality, affordably priced automobile products.
LKQ's core business sells a wide array of vehicle replacement products, including recycled automotive parts harvested from salvaged vehicles, remanufactured parts that are restored to original specifications, and new parts sourced from OEMs (Original Equipment Manufacturers) and other suppliers.
This diverse product portfolio enables LKQ to serve a broad customer base, ranging from collision and mechanical repair shops to individual vehicle owners. Its various price points (new and used) also allow it to cater to customers looking for high-quality replacement parts as well as those looking for more affordable options.
With numerous warehouses and distribution centers strategically located across its operating regions, LKQ ensures timely and efficient delivery of parts to its customers. The company leverages modern logistics and inventory management systems to maintain high levels of customer service and satisfaction.
4. Specialized Consumer Services
Some consumer discretionary companies don’t fall neatly into a category because their products or services are unique. Although their offerings may be niche, these companies have often found more efficient or technology-enabled ways of doing or selling something that has existed for a while. Technology can be a double-edged sword, though, as it may lower the barriers to entry for new competitors and allow them to do serve customers better.
LKQ's primary competitors include Advance Auto Parts (NYSE:AAP), AutoZone (NYSE:AZO), O'Reilly Automotive (NASDAQ:ORLY), and Genuine Parts Company (NYSE:GPC).
5. Revenue Growth
Reviewing a company’s long-term sales performance reveals insights into its quality. Any business can put up a good quarter or two, but the best consistently grow over the long haul. Unfortunately, LKQ’s 3.6% annualized revenue growth over the last five years was sluggish. This fell short of our benchmark for the consumer discretionary sector and is a rough starting point for our analysis.
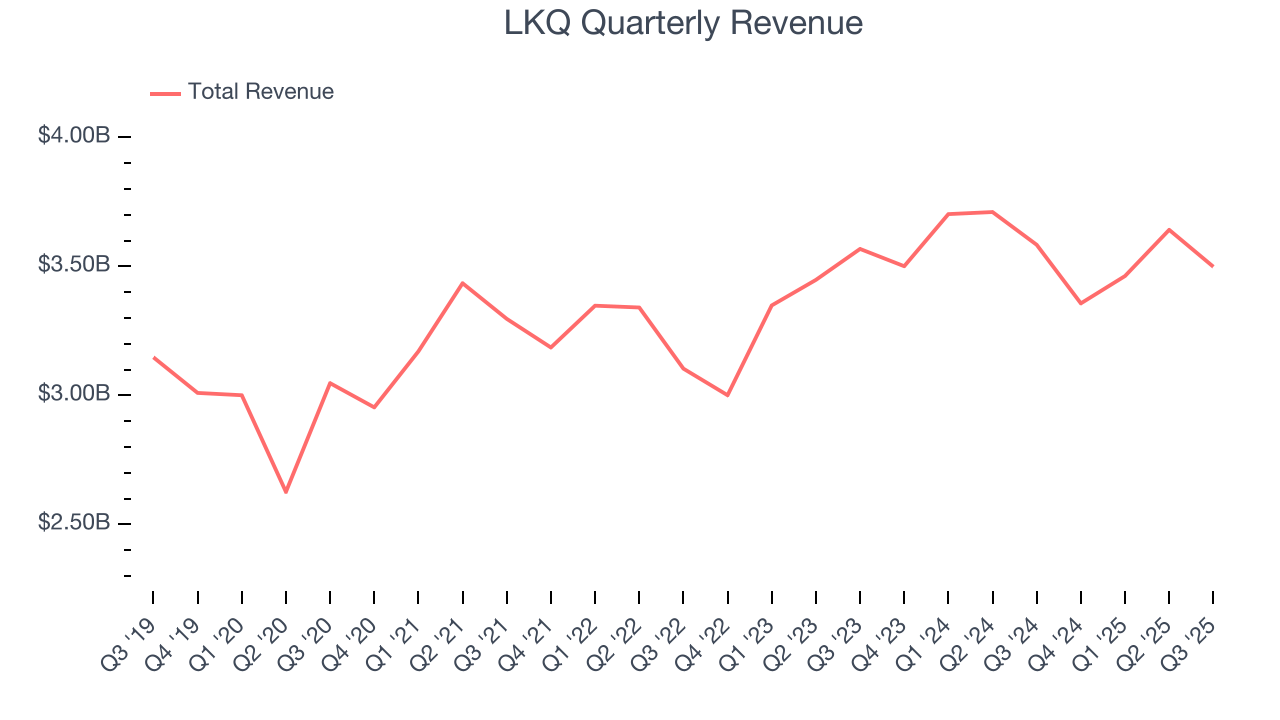
We at StockStory place the most emphasis on long-term growth, but within consumer discretionary, a stretched historical view may miss a company riding a successful new product or trend. LKQ’s recent performance shows its demand has slowed as its annualized revenue growth of 2.2% over the last two years was below its five-year trend. 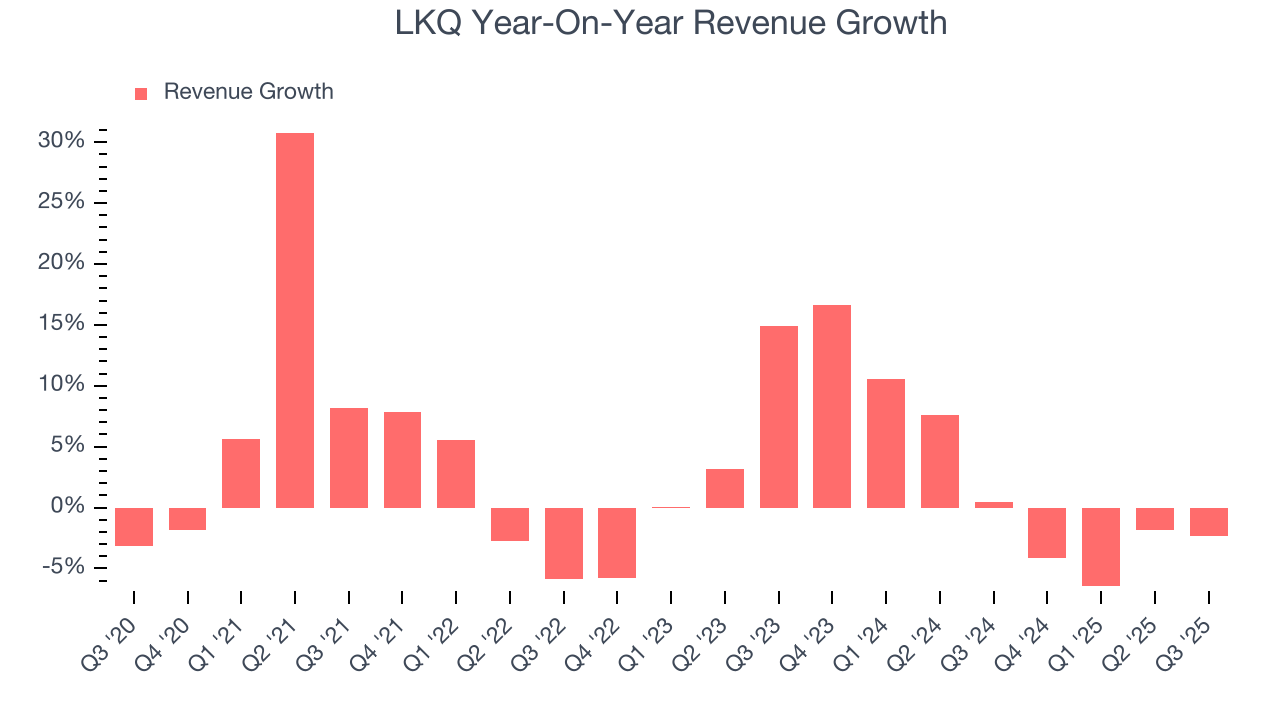
We can dig further into the company’s sales dynamics by analyzing its organic revenue, which strips out one-time events like acquisitions and currency fluctuations that don’t accurately reflect its fundamentals. Over the last two years, LKQ’s organic revenue averaged 2.1% year-on-year declines. Because this number is lower than its two-year revenue growth, we can see that some mixture of acquisitions and foreign exchange rates boosted its headline results. 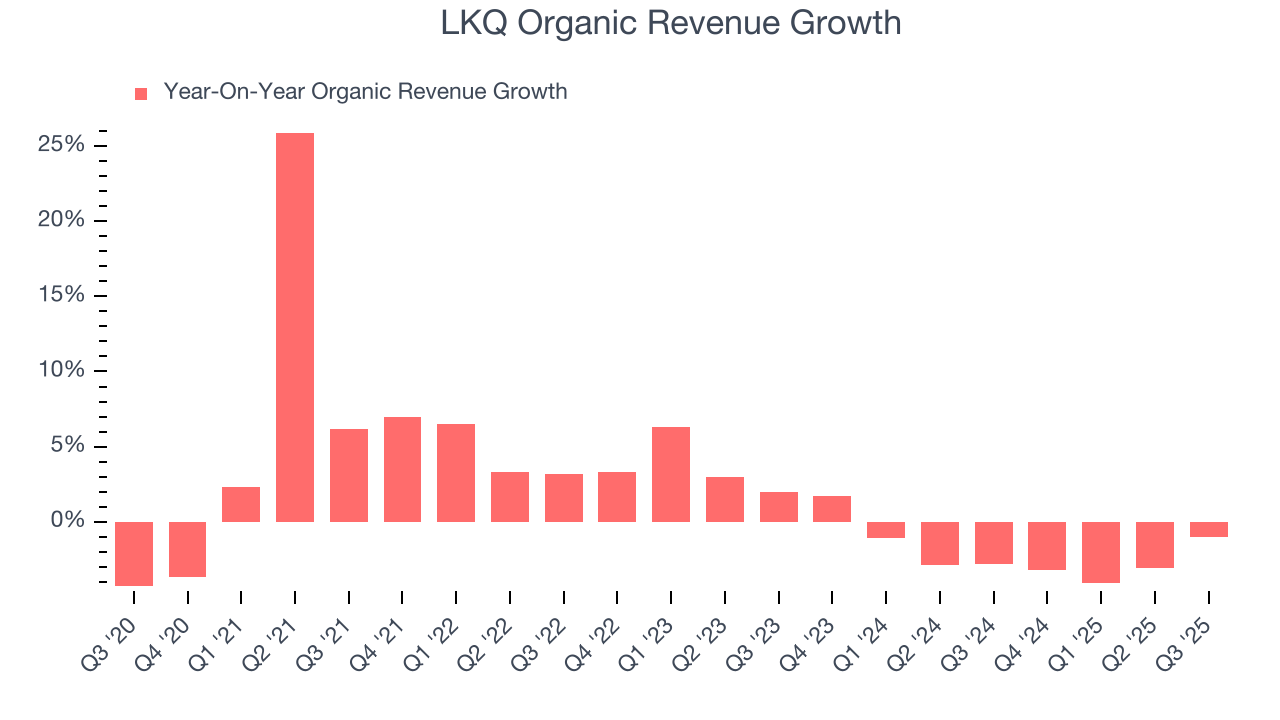
This quarter, LKQ missed Wall Street’s estimates and reported a rather uninspiring 2.4% year-on-year revenue decline, generating $3.50 billion of revenue.
Looking ahead, sell-side analysts expect revenue to grow 2.5% over the next 12 months, similar to its two-year rate. This projection is underwhelming and suggests its newer products and services will not catalyze better top-line performance yet.
6. Operating Margin
Operating margin is a key measure of profitability. Think of it as net income - the bottom line - excluding the impact of taxes and interest on debt, which are less connected to business fundamentals.
LKQ’s operating margin might fluctuated slightly over the last 12 months but has remained more or less the same, averaging 8.3% over the last two years. This profitability was mediocre for a consumer discretionary business and caused by its suboptimal cost structure.
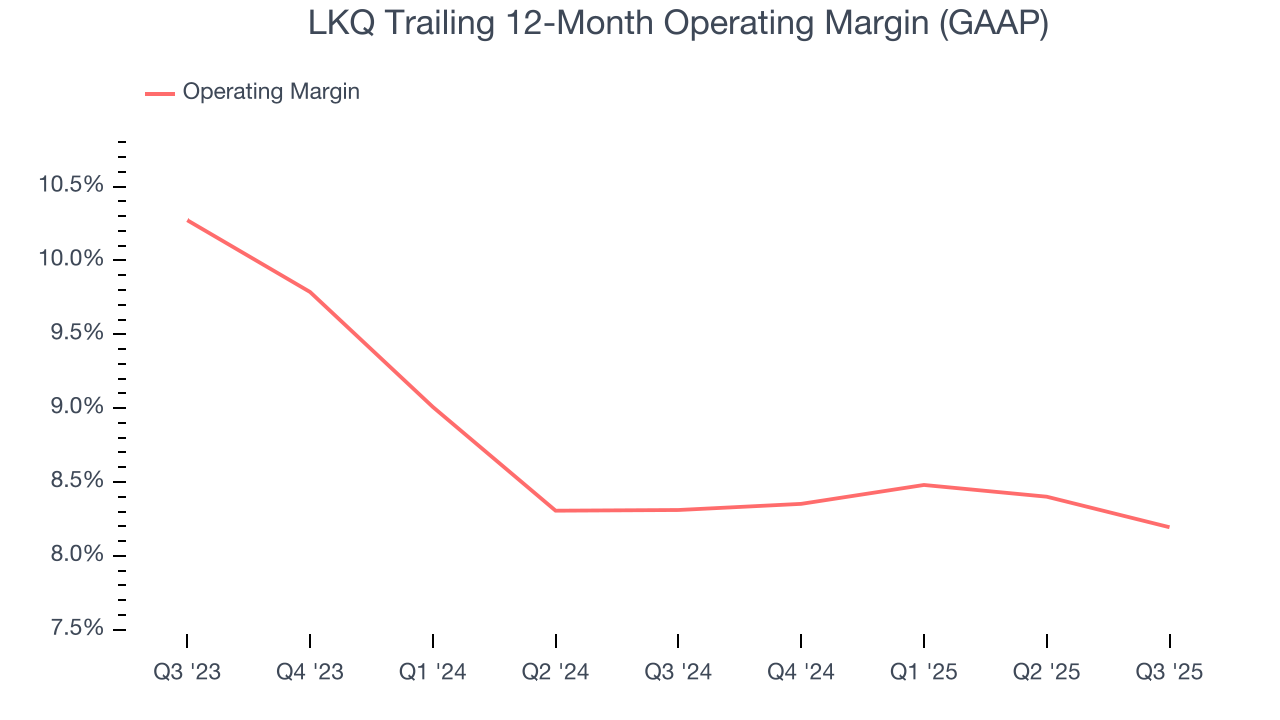
In Q3, LKQ generated an operating margin profit margin of 7.8%, in line with the same quarter last year. This indicates the company’s overall cost structure has been relatively stable.
7. Earnings Per Share
We track the long-term change in earnings per share (EPS) for the same reason as long-term revenue growth. Compared to revenue, however, EPS highlights whether a company’s growth is profitable.
LKQ’s EPS grew at an unimpressive 6.7% compounded annual growth rate over the last five years. This performance was better than its flat revenue but doesn’t tell us much about its business quality because its operating margin didn’t improve.
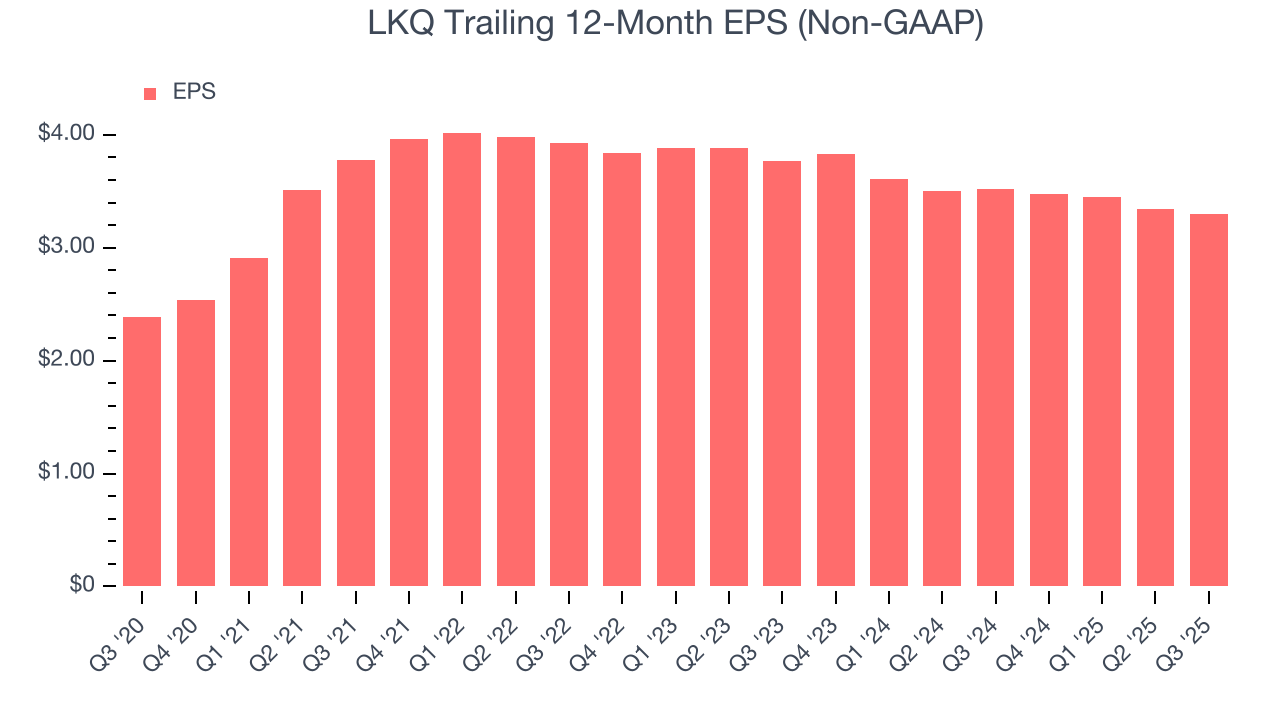
In Q3, LKQ reported adjusted EPS of $0.84, down from $0.88 in the same quarter last year. Despite falling year on year, this print easily cleared analysts’ estimates. Over the next 12 months, Wall Street expects LKQ’s full-year EPS of $3.30 to stay about the same.
8. Cash Is King
Although earnings are undoubtedly valuable for assessing company performance, we believe cash is king because you can’t use accounting profits to pay the bills.
LKQ has shown weak cash profitability over the last two years, giving the company limited opportunities to return capital to shareholders. Its free cash flow margin averaged 5.2%, subpar for a consumer discretionary business.
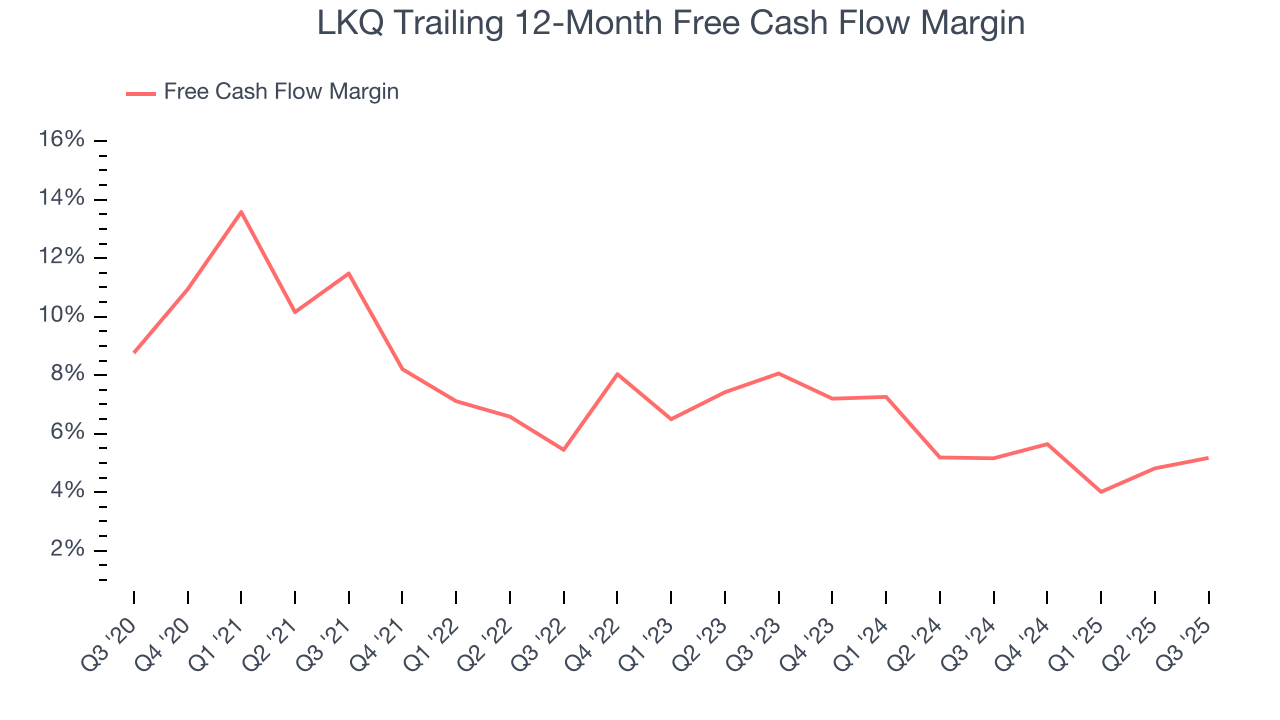
LKQ’s free cash flow clocked in at $387 million in Q3, equivalent to a 11.1% margin. This result was good as its margin was 1.5 percentage points higher than in the same quarter last year, but we wouldn’t read too much into the short term because investment needs can be seasonal, causing temporary swings. Long-term trends are more important.
Over the next year, analysts’ consensus estimates show they’re expecting LKQ’s free cash flow margin of 5.2% for the last 12 months to remain the same.
9. Return on Invested Capital (ROIC)
EPS and free cash flow tell us whether a company was profitable while growing its revenue. But was it capital-efficient? A company’s ROIC explains this by showing how much operating profit it makes compared to the money it has raised (debt and equity).
LKQ historically did a mediocre job investing in profitable growth initiatives. Its five-year average ROIC was 10.7%, somewhat low compared to the best consumer discretionary companies that consistently pump out 25%+.
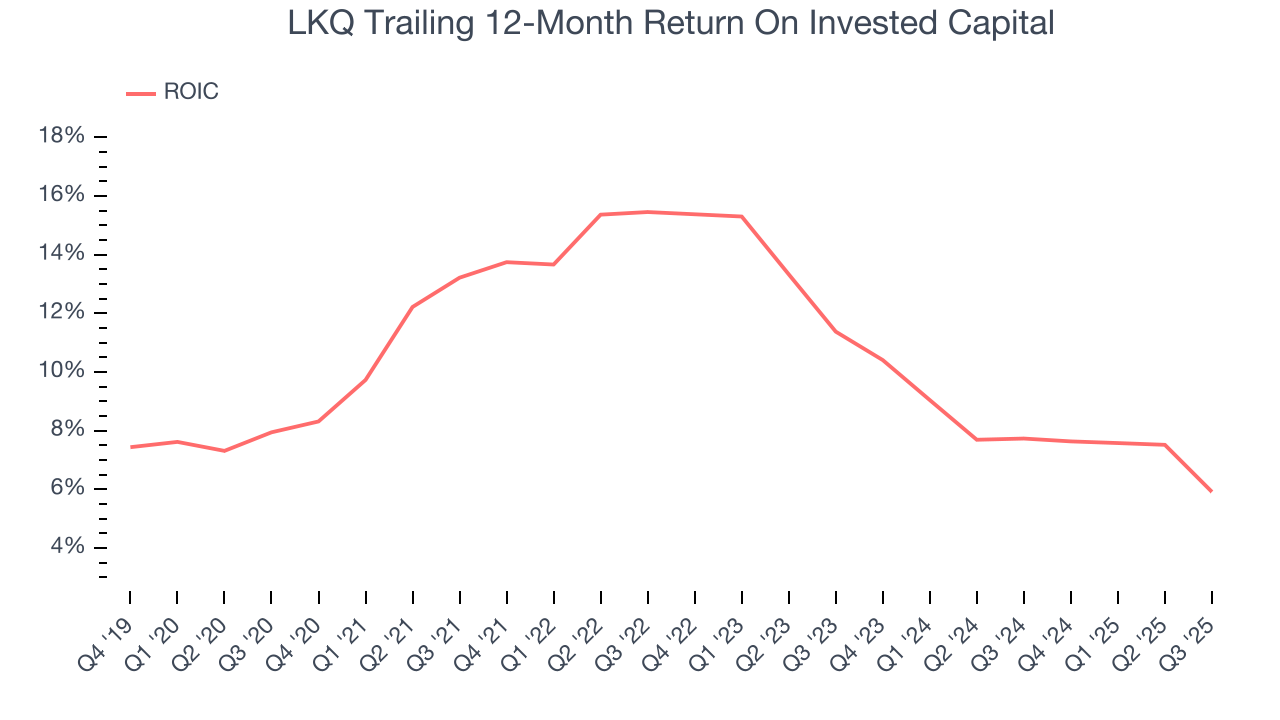
We like to invest in businesses with high returns, but the trend in a company’s ROIC is what often surprises the market and moves the stock price. Over the last few years, LKQ’s ROIC has unfortunately decreased. Paired with its already low returns, these declines suggest its profitable growth opportunities are few and far between.
10. Balance Sheet Assessment
LKQ reported $289 million of cash and $5.51 billion of debt on its balance sheet in the most recent quarter. As investors in high-quality companies, we primarily focus on two things: 1) that a company’s debt level isn’t too high and 2) that its interest payments are not excessively burdening the business.
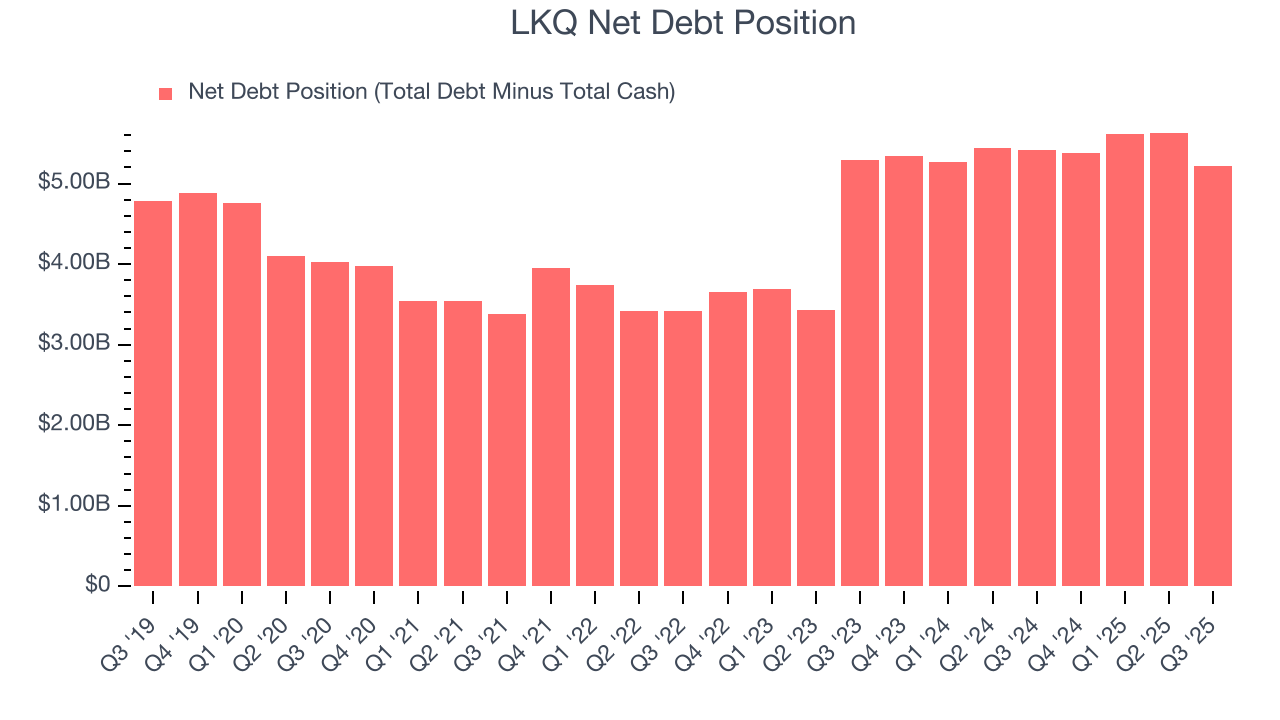
With $1.62 billion of EBITDA over the last 12 months, we view LKQ’s 3.2× net-debt-to-EBITDA ratio as safe. We also see its $108 million of annual interest expenses as appropriate. The company’s profits give it plenty of breathing room, allowing it to continue investing in growth initiatives.
11. Key Takeaways from LKQ’s Q3 Results
We enjoyed seeing LKQ beat analysts’ organic revenue expectations this quarter. We were also glad its EPS outperformed Wall Street’s estimates. On the other hand, its full-year EBITDA guidance missed and its revenue fell slightly short of Wall Street’s estimates. Overall, this quarter was mixed. Still, the stock traded up 3.5% to $31.10 immediately after reporting.
12. Is Now The Time To Buy LKQ?
Updated: January 23, 2026 at 9:49 PM EST
Before investing in or passing on LKQ, we urge you to understand the company’s business quality (or lack thereof), valuation, and the latest quarterly results - in that order.
We see the value of companies helping consumers, but in the case of LKQ, we’re out. To begin with, its revenue growth was weak over the last five years, and analysts expect its demand to deteriorate over the next 12 months. On top of that, LKQ’s Forecasted free cash flow margin for next year suggests the company will fail to improve its cash conversion, and its organic sales performance has disappointed.
LKQ’s P/E ratio based on the next 12 months is 10.8x. While this valuation is fair, the upside isn’t great compared to the potential downside. There are more exciting stocks to buy at the moment.
Wall Street analysts have a consensus one-year price target of $41.19 on the company (compared to the current share price of $33.99).
Although the price target is bullish, readers should exercise caution because analysts tend to be overly optimistic. The firms they work for, often big banks, have relationships with companies that extend into fundraising, M&A advisory, and other rewarding business lines. As a result, they typically hesitate to say bad things for fear they will lose out. We at StockStory do not suffer from such conflicts of interest, so we’ll always tell it like it is.