Micron (MU)
Micron is a world-class company. Its rapid revenue growth gives it operating leverage, making it more profitable as it expands.― StockStory Analyst Team
1. News


2. Summary
Why We Like Micron
Founded in the basement of a Boise, Idaho dental office in 1978, Micron (NYSE:MU) is a leading provider of memory chips used in thousands of devices across mobile, data centers, industrial, consumer, and automotive markets.
- Annual revenue growth of 78.2% over the past two years was outstanding, reflecting market share gains this cycle
- Incremental sales over the last five years have been highly profitable as its earnings per share increased by 43% annually, topping its revenue gains
- Projected revenue growth of 171% for the next 12 months is above its two-year trend, pointing to accelerating demand


We have an affinity for Micron. The valuation looks reasonable relative to its quality, and we think now is a prudent time to invest.
Why Is Now The Time To Buy Micron?


At $425.56 per share, Micron trades at 5x forward P/E. The stock’s multiple sure seems like a bargain relative to its business quality and fundamentals.
We jump for joy when high-quality companies trade at bargain prices because shareholders can benefit from both earnings growth and a positive re-rating - a powerful one-two punch.
3. Micron (MU) Research Report: Q1 CY2026 Update
Memory chips maker Micron (NYSE:MU) reported Q1 CY2026 results beating Wall Street’s revenue expectations, with sales up 196% year on year to $23.86 billion. On top of that, next quarter’s revenue guidance ($33.5 billion at the midpoint) was surprisingly good and 41.4% above what analysts were expecting. Its non-GAAP profit of $12.20 per share was 40.8% above analysts’ consensus estimates.
Micron (MU) Q1 CY2026 Highlights:
- Revenue: $23.86 billion vs analyst estimates of $19.87 billion (196% year-on-year growth, 20.1% beat)
- Adjusted EPS: $12.20 vs analyst estimates of $8.66 (40.8% beat)
- Adjusted Operating Income: $16.46 billion vs analyst estimates of $11.74 billion (69% margin, 40.1% beat)
- Revenue Guidance for Q2 CY2026 is $33.5 billion at the midpoint, above analyst estimates of $23.69 billion
- Adjusted EPS guidance for Q2 CY2026 is $19.15 at the midpoint, above analyst estimates of $10.71
- Operating Margin: 67.6%, up from 22% in the same quarter last year
- Free Cash Flow was $6.90 billion, up from -$113 million in the same quarter last year
- Inventory Days Outstanding: 123, down from 125 in the previous quarter
- Market Capitalization: $519.6 billion
Company Overview
Founded in the basement of a Boise, Idaho dental office in 1978, Micron (NYSE:MU) is a leading provider of memory chips used in thousands of devices across mobile, data centers, industrial, consumer, and automotive markets.
Micron is one of the leading producers of both DRAM and NAND memory chips globally, though DRAM has consistently accounted for the majority of Micron’s revenues. Micron’s DRAM is mostly used in PCs, servers, networking gear, along with industrial and automotive verticals. NAND is used in the same end markets, along with a heavy weighting in consumer devices like smartphones and tablets.
Memory has the most volatile pricing dynamics in the semiconductors industry, which can result in Micron’s earnings results fluctuating wildly. As a result Micron’s valuation will often appear abnormally low compared to other semiconductors during the peak of the memory cycle, with the stock often trading for low to mid single digit forward earnings multiples (4x-8x) before dramatically expanding to high teens to mid twenties (18x-24x) when the cycle turns down.
Micron’s peers and competitors include Western Digital (NASDAQ:WDC), Seagate (NASDAQ:STX), SK Hynix (KOSI:000660), and Samsung (KOSI:005930).
4. Memory Semiconductors
The global memory chip market has become concentrated due to the highly commoditized nature of these semiconductors. Despite the market consolidation, DRAM and NAND are subject to wide pricing swings as supply and demand ebbs and flows. This plays itself out in the business models of memory producers, where the large, fixed cost bases required to produce memory chips in volume can become very profitable during times of rising prices due to high demand and tight supply but also can result in periods of low profitability when more supply is brought online or demand drops.
5. Revenue Growth
A company’s long-term sales performance can indicate its overall quality. Any business can have short-term success, but a top-tier one grows for years. Luckily, Micron’s sales grew at an exceptional 19.9% compounded annual growth rate over the last five years. Its growth surpassed the average semiconductor company and shows its offerings resonate with customers, a great starting point for our analysis. Semiconductors are a cyclical industry, and long-term investors should be prepared for periods of high growth followed by periods of revenue contractions (which can sometimes offer opportune times to buy).
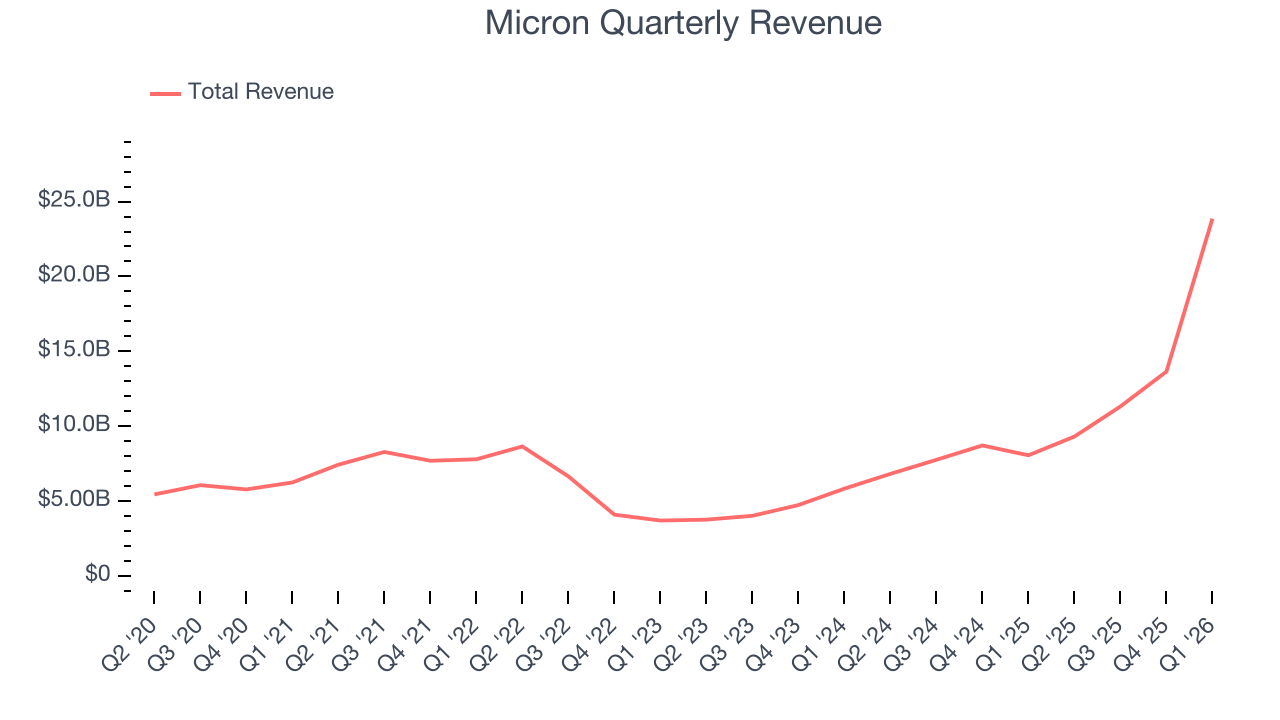
Long-term growth is the most important, but short-term results matter for semiconductors because the rapid pace of technological innovation (Moore's Law) could make yesterday's hit product obsolete today. Micron’s annualized revenue growth of 78.2% over the last two years is above its five-year trend, suggesting its demand was strong and recently accelerated. 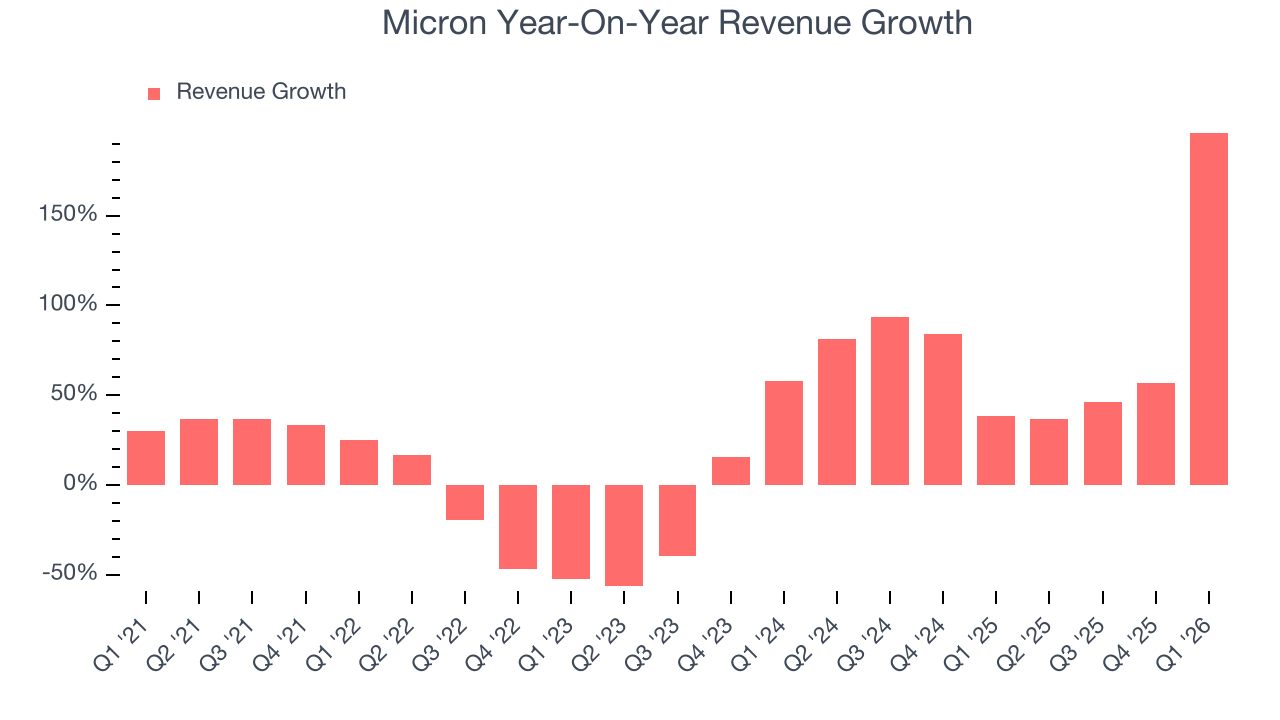
This quarter, Micron reported magnificent year-on-year revenue growth of 196%, and its $23.86 billion of revenue beat Wall Street’s estimates by 20.1%. Beyond the beat, this marks 10 straight quarters of growth, showing that the current upcycle has had a good run - a typical upcycle usually lasts 8-10 quarters. Company management is currently guiding for a 260% year-on-year increase in sales next quarter.
Looking further ahead, sell-side analysts expect revenue to grow 84.5% over the next 12 months, an improvement versus the last two years. This projection is eye-popping for a company of its scale and indicates its newer products and services will spur better top-line performance.
6. Product Demand & Outstanding Inventory
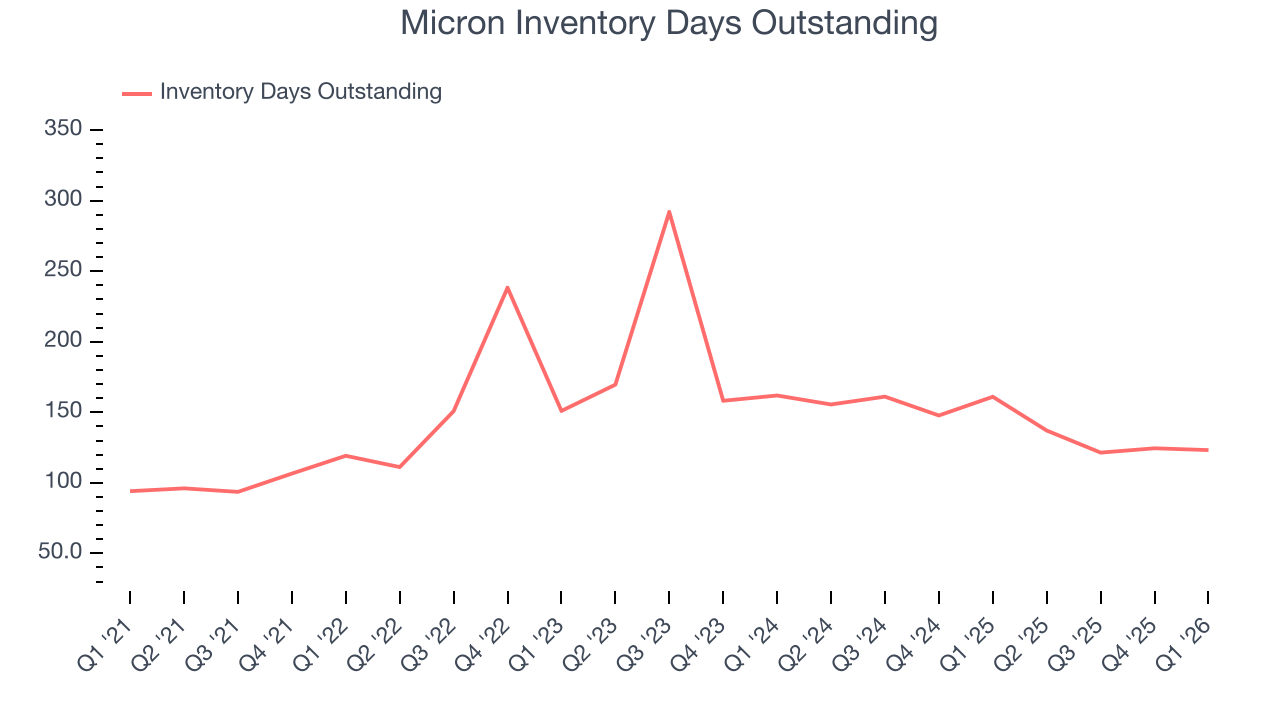
Days Inventory Outstanding (DIO) is an important metric for chipmakers, as it reflects a business’ capital intensity and the cyclical nature of semiconductor supply and demand. In a tight supply environment, inventories tend to be stable, allowing chipmakers to exert pricing power. Steadily increasing DIO can be a warning sign that demand is weak, and if inventories continue to rise, the company may have to downsize production.
This quarter, Micron’s DIO came in at 123, which is 26 days below its five-year average. At the moment, these numbers show no indication of an excessive inventory buildup.
7. Gross Margin & Pricing Power
Gross profit margin is a key metric to track because it shows how much money a semiconductor company gets to keep after paying for its raw materials, manufacturing, and other input costs.
Micron’s unit economics are roughly in line with other semiconductor businesses, pointing to a lack of significant pricing pressure and the effectiveness of its products. As you can see below, it averaged a decent 50.1% gross margin over the last two years. Said differently, Micron paid its suppliers $49.86 for every $100 in revenue. 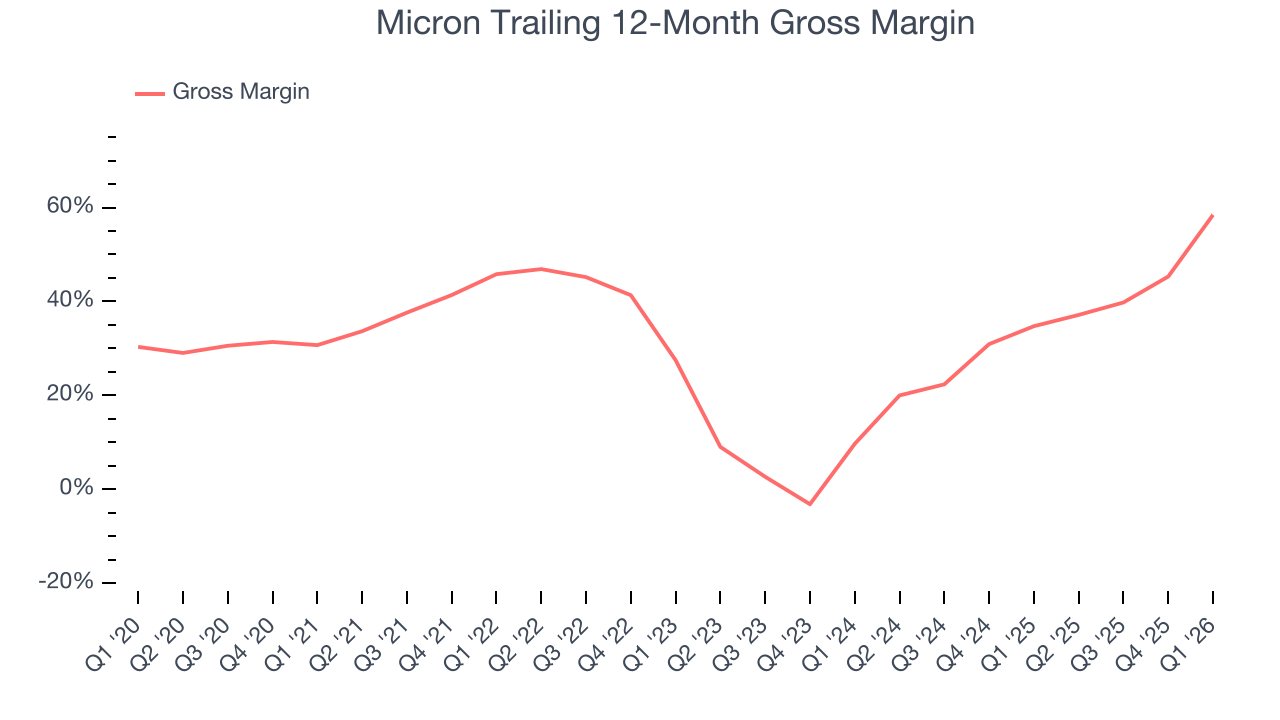
This quarter, Micron’s gross profit margin was 74.4%, up 37.6 percentage points year on year. Micron’s full-year margin has also been trending up over the past 12 months, increasing by 23.7 percentage points. If this move continues, it could suggest a less competitive environment where the company has better pricing power and leverage from its growing sales on the fixed portion of its cost of goods sold (such as manufacturing expenses).
8. Operating Margin
Micron has been a well-oiled machine over the last two years. It demonstrated elite profitability for a semiconductor business, boasting an average operating margin of 38.3%.
Analyzing the trend in its profitability, Micron’s operating margin rose by 16.5 percentage points over the last five years, as its sales growth gave it immense operating leverage.
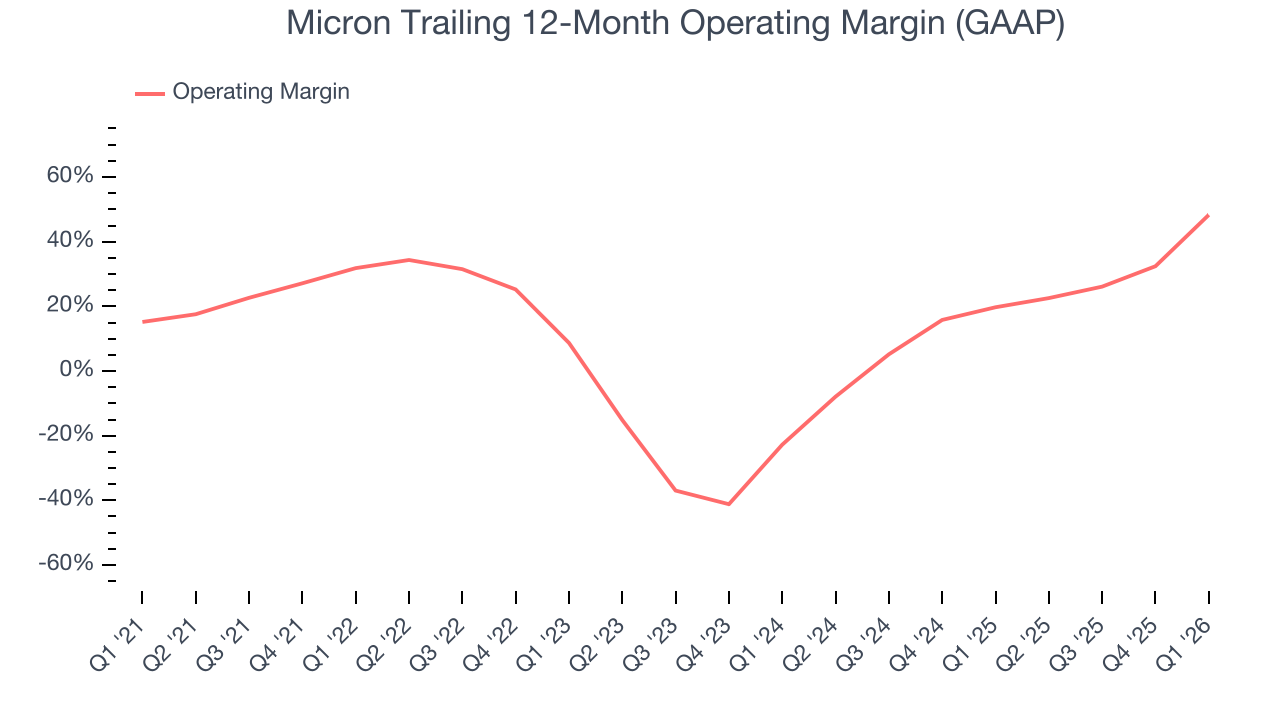
In Q1, Micron generated an operating margin profit margin of 67.6%, up 45.6 percentage points year on year. The increase was solid, and because its operating margin rose more than its gross margin, we can infer it was more efficient with expenses such as marketing, R&D, and administrative overhead.
9. Earnings Per Share
We track the long-term change in earnings per share (EPS) for the same reason as long-term revenue growth. Compared to revenue, however, EPS highlights whether a company’s growth is profitable.
Micron’s EPS grew at 43% compounded annual growth rate over the last five years, higher than its 19.9% annualized revenue growth. This tells us the company became more profitable on a per-share basis as it expanded.
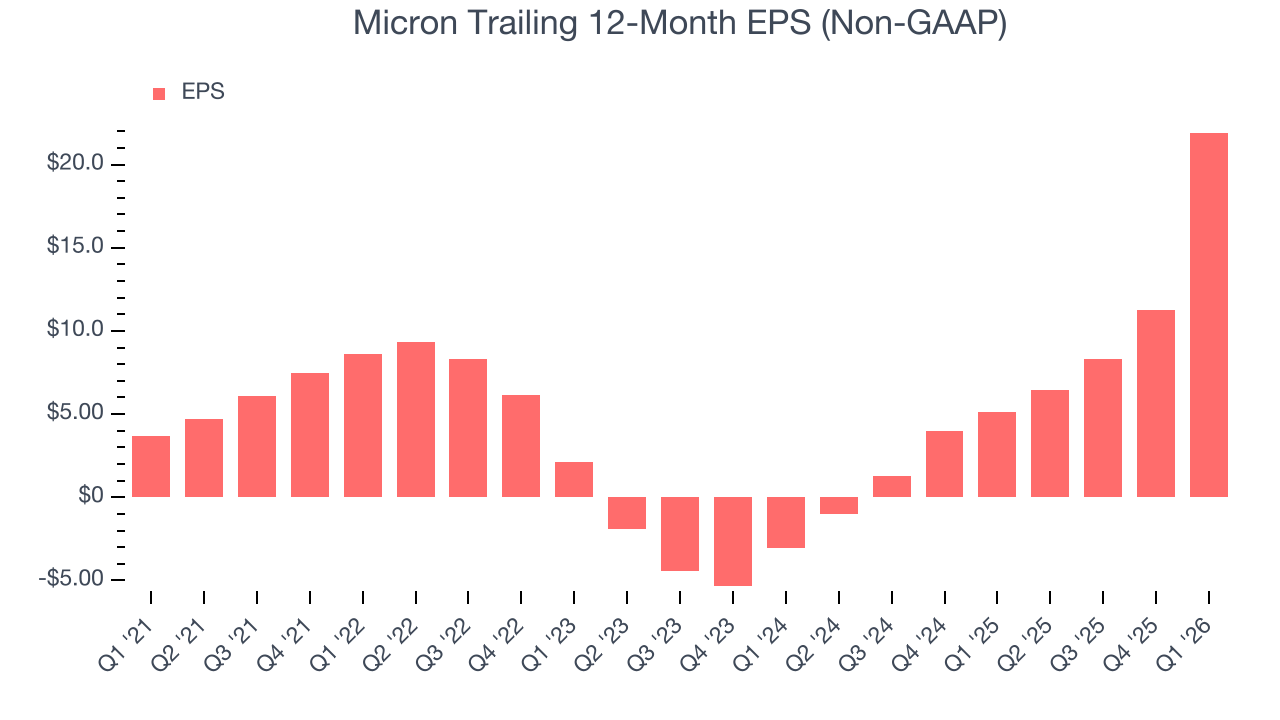
We can take a deeper look into Micron’s earnings quality to better understand the drivers of its performance. As we mentioned earlier, Micron’s operating margin expanded by 16.5 percentage points over the last five years. This was the most relevant factor (aside from the revenue impact) behind its higher earnings; interest expenses and taxes can also affect EPS but don’t tell us as much about a company’s fundamentals.
In Q1, Micron reported adjusted EPS of $12.20, up from $1.56 in the same quarter last year. This print easily cleared analysts’ estimates, and shareholders should be content with the results. Over the next 12 months, Wall Street expects Micron’s full-year EPS of $21.92 to grow 123%.
10. Cash Is King
Free cash flow isn't a prominently featured metric in company financials and earnings releases, but we think it's telling because it accounts for all operating and capital expenses, making it tough to manipulate. Cash is king.
Micron has shown mediocre cash profitability relative to peers over the last two years, giving the company fewer opportunities to return capital to shareholders. Its free cash flow margin averaged 13.7%, below what we’d expect for a semiconductor business. The divergence from its good operating margin stems from its capital-intensive business model, which requires Micron to make large cash investments in working capital and capital expenditures.
Taking a step back, an encouraging sign is that Micron’s margin expanded by 4.5 percentage points over the last five years. We have no doubt shareholders would like to continue seeing its cash conversion rise as it gives the company more optionality.
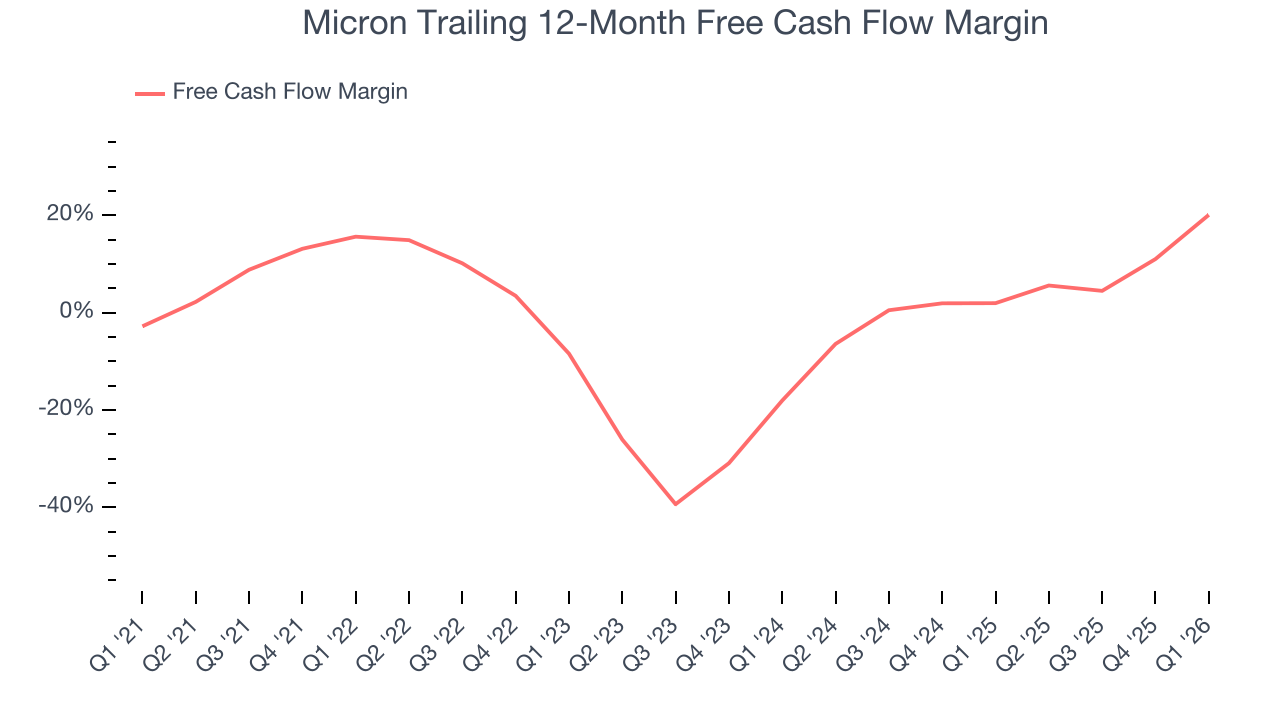
Micron’s free cash flow clocked in at $6.90 billion in Q1, equivalent to a 28.9% margin. Its cash flow turned positive after being negative in the same quarter last year, building on its favorable historical trend.
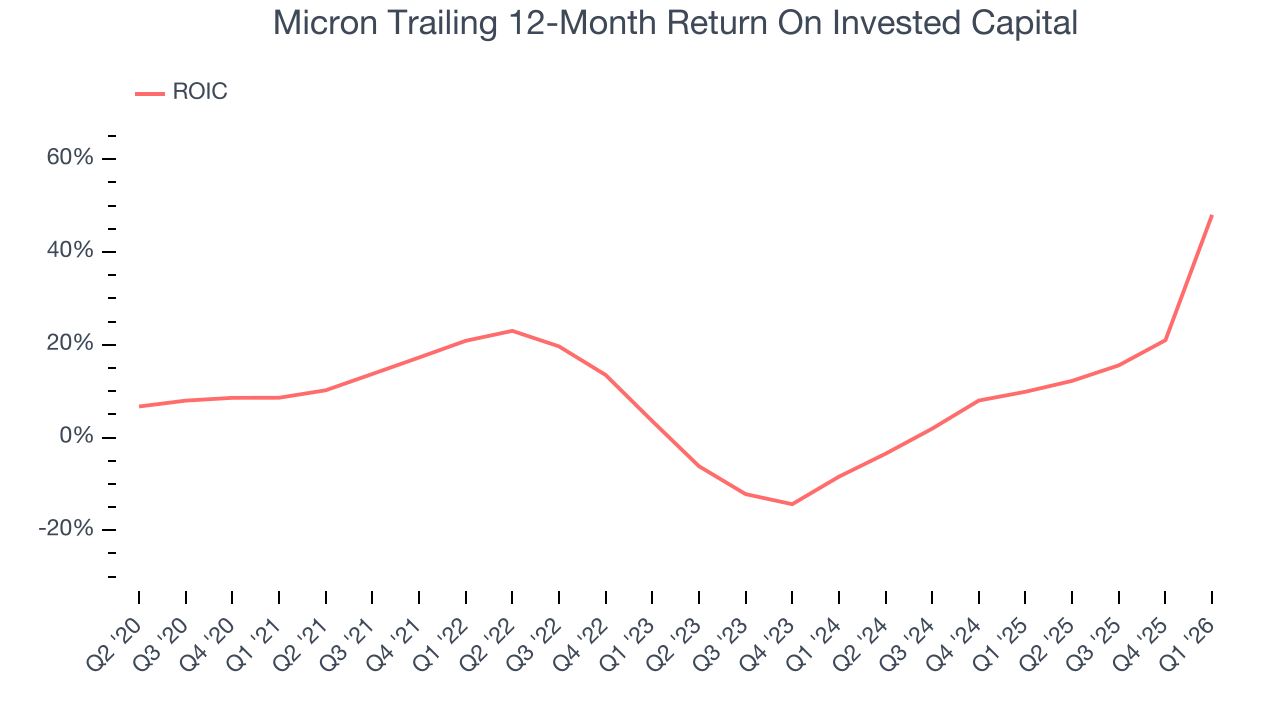
11. Return on Invested Capital (ROIC)
EPS and free cash flow tell us whether a company was profitable while growing its revenue. But was it capital-efficient? Enter ROIC, a metric showing how much operating profit a company generates relative to the money it has raised (debt and equity).
Although Micron has shown solid fundamentals lately, it historically did a mediocre job investing in profitable growth initiatives. Its five-year average ROIC was 14.8%, somewhat low compared to the best semiconductor companies that consistently pump out 35%+.
12. Balance Sheet Assessment
Big corporations like Micron are attractive to many investors in times of instability thanks to their fortress balance sheets that buffer pockets of soft demand.
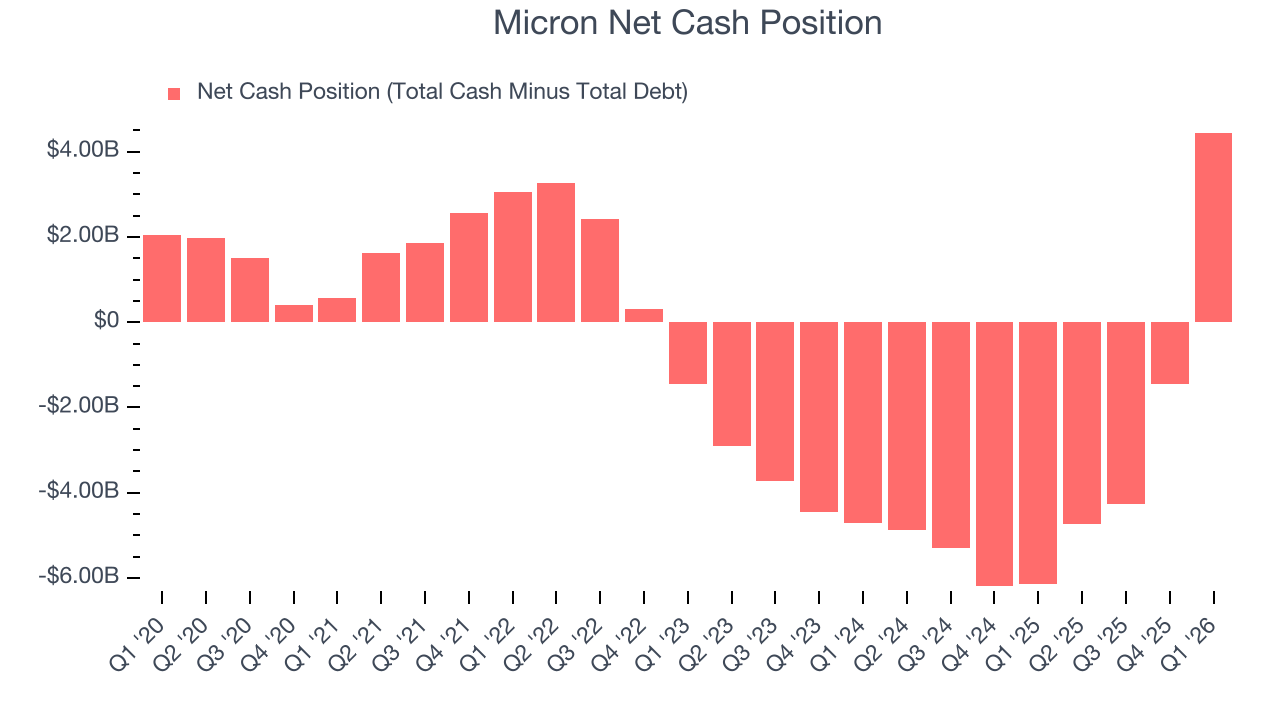
Micron is a profitable, well-capitalized company with $14.59 billion of cash and $10.14 billion of debt on its balance sheet. This $4.45 billion net cash position gives it the freedom to borrow money, return capital to shareholders, or invest in growth initiatives. Leverage is not an issue here.
13. Key Takeaways from Micron’s Q1 Results
It was good to see Micron beat analysts’ EPS expectations this quarter. We were also excited its adjusted operating income outperformed Wall Street’s estimates by a wide margin. Zooming out, we think this was a solid print. The stock remained flat at $462.84 immediately following the results.
14. Is Now The Time To Buy Micron?
Updated: March 20, 2026 at 10:20 PM EDT
The latest quarterly earnings matters, sure, but we actually think longer-term fundamentals and valuation matter more. Investors should consider all these pieces before deciding whether or not to invest in Micron.
Micron is an amazing business ranking highly on our list. For starters, its revenue growth was exceptional over the last five years and is expected to accelerate over the next 12 months. On top of that, its impressive operating margins show it has a highly efficient business model, and its expanding operating margin shows the business has become more efficient.
Micron’s P/E ratio based on the next 12 months is 5x. Looking across the spectrum of semiconductor businesses, Micron’s fundamentals clearly illustrate it’s a special business. We’re pounding the table at this bargain price.
Wall Street analysts have a consensus one-year price target of $512.68 on the company (compared to the current share price of $425.56), implying they see 20.5% upside in buying Micron in the short term.