Micron (MU)
Micron is an exciting business. Its revenue is growing quickly while its profitability is rising, giving it multiple ways to win.― StockStory Analyst Team
1. News


2. Summary
Why We Like Micron
Founded in the basement of a Boise, Idaho dental office in 1978, Micron (NYSE:MU) is a leading provider of memory chips used in thousands of devices across mobile, data centers, industrial, consumer, and automotive markets.
- Annual revenue growth of 61.7% over the past two years was outstanding, reflecting market share gains this cycle
- Earnings per share grew by 29.2% annually over the last five years, massively outpacing its peers
- Exciting sales outlook for the upcoming 12 months calls for 102% growth, an acceleration from its two-year trend


Micron is a standout company. The valuation seems reasonable based on its quality, so this might be an opportune time to buy some shares.
Why Is Now The Time To Buy Micron?


Micron’s stock price of $399.34 implies a valuation ratio of 10.3x forward P/E. This multiple is lower than most semiconductor companies, and we think the stock is a deal when considering its quality characteristics.
Entry price matters much less than business quality when investing for the long term, but hey, it certainly doesn’t hurt to get in at an attractive price.
3. Micron (MU) Research Report: Q4 CY2025 Update
Memory chips maker Micron (NYSE:MU) reported revenue ahead of Wall Streets expectations in Q4 CY2025, with sales up 56.7% year on year to $13.64 billion. On top of that, next quarter’s revenue guidance ($18.7 billion at the midpoint) was surprisingly good and 29.3% above what analysts were expecting. Its non-GAAP profit of $4.78 per share was 20.7% above analysts’ consensus estimates.
Micron (MU) Q4 CY2025 Highlights:
- Revenue: $13.64 billion vs analyst estimates of $13 billion (56.7% year-on-year growth, 5% beat)
- Adjusted EPS: $4.78 vs analyst estimates of $3.96 (20.7% beat)
- Adjusted Operating Income: $6.42 billion vs analyst estimates of $5.34 billion (47% margin, 20.3% beat)
- Revenue Guidance for Q1 CY2026 is $18.7 billion at the midpoint, above analyst estimates of $14.46 billion
- Adjusted EPS guidance for Q1 CY2026 is $8.42 at the midpoint, above analyst estimates of $4.49
- Operating Margin: 45%, up from 25% in the same quarter last year
- Free Cash Flow Margin: 28.6%, up from 0.4% in the same quarter last year
- Inventory Days Outstanding: 125, up from 121 in the previous quarter
- Market Capitalization: $261 billion
Company Overview
Founded in the basement of a Boise, Idaho dental office in 1978, Micron (NYSE:MU) is a leading provider of memory chips used in thousands of devices across mobile, data centers, industrial, consumer, and automotive markets.
Micron is one of the leading producers of both DRAM and NAND memory chips globally, though DRAM has consistently accounted for the majority of Micron’s revenues. Micron’s DRAM is mostly used in PCs, servers, networking gear, along with industrial and automotive verticals. NAND is used in the same end markets, along with a heavy weighting in consumer devices like smartphones and tablets.
Memory has the most volatile pricing dynamics in the semiconductors industry, which can result in Micron’s earnings results fluctuating wildly. As a result Micron’s valuation will often appear abnormally low compared to other semiconductors during the peak of the memory cycle, with the stock often trading for low to mid single digit forward earnings multiples (4x-8x) before dramatically expanding to high teens to mid twenties (18x-24x) when the cycle turns down.
Micron’s peers and competitors include Western Digital (NASDAQ:WDC), Seagate (NASDAQ:STX), SK Hynix (KOSI:000660), and Samsung (KOSI:005930).
4. Memory Semiconductors
The global memory chip market has become concentrated due to the highly commoditized nature of these semiconductors. Despite the market consolidation, DRAM and NAND are subject to wide pricing swings as supply and demand ebbs and flows. This plays itself out in the business models of memory producers, where the large, fixed cost bases required to produce memory chips in volume can become very profitable during times of rising prices due to high demand and tight supply but also can result in periods of low profitability when more supply is brought online or demand drops.
5. Revenue Growth
A company’s long-term sales performance can indicate its overall quality. Any business can have short-term success, but a top-tier one grows for years. Thankfully, Micron’s 13.9% annualized revenue growth over the last five years was impressive. Its growth beat the average semiconductor company and shows its offerings resonate with customers, a helpful starting point for our analysis. Semiconductors are a cyclical industry, and long-term investors should be prepared for periods of high growth followed by periods of revenue contractions.
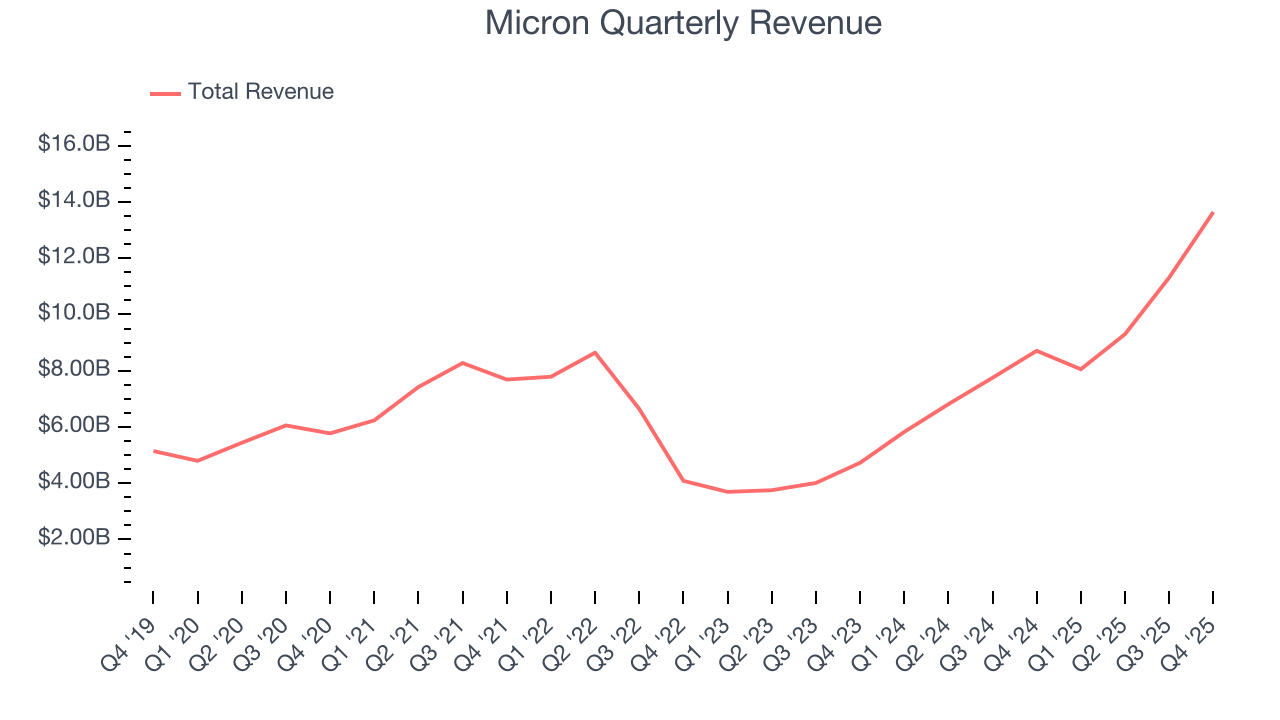
We at StockStory place the most emphasis on long-term growth, but within semiconductors, a half-decade historical view may miss new demand cycles or industry trends like AI. Micron’s annualized revenue growth of 61.7% over the last two years is above its five-year trend, suggesting its demand was strong and recently accelerated. 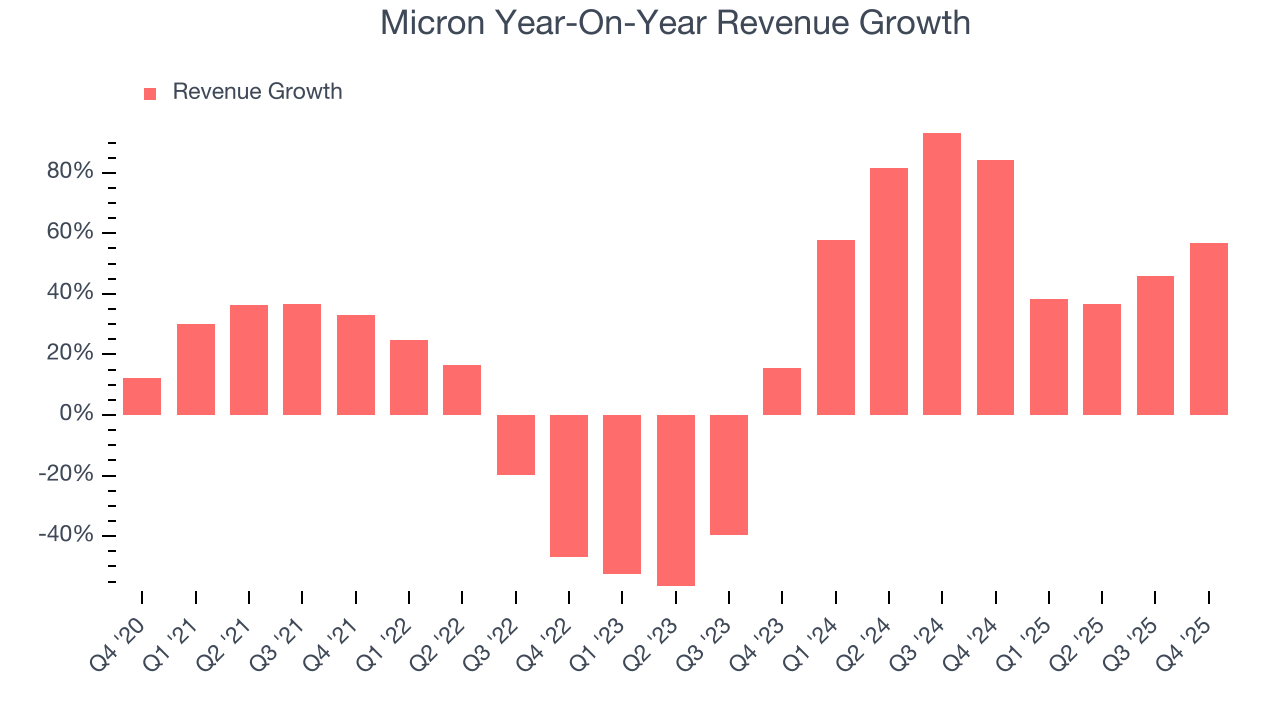
This quarter, Micron reported magnificent year-on-year revenue growth of 56.7%, and its $13.64 billion of revenue beat Wall Street’s estimates by 5%. Beyond the beat, this marks 9 straight quarters of growth, showing that the current upcycle has had a good run - a typical upcycle usually lasts 8-10 quarters. Company management is currently guiding for a 132% year-on-year increase in sales next quarter.
Looking further ahead, sell-side analysts expect revenue to grow 53.7% over the next 12 months, a deceleration versus the last two years. Still, this projection is eye-popping given its scale and indicates the market is baking in success for its products and services.
6. Product Demand & Outstanding Inventory
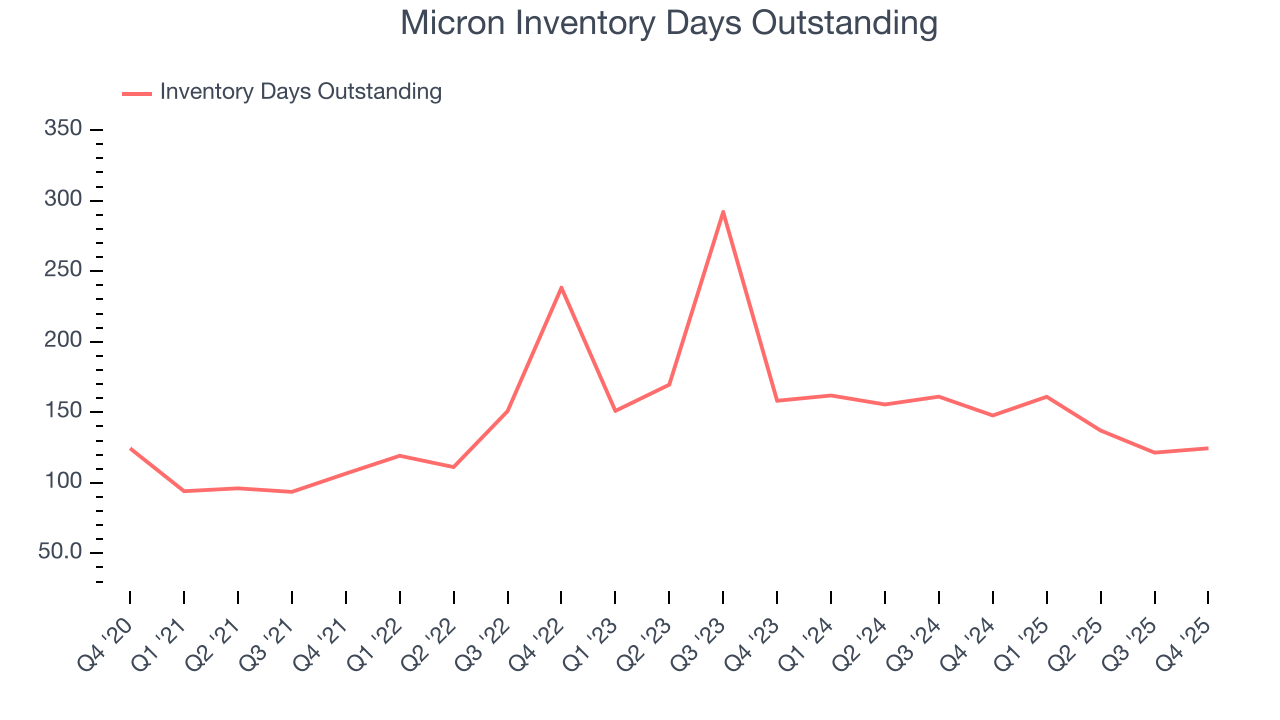
Days Inventory Outstanding (DIO) is an important metric for chipmakers, as it reflects a business’ capital intensity and the cyclical nature of semiconductor supply and demand. In a tight supply environment, inventories tend to be stable, allowing chipmakers to exert pricing power. Steadily increasing DIO can be a warning sign that demand is weak, and if inventories continue to rise, the company may have to downsize production.
This quarter, Micron’s DIO came in at 125, which is 23 days below its five-year average. These numbers show that despite the recent increase, there’s no indication of an excessive inventory buildup.
7. Gross Margin & Pricing Power
In the semiconductor industry, a company’s gross profit margin is a critical metric to track because it sheds light on its pricing power, complexity of products, and ability to procure raw materials, equipment, and labor.
Micron’s gross margin is well below other semiconductor companies, indicating a lack of pricing power and a competitive market. As you can see below, it averaged a 39.4% gross margin over the last two years. That means Micron paid its suppliers a lot of money ($60.55 for every $100 in revenue) to run its business. 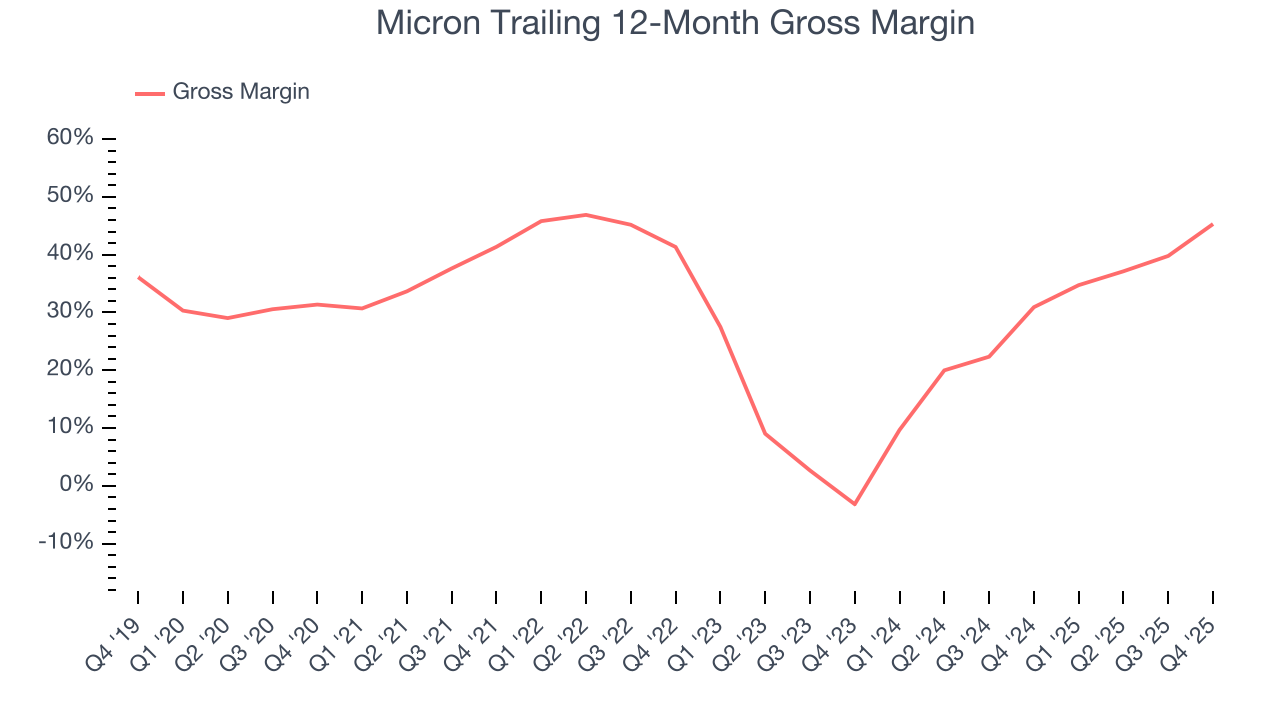
Micron produced a 56% gross profit margin in Q4, marking a 17.6 percentage point increase from 38.4% in the same quarter last year. Micron’s full-year margin has also been trending up over the past 12 months, increasing by 14.4 percentage points. If this move continues, it could suggest a less competitive environment where the company has better pricing power and leverage from its growing sales on the fixed portion of its cost of goods sold (such as manufacturing expenses).
8. Operating Margin
Micron has been an efficient company over the last two years. It was one of the more profitable businesses in the semiconductor sector, boasting an average operating margin of 25.7%. This result was particularly impressive because of its low gross margin, which is mostly a factor of what it sells and takes huge shifts to move meaningfully. Companies have more control over their operating margins, and it’s a show of well-managed operations if they’re high when gross margins are low.
Looking at the trend in its profitability, Micron’s operating margin rose by 5.3 percentage points over the last five years, as its sales growth gave it operating leverage.
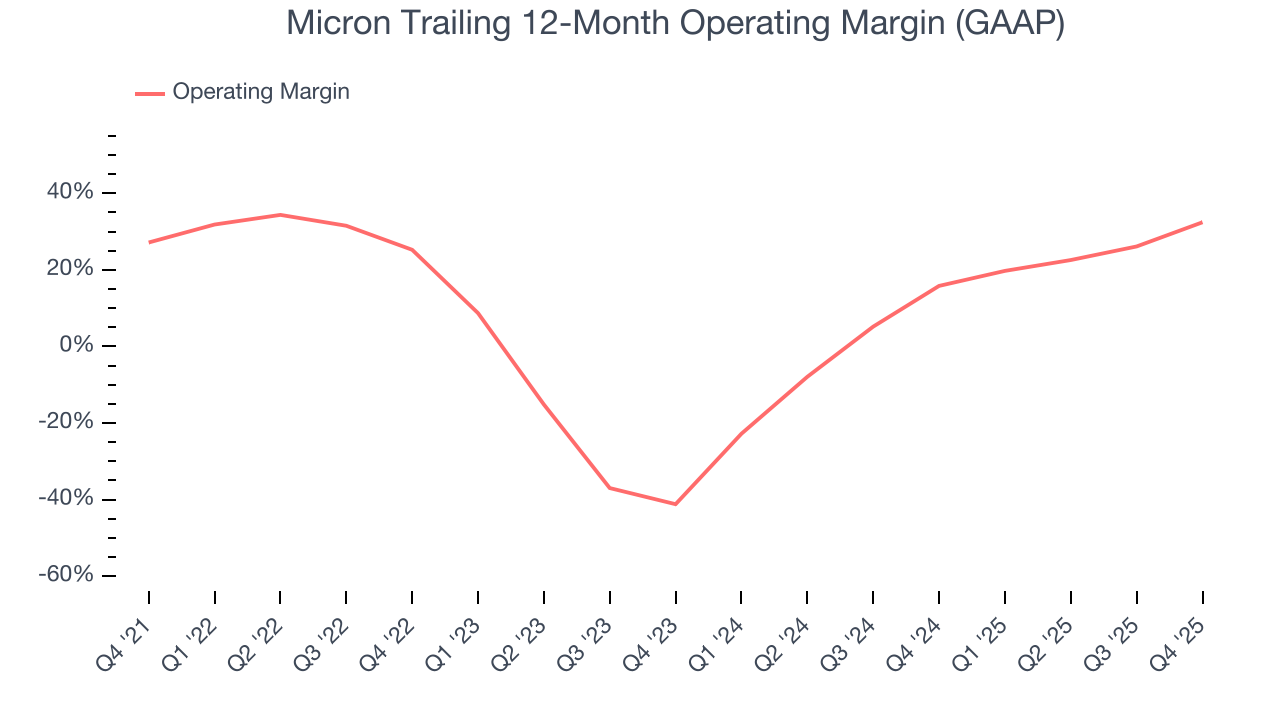
In Q4, Micron generated an operating margin profit margin of 45%, up 20 percentage points year on year. The increase was solid, and because its operating margin rose more than its gross margin, we can infer it was more efficient with expenses such as marketing, R&D, and administrative overhead.
9. Earnings Per Share
We track the long-term change in earnings per share (EPS) for the same reason as long-term revenue growth. Compared to revenue, however, EPS highlights whether a company’s growth is profitable.
Micron’s EPS grew at an astounding 29.2% compounded annual growth rate over the last five years, higher than its 13.9% annualized revenue growth. This tells us the company became more profitable on a per-share basis as it expanded.
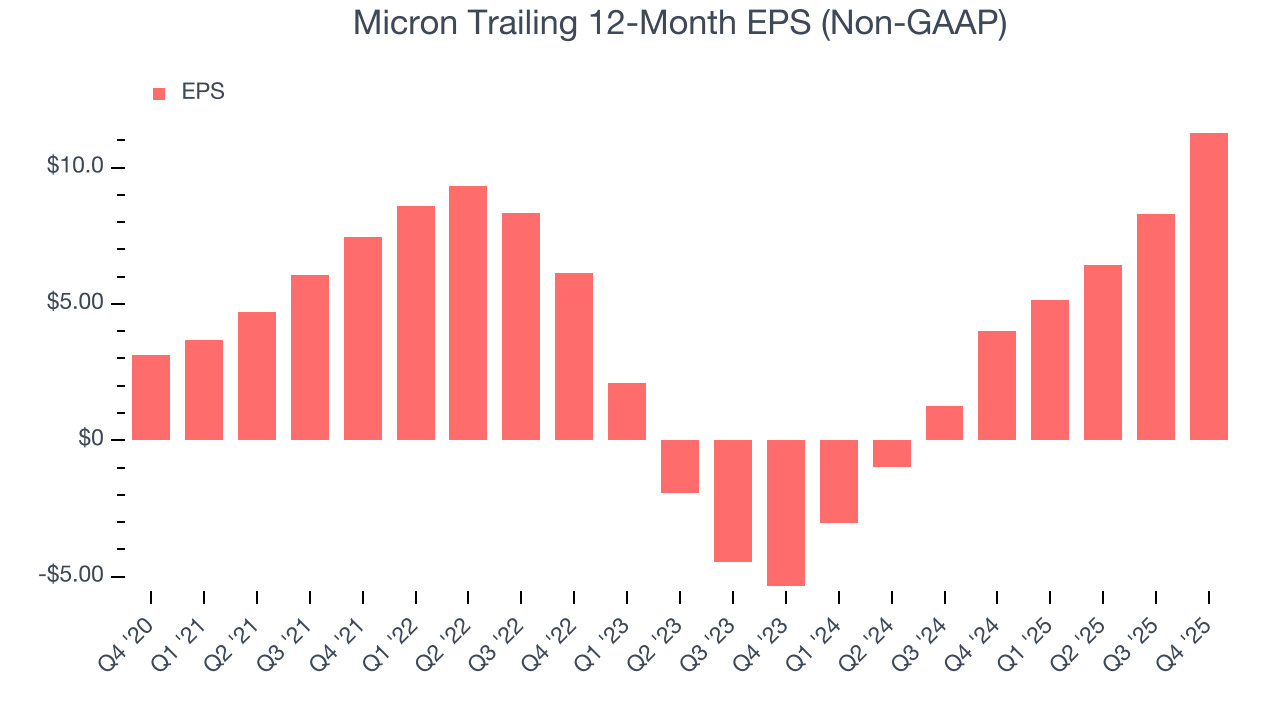
Diving into the nuances of Micron’s earnings can give us a better understanding of its performance. As we mentioned earlier, Micron’s operating margin expanded by 5.3 percentage points over the last five years. This was the most relevant factor (aside from the revenue impact) behind its higher earnings; interest expenses and taxes can also affect EPS but don’t tell us as much about a company’s fundamentals.
In Q4, Micron reported adjusted EPS of $4.78, up from $1.79 in the same quarter last year. This print easily cleared analysts’ estimates, and shareholders should be content with the results. Over the next 12 months, Wall Street expects Micron’s full-year EPS of $11.28 to grow 91.2%.
10. Cash Is King
Although earnings are undoubtedly valuable for assessing company performance, we believe cash is king because you can’t use accounting profits to pay the bills.
Micron has shown poor cash profitability over the last two years, giving the company limited opportunities to return capital to shareholders. Its free cash flow margin averaged 8.5%, lousy for a semiconductor business. The divergence from its good operating margin stems from its capital-intensive business model, which requires Micron to make large cash investments in working capital and capital expenditures.
Taking a step back, we can see that Micron failed to improve its margin over the last five years. It may have ticked higher more recently, but shareholders are likely hoping for its margin to at least revert to its historical level.
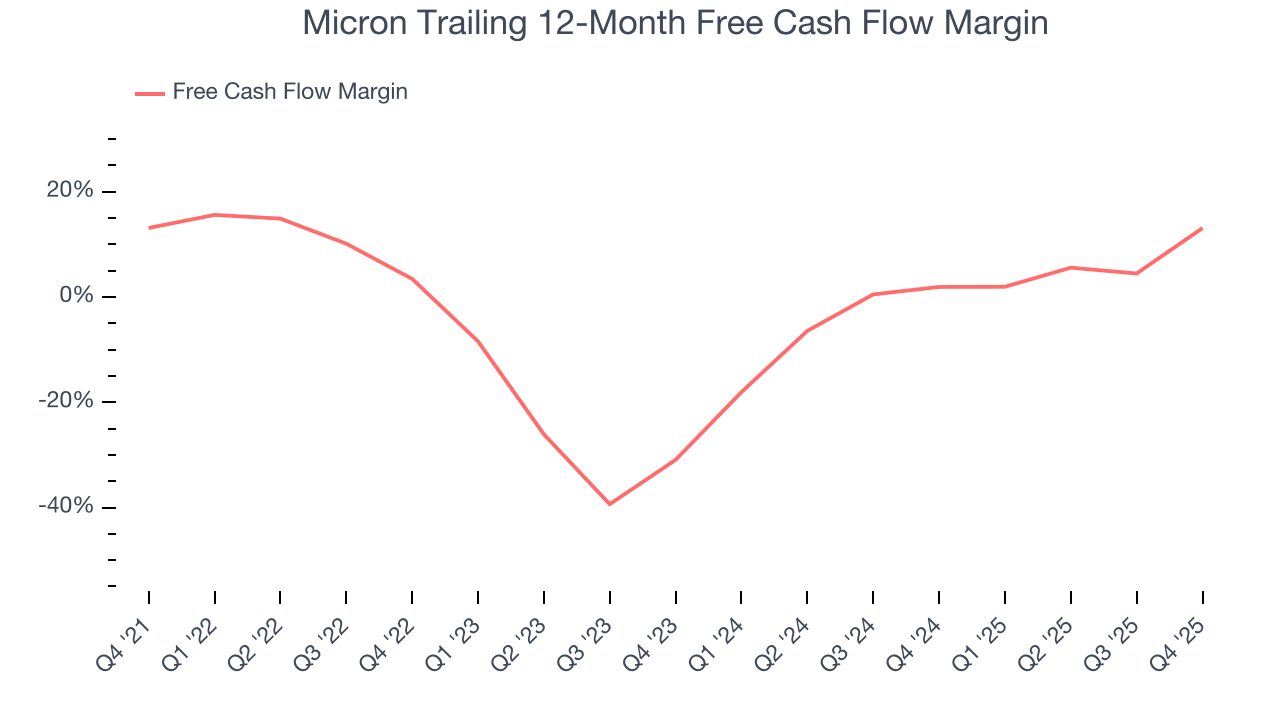
Micron’s free cash flow clocked in at $3.91 billion in Q4, equivalent to a 28.6% margin. This result was good as its margin was 28.2 percentage points higher than in the same quarter last year. Its cash profitability was also above its two-year level, and we hope the company can build on this trend.
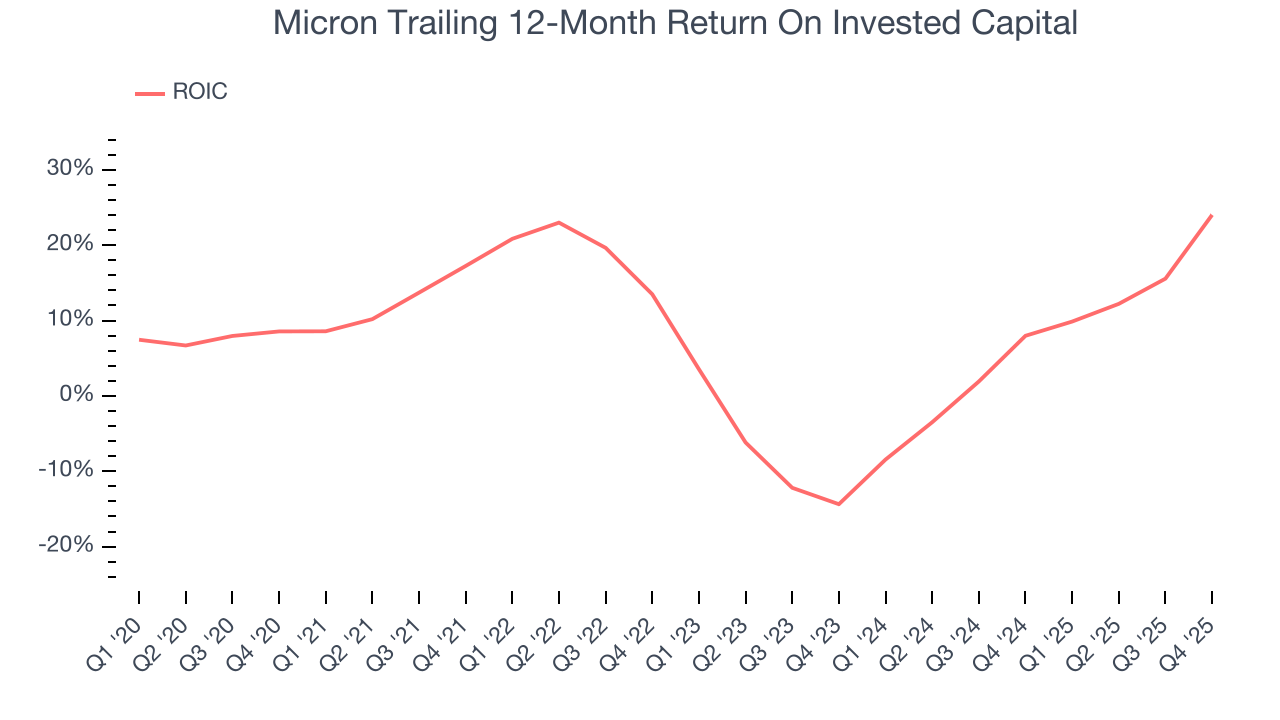
11. Return on Invested Capital (ROIC)
EPS and free cash flow tell us whether a company was profitable while growing its revenue. But was it capital-efficient? Enter ROIC, a metric showing how much operating profit a company generates relative to the money it has raised (debt and equity).
Although Micron has shown solid business quality lately, it historically did a mediocre job investing in profitable growth initiatives. Its five-year average ROIC was 9.7%, somewhat low compared to the best semiconductor companies that consistently pump out 35%+.
12. Balance Sheet Assessment
Micron reported $10.32 billion of cash and $11.76 billion of debt on its balance sheet in the most recent quarter. As investors in high-quality companies, we primarily focus on two things: 1) that a company’s debt level isn’t too high and 2) that its interest payments are not excessively burdening the business.
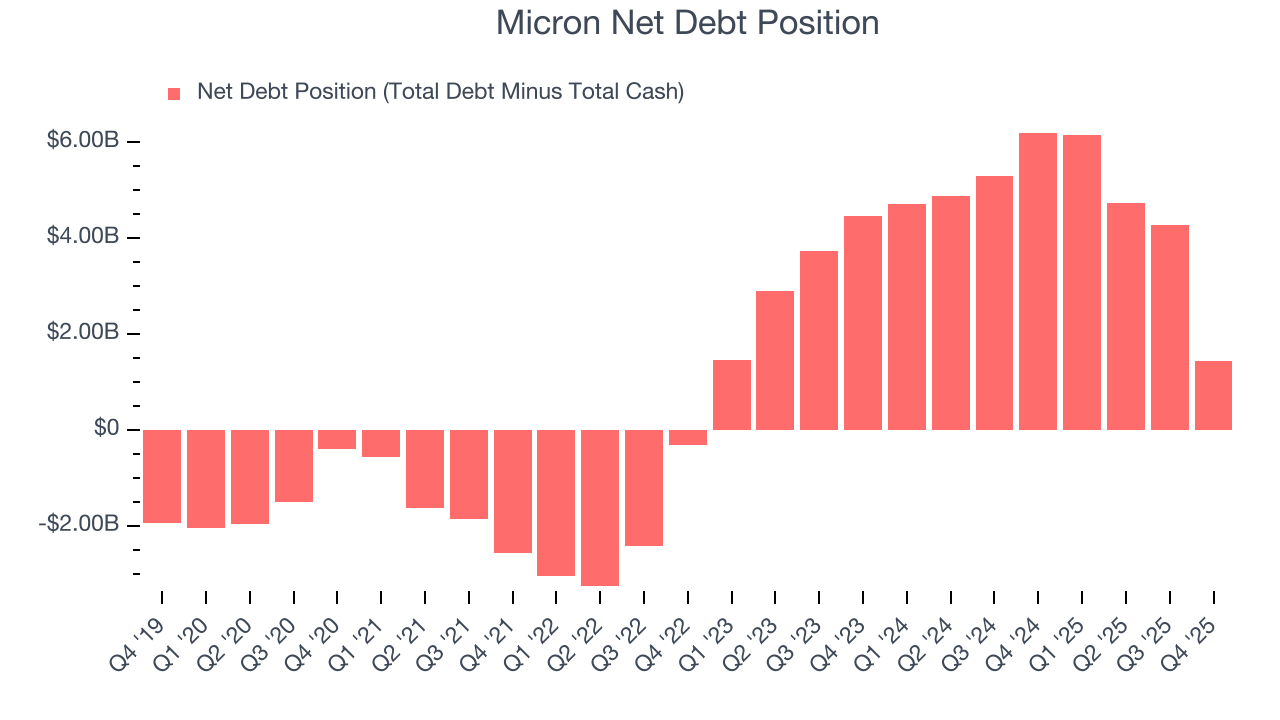
With $23.41 billion of EBITDA over the last 12 months, we view Micron’s 0.1× net-debt-to-EBITDA ratio as safe. We also see its $95 million of annual interest expenses as appropriate. The company’s profits give it plenty of breathing room, allowing it to continue investing in growth initiatives.
13. Key Takeaways from Micron’s Q4 Results
It was good to see Micron beat analysts’ EPS expectations this quarter. We were also excited its adjusted operating income outperformed Wall Street’s estimates by a wide margin. Looking ahead, both revenue and EPS guidance for next quarter beat as well. Zooming out, we think this was a very solid print. The stock traded up 6.1% to $239.54 immediately following the results.
14. Is Now The Time To Buy Micron?
Updated: January 24, 2026 at 9:15 PM EST
Before making an investment decision, investors should account for Micron’s business fundamentals and valuation in addition to what happened in the latest quarter.
Micron is an amazing business ranking highly on our list. To begin with, its revenue growth was impressive over the last five years, and its growth over the next 12 months is expected to accelerate. And while its low free cash flow margins give it little breathing room, its astounding EPS growth over the last five years shows its profits are trickling down to shareholders. On top of that, Micron’s projected EPS for the next year implies the company’s fundamentals will improve.
Micron’s P/E ratio based on the next 12 months is 10.3x. Scanning the semiconductor space today, Micron’s fundamentals really stand out, and we like it at this price.
Wall Street analysts have a consensus one-year price target of $354.21 on the company (compared to the current share price of $399.34).