Nordson (NDSN)
We’re wary of Nordson. Its weak sales growth and declining returns on capital show its demand and profits are shrinking.― StockStory Analyst Team
1. News


2. Summary
Why We Think Nordson Will Underperform
Founded in 1954, Nordson Corporation (NASDAQ:NDSN) manufactures dispensing equipment and industrial adhesives, sealants and coatings.
- Organic revenue growth fell short of our benchmarks over the past two years and implies it may need to improve its products, pricing, or go-to-market strategy
- Estimated sales growth of 4.6% for the next 12 months is soft and implies weaker demand
- A positive is that its offerings are difficult to replicate at scale and result in a best-in-class gross margin of 55.1%


Nordson doesn’t live up to our standards. More profitable opportunities exist elsewhere.
Why There Are Better Opportunities Than Nordson


Nordson is trading at $243.83 per share, or 20.9x forward P/E. This multiple is lower than most industrials companies, but for good reason.
We’d rather pay up for companies with elite fundamentals than get a bargain on weak ones. Cheap stocks can be value traps, and as their performance deteriorates, they will stay cheap or get even cheaper.
3. Nordson (NDSN) Research Report: Q3 CY2025 Update
Manufacturing company Nordson (NASDAQ:NDSN) fell short of the markets revenue expectations in Q3 CY2025, with sales flat year on year at $751.8 million. Next quarter’s revenue guidance of $650 million underwhelmed, coming in 0.9% below analysts’ estimates. Its non-GAAP profit of $3.03 per share was 3.4% above analysts’ consensus estimates.
Nordson (NDSN) Q3 CY2025 Highlights:
- Revenue: $751.8 million vs analyst estimates of $761.8 million (flat year on year, 1.3% miss)
- Adjusted EPS: $3.03 vs analyst estimates of $2.93 (3.4% beat)
- Adjusted EBITDA: $255.8 million vs analyst estimates of $246.7 million (34% margin, 3.7% beat)
- Revenue Guidance for Q4 CY2025 is $650 million at the midpoint, below analyst estimates of $656 million
- Adjusted EPS guidance for the upcoming financial year 2026 is $11.15 at the midpoint, beating analyst estimates by 0.6%
- Operating Margin: 28.5%, up from 24% in the same quarter last year
- Free Cash Flow Margin: 25.8%, up from 10.2% in the same quarter last year
- Organic Revenue fell 1.1% year on year vs analyst estimates of flat growth (101.5 basis point miss)
- Market Capitalization: $13.12 billion
Company Overview
Founded in 1954, Nordson Corporation (NASDAQ:NDSN) manufactures dispensing equipment and industrial adhesives, sealants and coatings.
Nordson Corporation was established by brothers Eric and Evan Nord, evolving from the U.S. Automatic Company, which began in 1909. Initially focusing on screw machine parts for the automotive industry, the company shifted to producing high-precision parts during World War II. Post-war, the brothers sought a proprietary product, finding it in the "hot airless" method of spraying paint, leading to the creation of Nordson as a division of U.S. Automatic Corporation.
In 1966, U.S. Automatic merged into Nordson Corporation, continuing its development of spray painting and powder coating technologies. In 1986, Nordson acquired companies such as Industriell Coating Aktiebolag and Meltex, enhancing its adhesive dispensing capabilities. The company expanded into high technology and electronics industries in the late 1990s, acquiring firms such as Asymtek and EFD, which are integral to Nordson’s Advanced Technology segment today. In the 2010s, Nordson strengthened its position in precision technology and entered the medical, test and inspection, and polymer processing areas through acquisitions, including Micromedics and Value Plastics.
Today, Nordson Corporation produces a variety of advanced products and systems that serve diverse industries. Its offerings range from precision dispensing equipment and coating systems for the electronics and packaging sectors to medical devices such as catheters and medical tubing for the healthcare industry. The company generates revenue from the sale of these products, as well as from contracts for related software, maintenance services, and aftermarket parts, which generate a source of recurring revenue.
The company continues an acquisition strategy of selectively focusing on companies that offer strong operational value and enhance its product. For instance, in August 2023, Nordson acquired the ARAG Group, a leader in precision control systems and smart fluid components for agricultural spraying. This strategic acquisition aligns with Nordson’s objective to enhance its offerings in precision technology and expand its presence in the growing agriculture market.
4. Professional Tools and Equipment
Automation that increases efficiency and connected equipment that collects analyzable data have been trending, creating new demand. Some professional tools and equipment companies also provide software to accompany measurement or automated machinery, adding a stream of recurring revenues to their businesses. On the other hand, professional tools and equipment companies are at the whim of economic cycles. Consumer spending and interest rates, for example, can greatly impact the industrial production that drives demand for these companies’ offerings.
Competitors offering similar products include Graco (NYSE:GGG), Illinois Tool Works (NYSE:ITW), and Sono-Tek (OTCMKTS: SOTK).
5. Revenue Growth
A company’s long-term sales performance is one signal of its overall quality. Even a bad business can shine for one or two quarters, but a top-tier one grows for years. Regrettably, Nordson’s sales grew at a tepid 5.6% compounded annual growth rate over the last five years. This fell short of our benchmark for the industrials sector and is a rough starting point for our analysis.
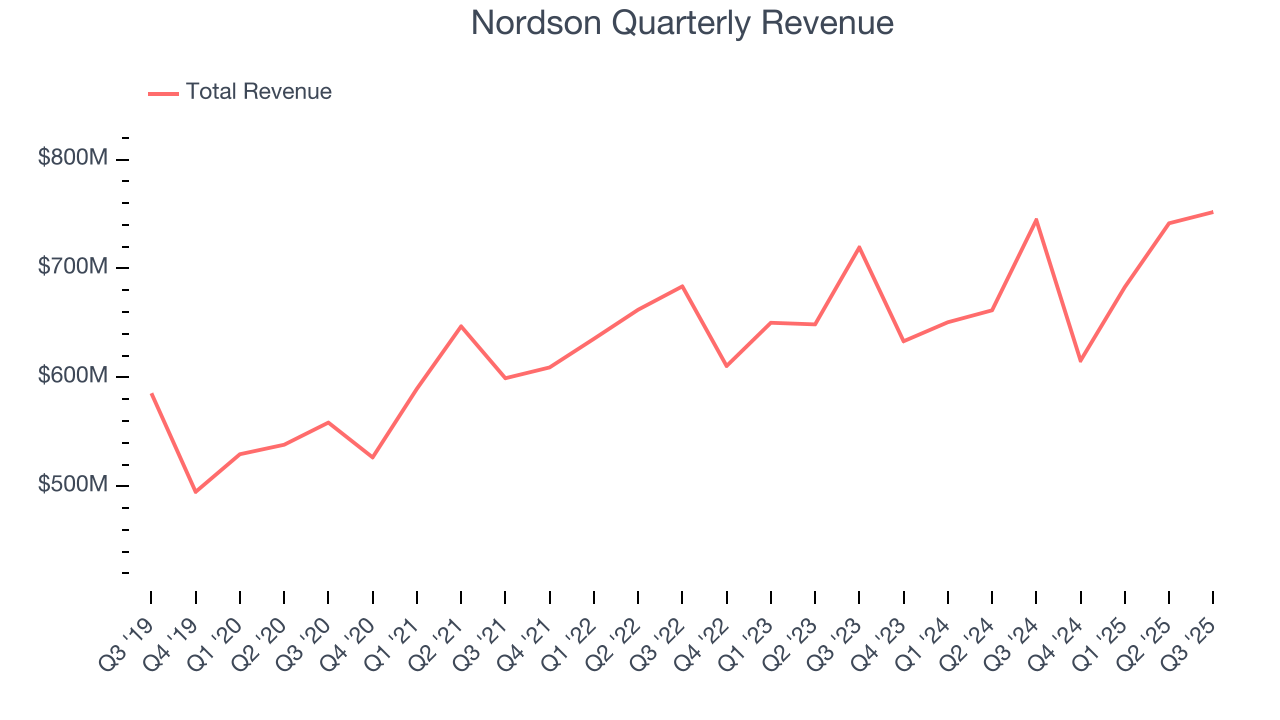
We at StockStory place the most emphasis on long-term growth, but within industrials, a half-decade historical view may miss cycles, industry trends, or a company capitalizing on catalysts such as a new contract win or a successful product line. Nordson’s recent performance shows its demand has slowed as its annualized revenue growth of 3.1% over the last two years was below its five-year trend. 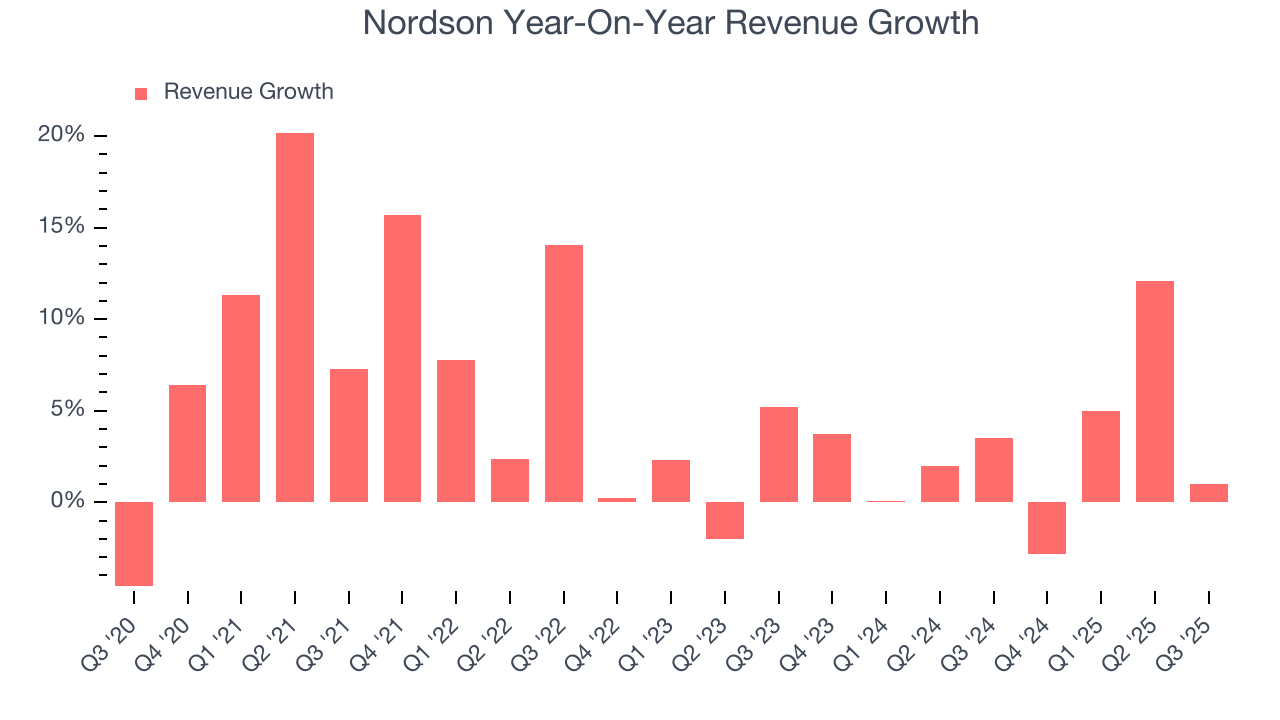
We can dig further into the company’s sales dynamics by analyzing its organic revenue, which strips out one-time events like acquisitions and currency fluctuations that don’t accurately reflect its fundamentals. Over the last two years, Nordson’s organic revenue averaged 2.6% year-on-year declines. Because this number is lower than its two-year revenue growth, we can see that some mixture of acquisitions and foreign exchange rates boosted its headline results. 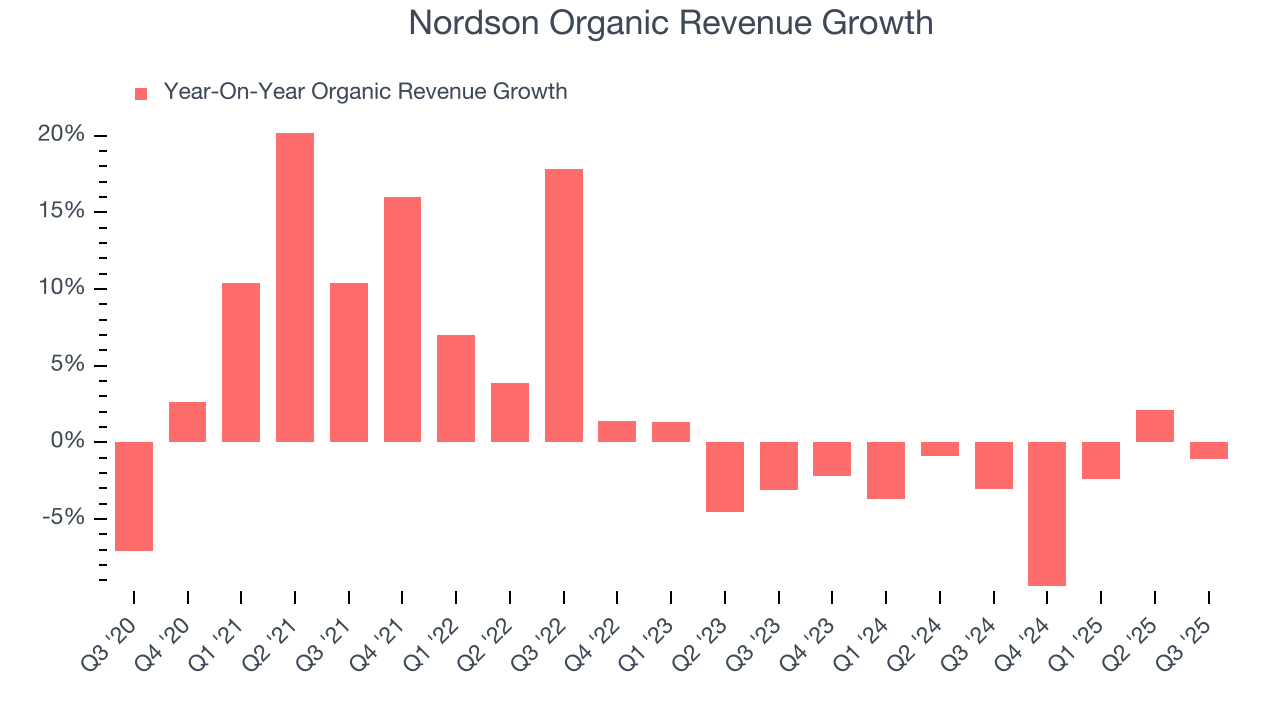
This quarter, Nordson’s $751.8 million of revenue was flat year on year, falling short of Wall Street’s estimates. Company management is currently guiding for a 5.6% year-on-year increase in sales next quarter.
Looking further ahead, sell-side analysts expect revenue to grow 4.6% over the next 12 months. While this projection implies its newer products and services will catalyze better top-line performance, it is still below the sector average.
6. Gross Margin & Pricing Power
Nordson has best-in-class unit economics for an industrials company, enabling it to invest in areas such as research and development. Its margin also signals it sells differentiated products, not commodities. As you can see below, it averaged an elite 55.1% gross margin over the last five years. Said differently, roughly $55.13 was left to spend on selling, marketing, R&D, and general administrative overhead for every $100 in revenue. 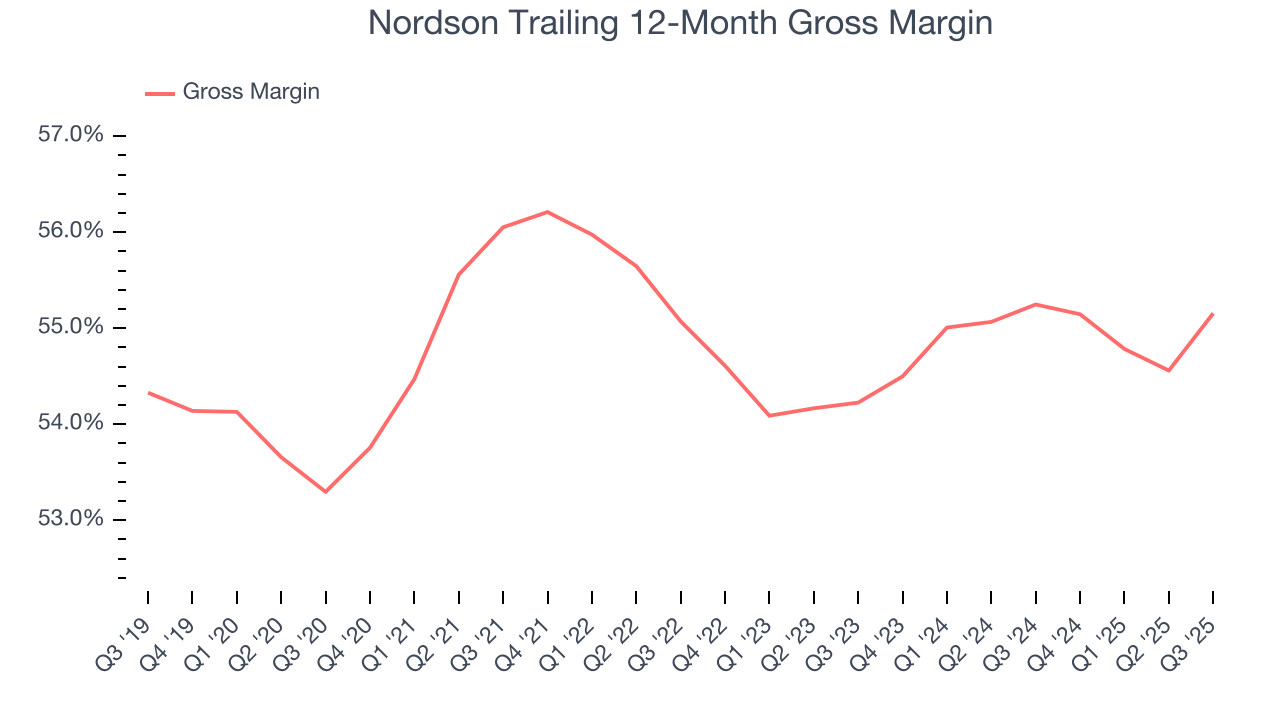
This quarter, Nordson’s gross profit margin was 56.3%, up 2.2 percentage points year on year. On a wider time horizon, the company’s full-year margin has remained steady over the past four quarters, suggesting its input costs (such as raw materials and manufacturing expenses) have been stable and it isn’t under pressure to lower prices.
7. Operating Margin
Operating margin is one of the best measures of profitability because it tells us how much money a company takes home after procuring and manufacturing its products, marketing and selling those products, and most importantly, keeping them relevant through research and development.
Nordson’s operating margin might fluctuated slightly over the last 12 months but has generally stayed the same, averaging 25.8% over the last five years. This profitability was elite for an industrials business thanks to its efficient cost structure and economies of scale. This result isn’t surprising as its high gross margin gives it a favorable starting point.
Looking at the trend in its profitability, Nordson’s operating margin might fluctuated slightly but has generally stayed the same over the last five years. This raises questions about the company’s expense base because its revenue growth should have given it leverage on its fixed costs, resulting in better economies of scale and profitability.
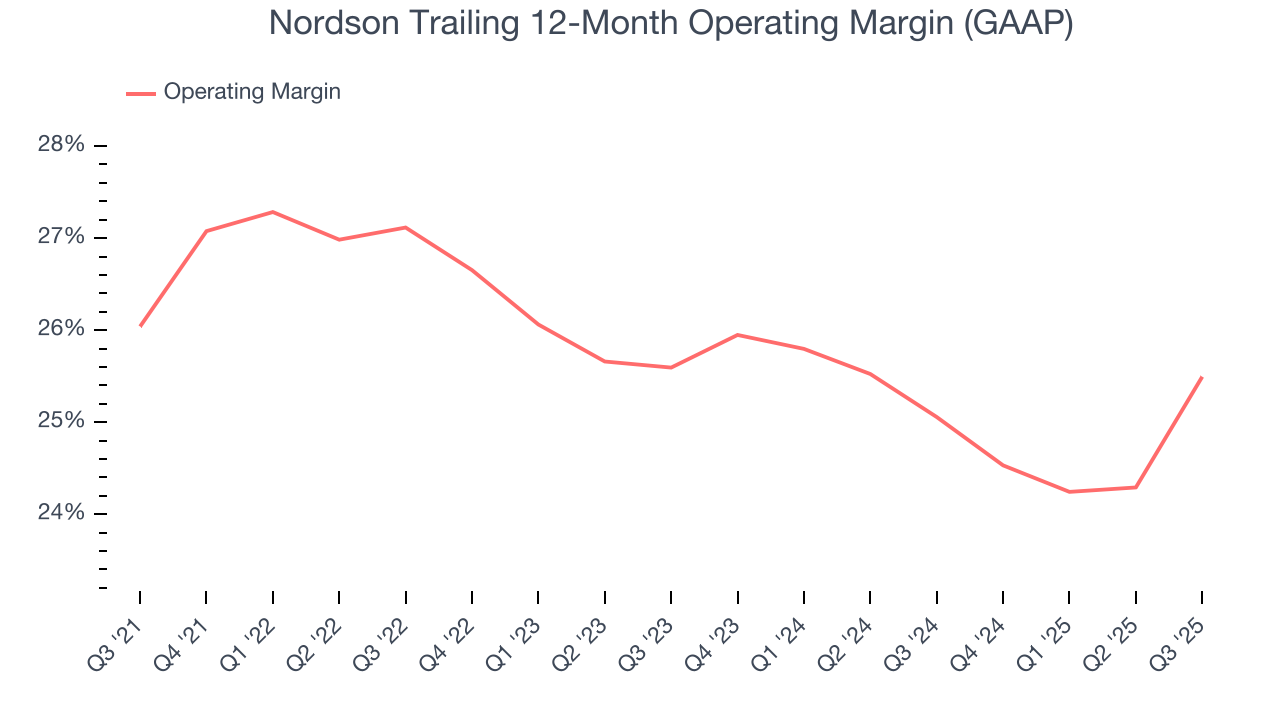
This quarter, Nordson generated an operating margin profit margin of 28.5%, up 4.5 percentage points year on year. The increase was encouraging, and because its operating margin rose more than its gross margin, we can infer it was more efficient with expenses such as marketing, R&D, and administrative overhead.
8. Earnings Per Share
Revenue trends explain a company’s historical growth, but the long-term change in earnings per share (EPS) points to the profitability of that growth – for example, a company could inflate its sales through excessive spending on advertising and promotions.
Nordson’s EPS grew at a solid 11.8% compounded annual growth rate over the last five years, higher than its 5.6% annualized revenue growth. This tells us the company became more profitable on a per-share basis as it expanded.
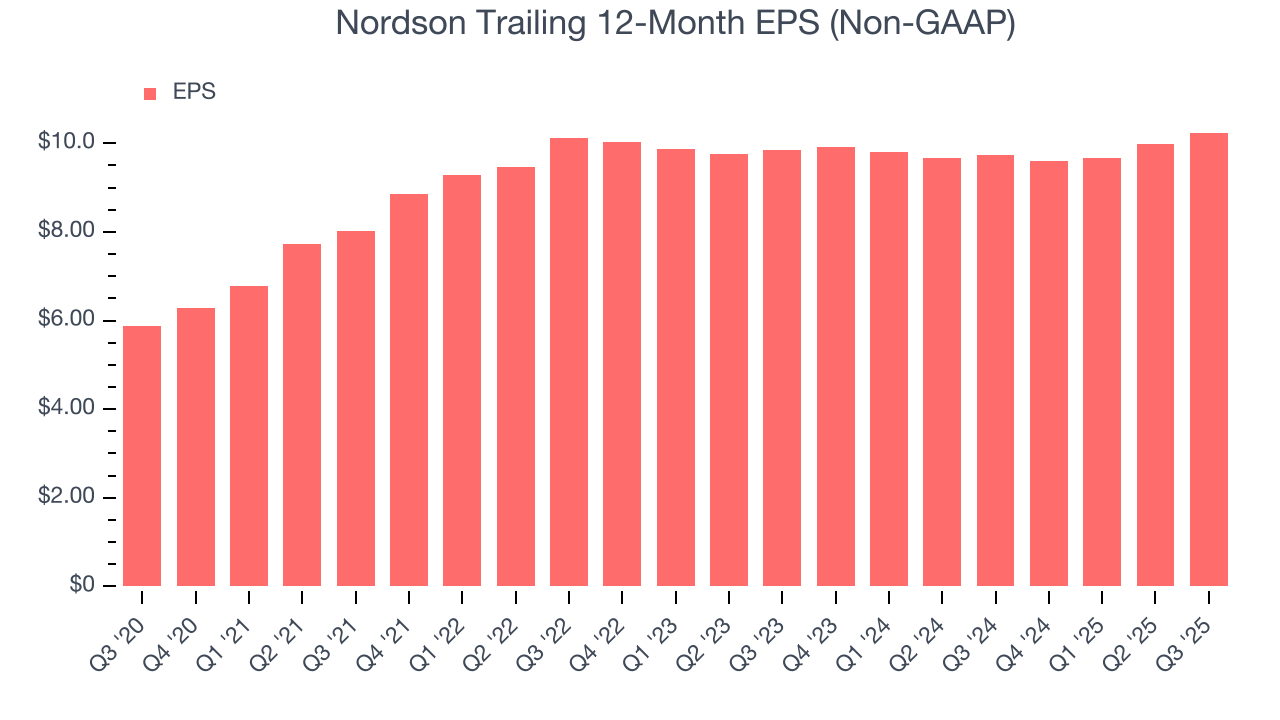
Diving into Nordson’s quality of earnings can give us a better understanding of its performance. A five-year view shows that Nordson has repurchased its stock, shrinking its share count by 3.9%. This tells us its EPS outperformed its revenue not because of increased operational efficiency but financial engineering, as buybacks boost per share earnings. 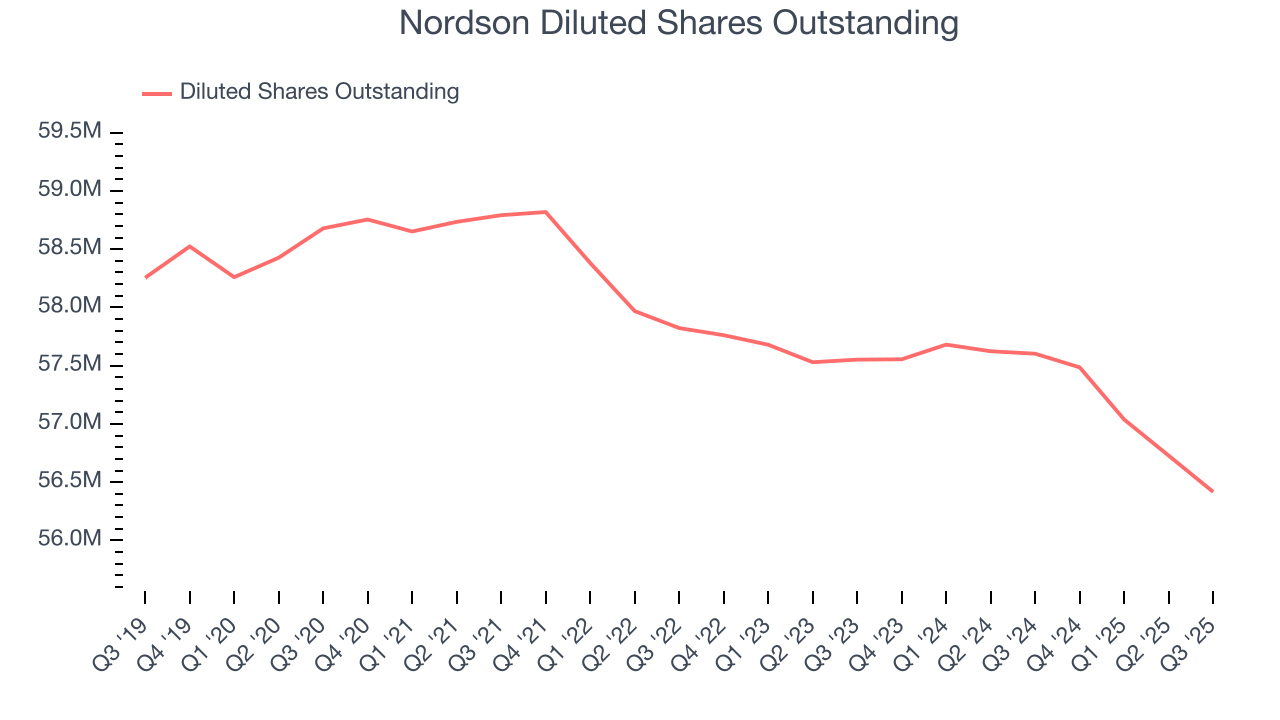
Like with revenue, we analyze EPS over a shorter period to see if we are missing a change in the business.
For Nordson, its two-year annual EPS growth of 2% was lower than its five-year trend. We hope its growth can accelerate in the future.
In Q3, Nordson reported adjusted EPS of $3.03, up from $2.78 in the same quarter last year. This print beat analysts’ estimates by 3.4%. Over the next 12 months, Wall Street expects Nordson’s full-year EPS of $10.24 to grow 8.9%.
9. Cash Is King
Free cash flow isn't a prominently featured metric in company financials and earnings releases, but we think it's telling because it accounts for all operating and capital expenses, making it tough to manipulate. Cash is king.
Nordson has shown terrific cash profitability, putting it in an advantageous position to invest in new products, return capital to investors, and consolidate the market during industry downturns. The company’s free cash flow margin was among the best in the industrials sector, averaging 20.9% over the last five years.
Taking a step back, we can see that Nordson’s margin expanded by 2.2 percentage points during that time. This shows the company is heading in the right direction, and we can see it became a less capital-intensive business because its free cash flow profitability rose while its operating profitability was flat.
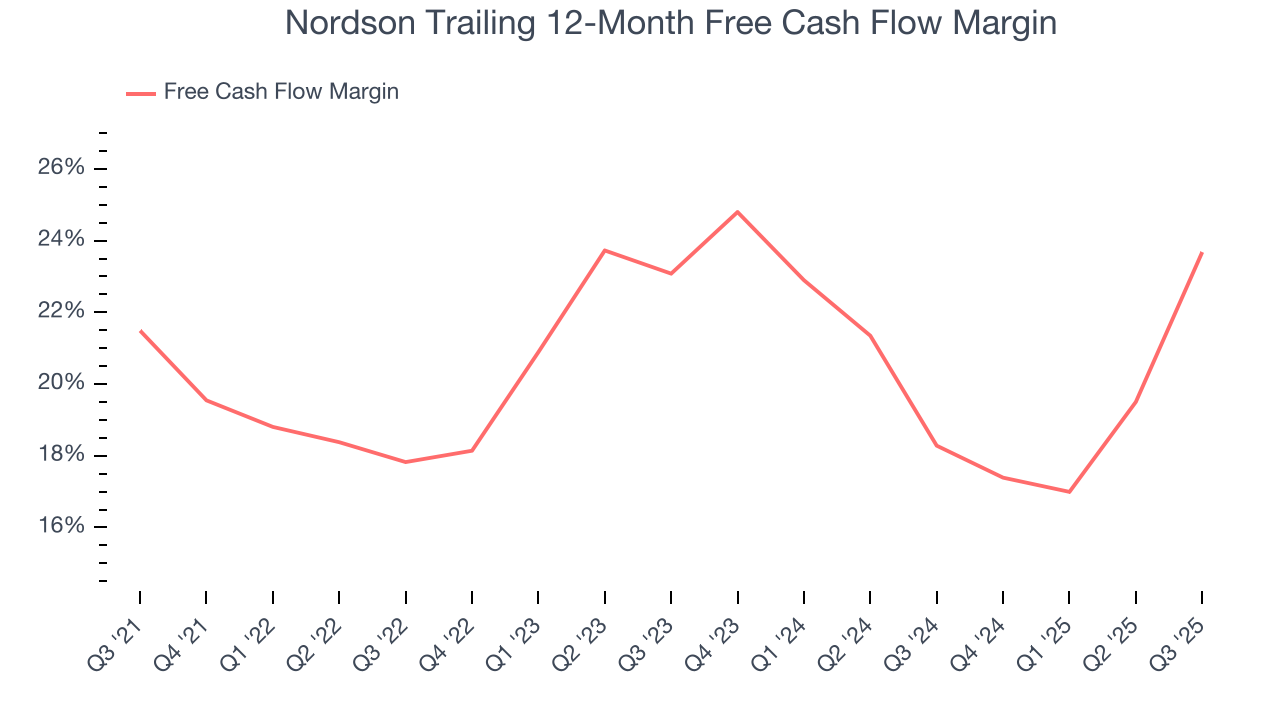
Nordson’s free cash flow clocked in at $193.9 million in Q3, equivalent to a 25.8% margin. This result was good as its margin was 15.6 percentage points higher than in the same quarter last year, building on its favorable historical trend.
10. Return on Invested Capital (ROIC)
EPS and free cash flow tell us whether a company was profitable while growing its revenue. But was it capital-efficient? A company’s ROIC explains this by showing how much operating profit it makes compared to the money it has raised (debt and equity).
Although Nordson hasn’t been the highest-quality company lately, it historically found a few growth initiatives that worked out well. Its five-year average ROIC was 16.1%, impressive for an industrials business.
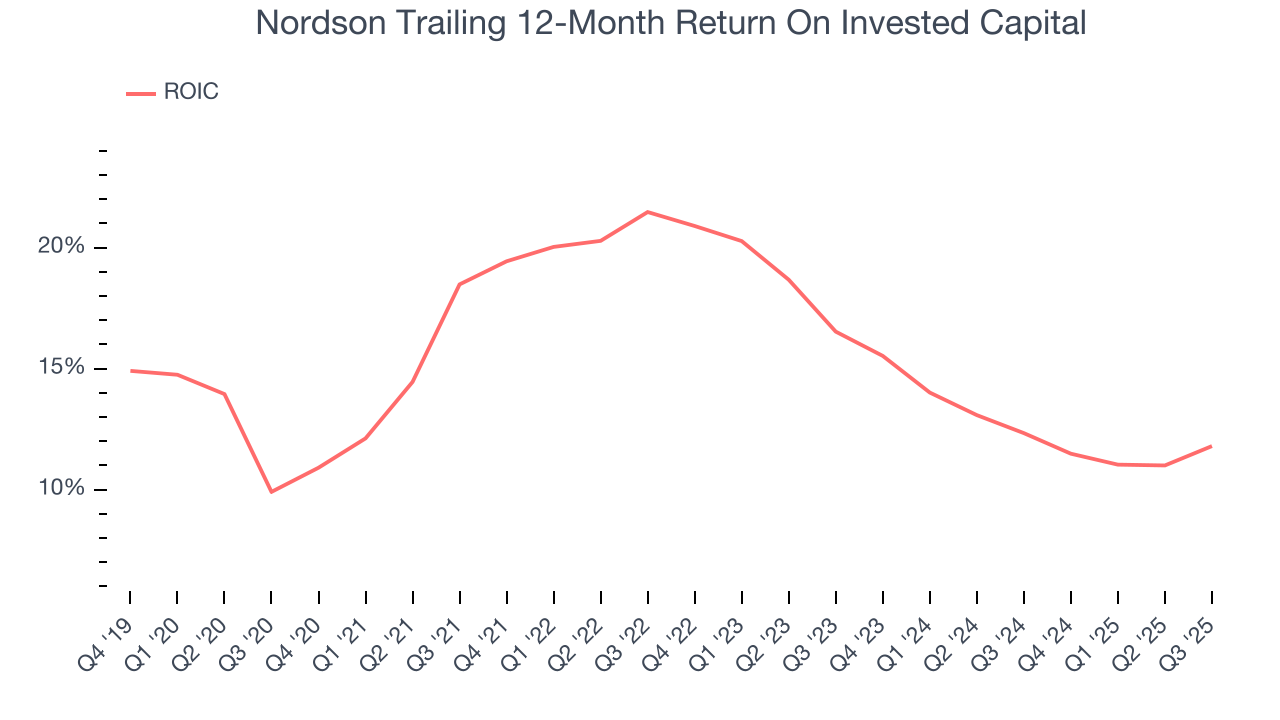
We like to invest in businesses with high returns, but the trend in a company’s ROIC is what often surprises the market and moves the stock price. Unfortunately, Nordson’s ROIC has decreased over the last few years. We like what management has done in the past, but its declining returns are perhaps a symptom of fewer profitable growth opportunities.
11. Balance Sheet Assessment
Nordson reported $108.4 million of cash and $2.00 billion of debt on its balance sheet in the most recent quarter. As investors in high-quality companies, we primarily focus on two things: 1) that a company’s debt level isn’t too high and 2) that its interest payments are not excessively burdening the business.
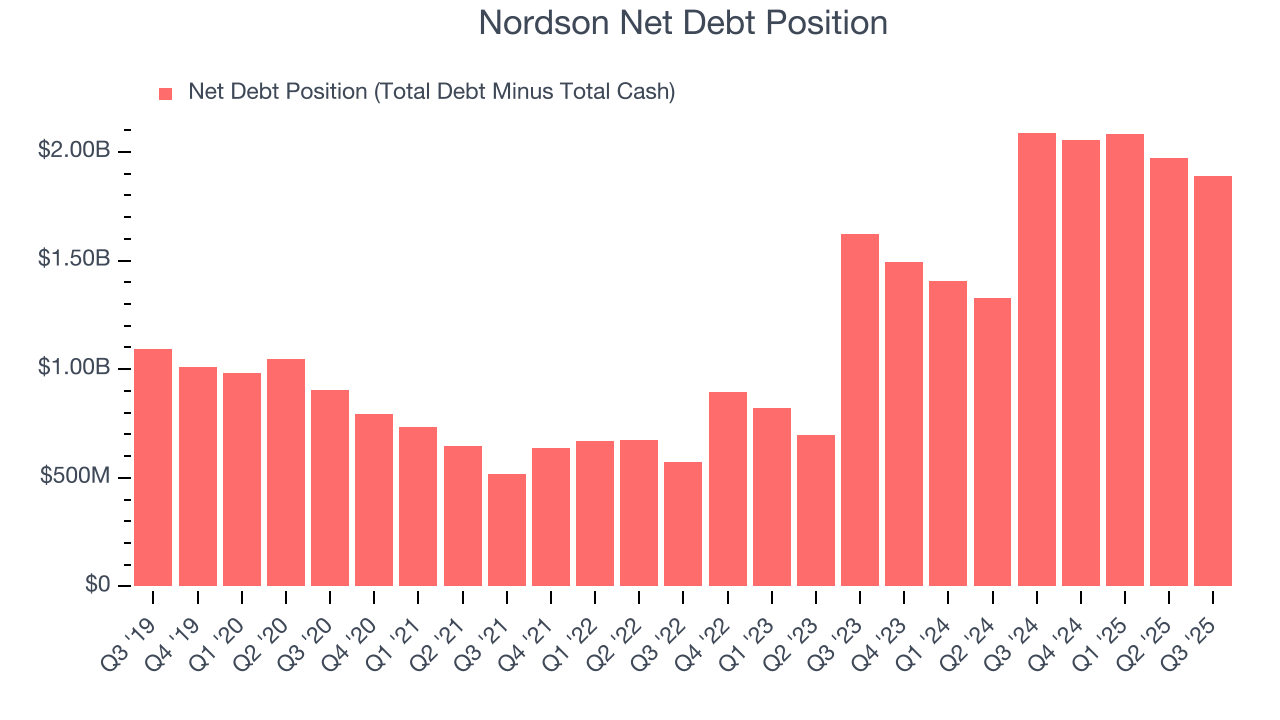
With $899.5 million of EBITDA over the last 12 months, we view Nordson’s 2.1× net-debt-to-EBITDA ratio as safe. We also see its $101.1 million of annual interest expenses as appropriate. The company’s profits give it plenty of breathing room, allowing it to continue investing in growth initiatives.
12. Key Takeaways from Nordson’s Q3 Results
It was encouraging to see Nordson beat analysts’ EBITDA expectations this quarter. We were also glad its full-year EPS guidance slightly exceeded Wall Street’s estimates. On the other hand, its revenue slightly missed and its full-year revenue guidance fell slightly short of Wall Street’s estimates. Overall, this was a mixed quarter. The stock traded up 1.4% to $239.33 immediately following the results.
13. Is Now The Time To Buy Nordson?
Updated: December 10, 2025 at 10:31 PM EST
The latest quarterly earnings matters, sure, but we actually think longer-term fundamentals and valuation matter more. Investors should consider all these pieces before deciding whether or not to invest in Nordson.
Nordson isn’t a terrible business, but it doesn’t pass our bar. First off, its revenue growth was uninspiring over the last five years, and analysts expect its demand to deteriorate over the next 12 months. And while its admirable gross margins indicate the mission-critical nature of its offerings, the downside is its diminishing returns show management's prior bets haven't worked out. On top of that, its organic revenue declined.
Nordson’s P/E ratio based on the next 12 months is 20.9x. While this valuation is reasonable, we don’t really see a big opportunity at the moment. We're pretty confident there are more exciting stocks to buy at the moment.
Wall Street analysts have a consensus one-year price target of $257.30 on the company (compared to the current share price of $243.83).