
ThredUp (TDUP)
We wouldn’t recommend ThredUp. Not only has its sales growth been weak but also its negative returns on capital show it destroyed value.― StockStory Analyst Team
1. News


2. Summary
Why We Think ThredUp Will Underperform
Founded to revolutionize thrifting, ThredUp (NASDAQ:TDUP) is a leading online fashion resale marketplace offering a wide selection of gently-used clothing and accessories.
- Annual revenue growth of 9.8% over the last five years was below our standards for the consumer discretionary sector
- Suboptimal cost structure is highlighted by its history of operating margin losses
- Negative free cash flow raises questions about the return timeline for its investments


ThredUp’s quality doesn’t meet our hurdle. There are better opportunities in the market.
Why There Are Better Opportunities Than ThredUp


ThredUp’s stock price of $5.19 implies a valuation ratio of 42.4x forward EV-to-EBITDA. The current multiple is quite expensive, especially for the tepid revenue growth.
There are stocks out there featuring similar valuation multiples with better fundamentals. We prefer to invest in those.
3. ThredUp (TDUP) Research Report: Q3 CY2025 Update
Online fashion resale marketplace ThredUp (NASDAQ:TDUP) reported Q3 CY2025 results beating Wall Street’s revenue expectations, with sales up 33.6% year on year to $82.16 million. On top of that, next quarter’s revenue guidance ($77 million at the midpoint) was surprisingly good and 3.2% above what analysts were expecting. Its GAAP loss of $0.03 per share was $0.01 above analysts’ consensus estimates.
ThredUp (TDUP) Q3 CY2025 Highlights:
- Revenue: $82.16 million vs analyst estimates of $77.61 million (33.6% year-on-year growth, 5.9% beat)
- EPS (GAAP): -$0.03 vs analyst estimates of -$0.04 ($0.01 beat)
- Adjusted EBITDA: $3.77 million vs analyst estimates of $3.5 million (4.6% margin, relatively in line)
- Revenue Guidance for Q4 CY2025 is $77 million at the midpoint, above analyst estimates of $74.59 million
- Operating Margin: -5.3%, up from -17% in the same quarter last year
- Free Cash Flow Margin: 2.9%, similar to the same quarter last year
- Orders: 1.57 million, up 398,000 year on year
- Market Capitalization: $1.08 billion
Company Overview
Founded to revolutionize thrifting, ThredUp (NASDAQ:TDUP) is a leading online fashion resale marketplace offering a wide selection of gently-used clothing and accessories.
The company addresses a large problem in fashion: people often have wardrobes filled with items they rarely wear. ThredUp solves this by creating a market to buy and sell used fashion goods, promoting a circular fashion economy that minimizes waste and reduces the environmental footprint of the industry.
Given the used nature of products listed on its marketplace, the company places a strong emphasis on quality control. Every item is inspected to ensure secondhand shopping on its platform is as reliable as buying new. Combined with a user-friendly interface and transparent pricing, ThredUp makes the thrifting experience accessible and convenient.
The company generates revenue by charging sellers a commission or processing fee for each item they sell on the platform. This fee varies depending on the selling price of the item, typically ranging from 5% to 20% of the sale price.
4. Apparel and Accessories
Thanks to social media and the internet, not only are styles changing more frequently today than in decades past but also consumers are shifting the way they buy their goods, favoring omnichannel and e-commerce experiences. Some apparel and accessories companies have made concerted efforts to adapt while those who are slower to move may fall behind.
ThredUp’s main competitors are Poshmark (owned by Naver Corporation, KRX:035420), The RealReal (NASDAQ:REAL), Depop (owned by Etsy NASDAQ:ETSY), and Mercari (OTCMKTS:MCARY).
5. Revenue Growth
A company’s long-term sales performance is one signal of its overall quality. Any business can put up a good quarter or two, but many enduring ones grow for years. Over the last five years, ThredUp grew its sales at a tepid 9.8% compounded annual growth rate. This was below our standard for the consumer discretionary sector and is a rough starting point for our analysis.
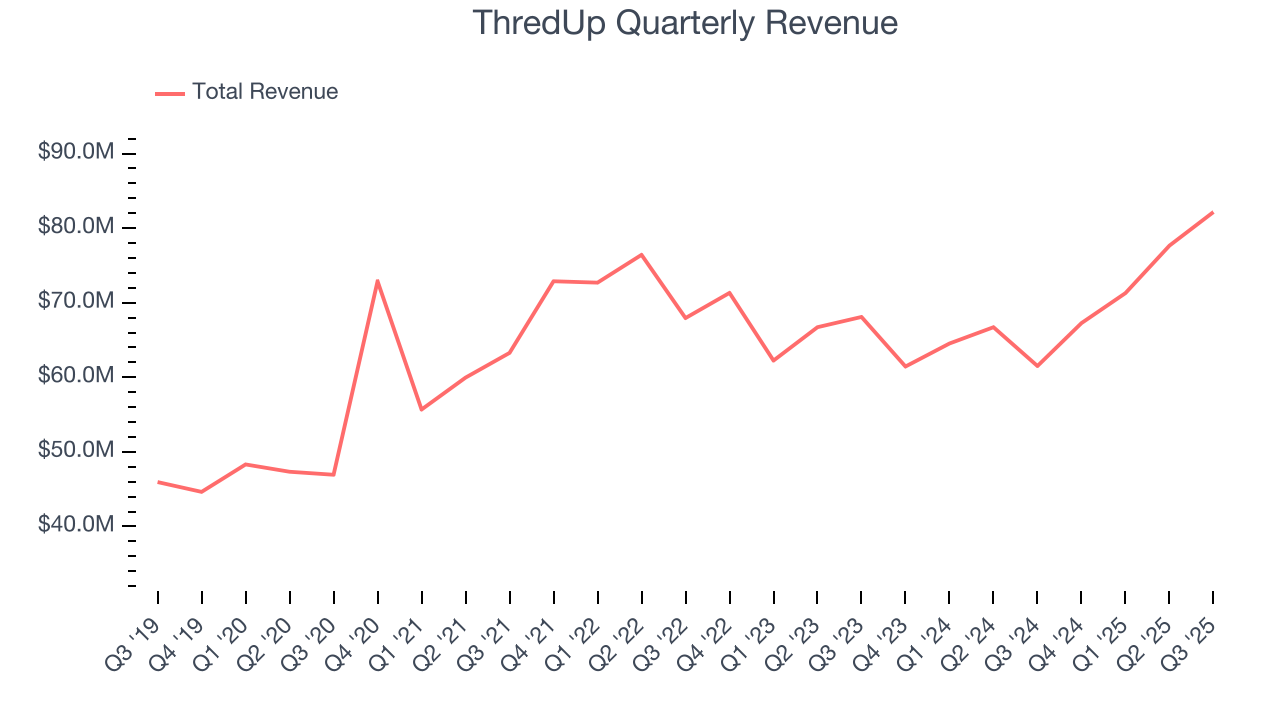
We at StockStory place the most emphasis on long-term growth, but within consumer discretionary, a stretched historical view may miss a company riding a successful new product or trend. ThredUp’s recent performance shows its demand has slowed as its annualized revenue growth of 5.4% over the last two years was below its five-year trend. 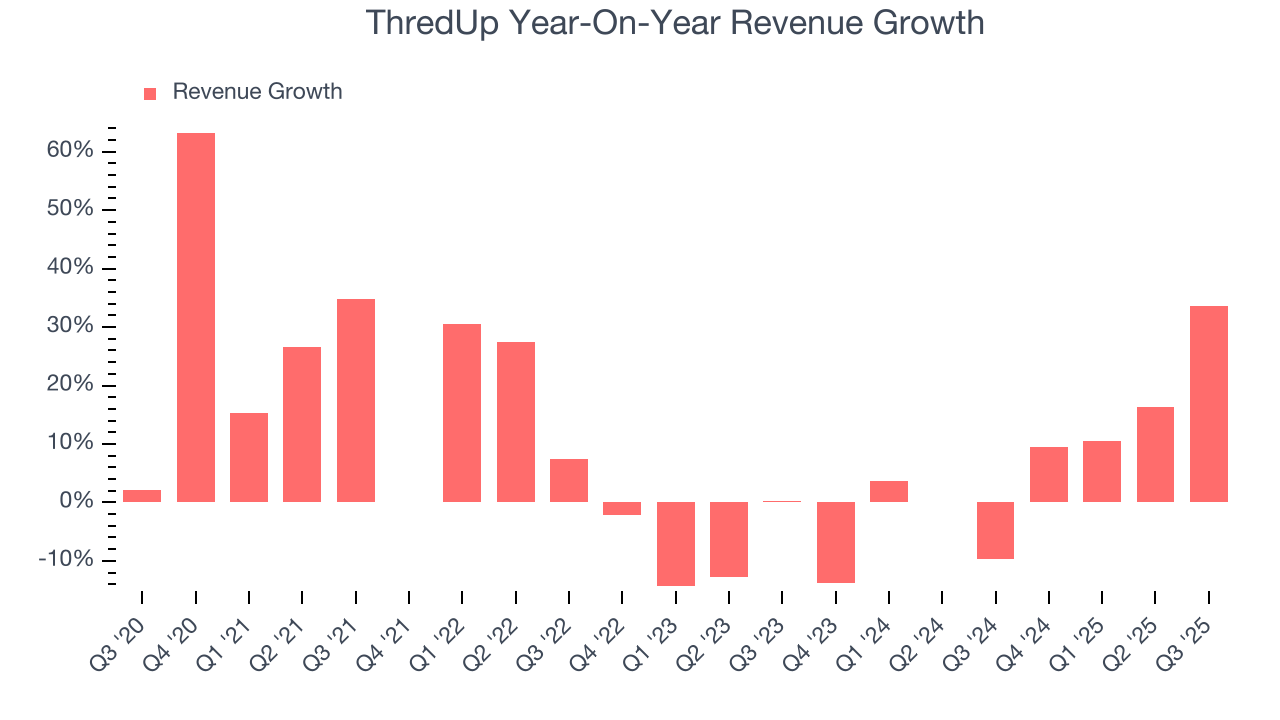
ThredUp also discloses its number of orders, which reached 1.57 million in the latest quarter. Over the last two years, ThredUp’s orders averaged 6% year-on-year growth. Because this number aligns with its revenue growth during the same period, we can see the company’s monetization was fairly consistent. 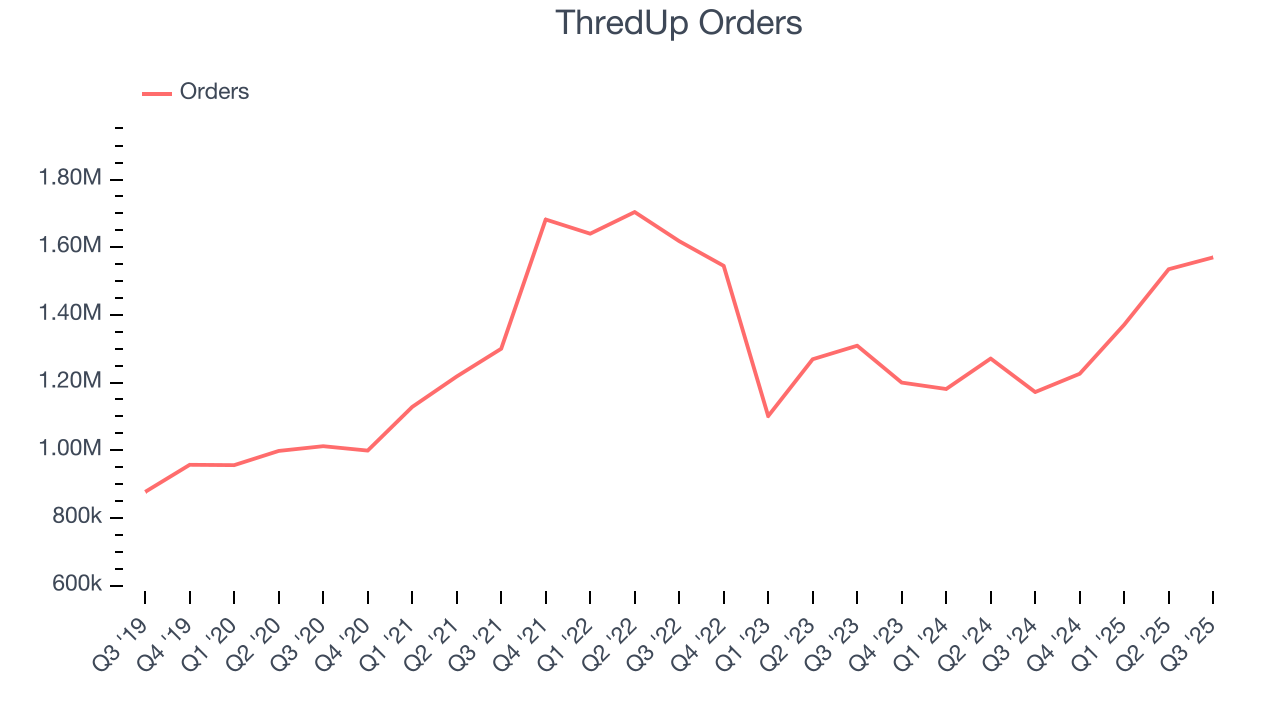
This quarter, ThredUp reported wonderful year-on-year revenue growth of 33.6%, and its $82.16 million of revenue exceeded Wall Street’s estimates by 5.9%. Company management is currently guiding for a 14.5% year-on-year increase in sales next quarter.
Looking further ahead, sell-side analysts expect revenue to grow 8.6% over the next 12 months. While this projection indicates its newer products and services will catalyze better top-line performance, it is still below average for the sector.
6. Operating Margin
ThredUp’s operating margin has been trending up over the last 12 months, but it still averaged negative 11.6% over the last two years. This is due to its large expense base and inefficient cost structure.
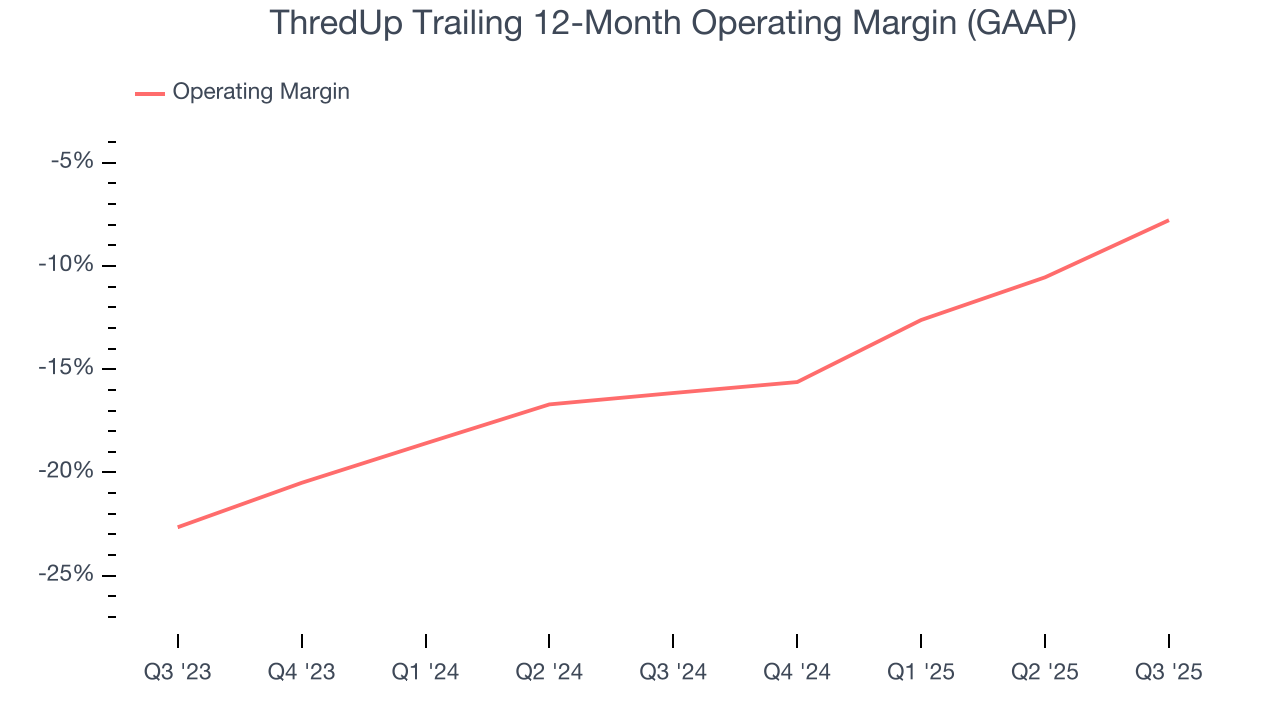
This quarter, ThredUp generated a negative 5.3% operating margin. The company's consistent lack of profits raise a flag.
7. Earnings Per Share
We track the long-term change in earnings per share (EPS) for the same reason as long-term revenue growth. Compared to revenue, however, EPS highlights whether a company’s growth is profitable.
Although ThredUp’s full-year earnings are still negative, it reduced its losses and improved its EPS by 41.3% annually over the last five years. The next few quarters will be critical for assessing its long-term profitability.
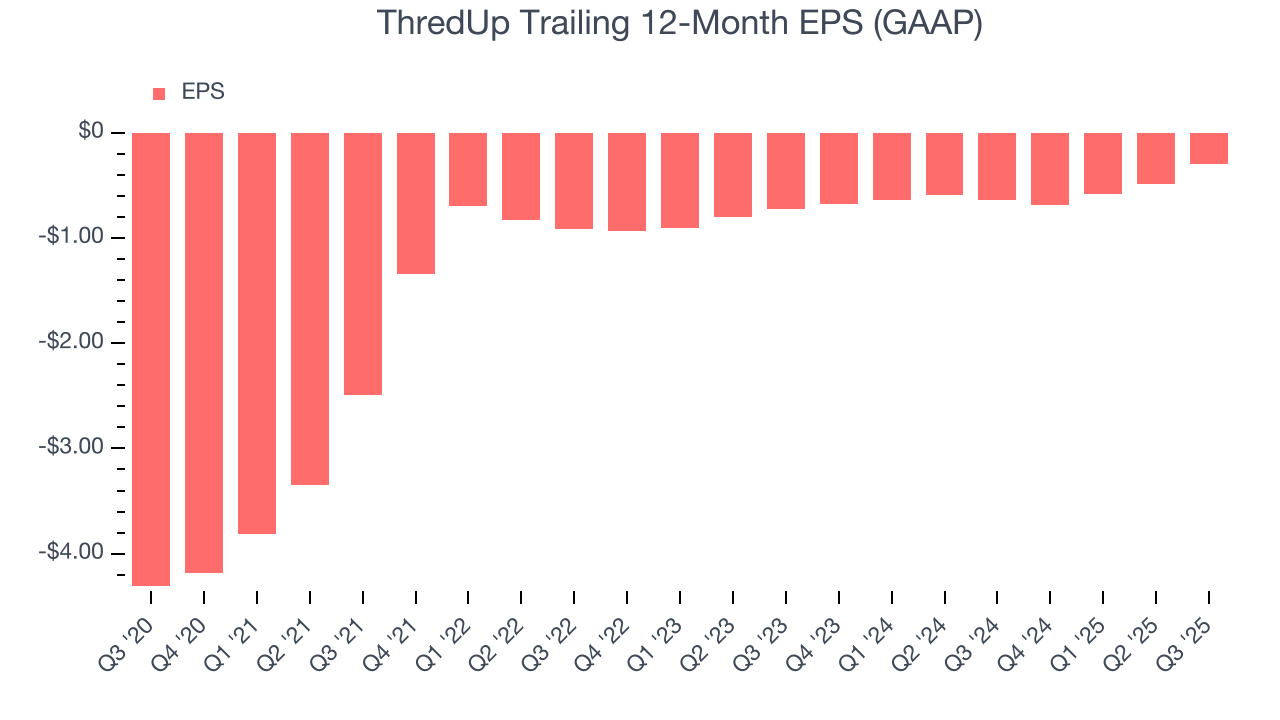
In Q3, ThredUp reported EPS of negative $0.03, up from negative $0.22 in the same quarter last year. This print easily cleared analysts’ estimates, and shareholders should be content with the results. Over the next 12 months, Wall Street expects ThredUp to improve its earnings losses. Analysts forecast its full-year EPS of negative $0.30 will advance to negative $0.10.
8. Cash Is King
Free cash flow isn't a prominently featured metric in company financials and earnings releases, but we think it's telling because it accounts for all operating and capital expenses, making it tough to manipulate. Cash is king.
While ThredUp posted positive free cash flow this quarter, the broader story hasn’t been so clean. Over the last two years, ThredUp’s demanding reinvestments to stay relevant have drained its resources, putting it in a pinch and limiting its ability to return capital to investors. Its free cash flow margin averaged negative 1.5%, meaning it lit $1.54 of cash on fire for every $100 in revenue.
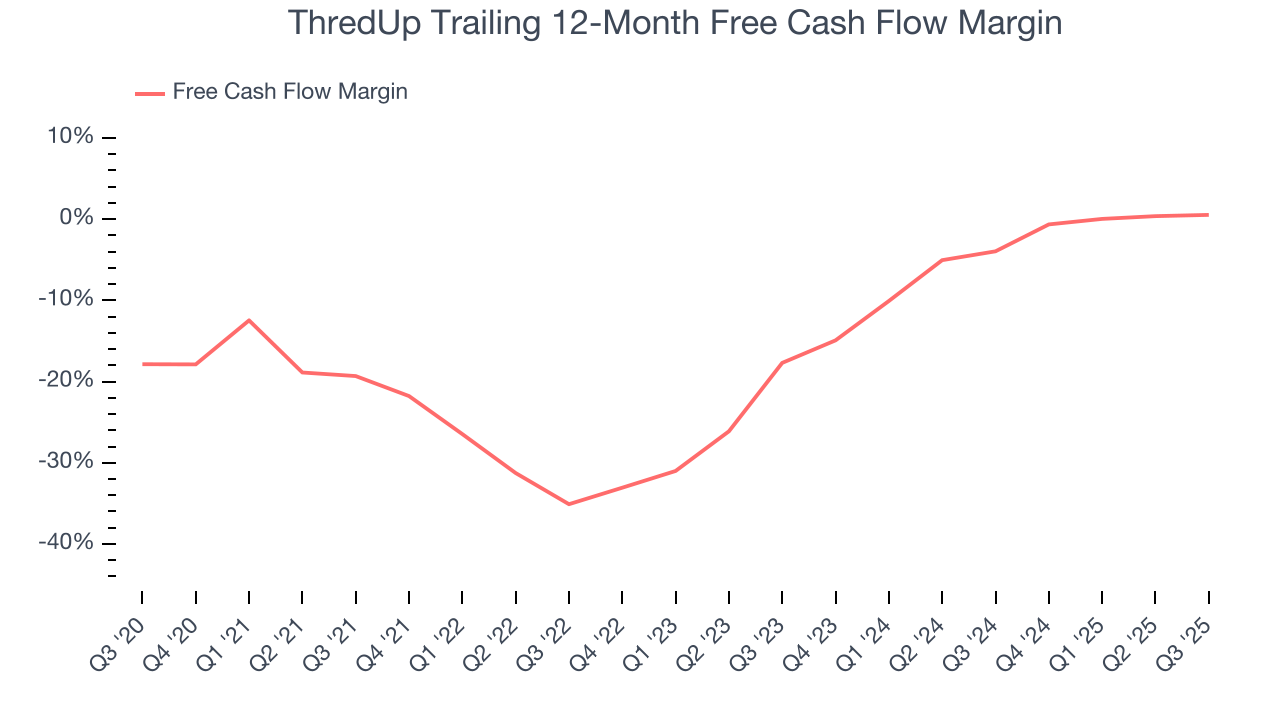
ThredUp’s free cash flow clocked in at $2.38 million in Q3, equivalent to a 2.9% margin. This cash profitability was in line with the comparable period last year and above its two-year average.
Over the next year, analysts predict ThredUp’s cash conversion will improve. Their consensus estimates imply its breakeven free cash flow margin for the last 12 months will increase to 5.9%, giving it more optionality.
9. Return on Invested Capital (ROIC)
EPS and free cash flow tell us whether a company was profitable while growing its revenue. But was it capital-efficient? Enter ROIC, a metric showing how much operating profit a company generates relative to the money it has raised (debt and equity).
ThredUp’s five-year average ROIC was negative 54.1%, meaning management lost money while trying to expand the business. Its returns were among the worst in the consumer discretionary sector.
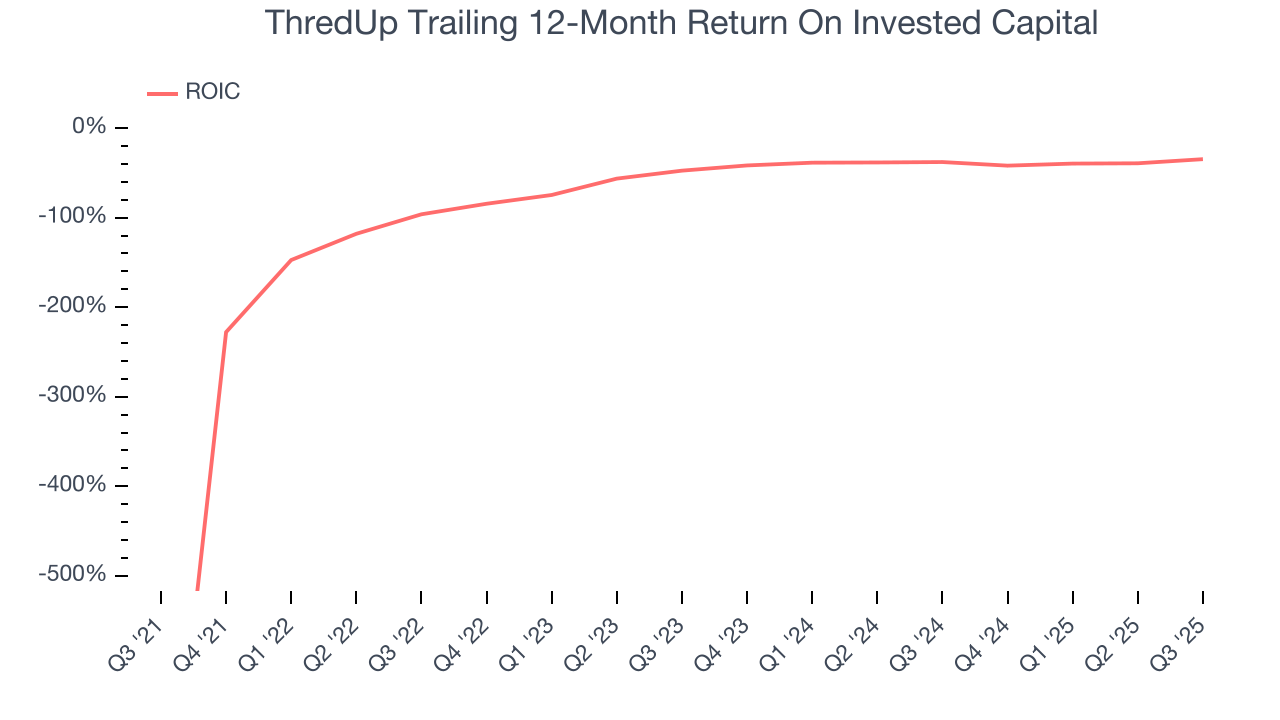
We like to invest in businesses with high returns, but the trend in a company’s ROIC is what often surprises the market and moves the stock price. Over the last few years, ThredUp’s ROIC has increased. This is a good sign, but we recognize its lack of profitable growth during the COVID era was the primary reason for the change.
10. Balance Sheet Assessment
ThredUp reported $51.11 million of cash and $54.3 million of debt on its balance sheet in the most recent quarter. As investors in high-quality companies, we primarily focus on two things: 1) that a company’s debt level isn’t too high and 2) that its interest payments are not excessively burdening the business.
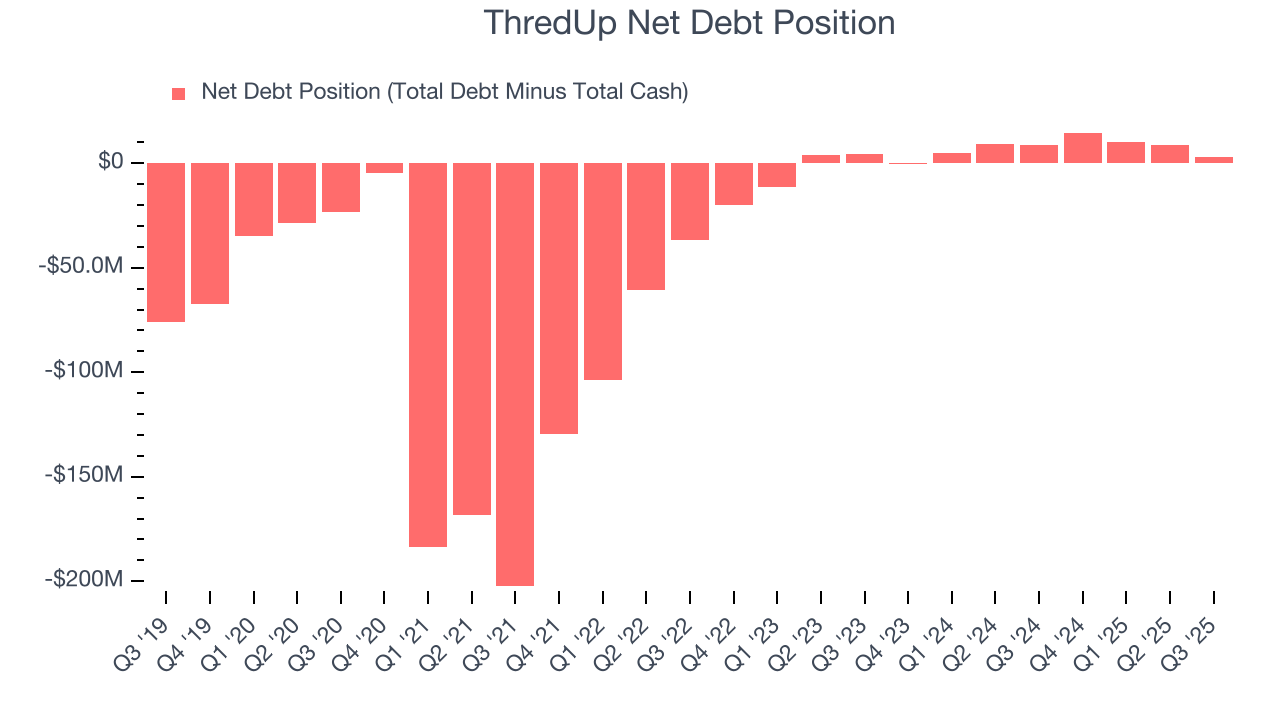
With $15.59 million of EBITDA over the last 12 months, we view ThredUp’s 0.2× net-debt-to-EBITDA ratio as safe. We also see its $1.1 million of annual interest expenses as appropriate. The company’s profits give it plenty of breathing room, allowing it to continue investing in growth initiatives.
11. Key Takeaways from ThredUp’s Q3 Results
It was good to see ThredUp beat analysts’ EPS expectations this quarter. We were also glad its full-year revenue guidance exceeded Wall Street’s estimates. Zooming out, we think this was a good print with some key areas of upside. The stock traded up 3.1% to $8.77 immediately after reporting.
12. Is Now The Time To Buy ThredUp?
Updated: January 24, 2026 at 9:22 PM EST
The latest quarterly earnings matters, sure, but we actually think longer-term fundamentals and valuation matter more. Investors should consider all these pieces before deciding whether or not to invest in ThredUp.
ThredUp doesn’t pass our quality test. First off, its revenue growth was weak over the last five years. And while its projected EPS for the next year implies the company’s fundamentals will improve, the downside is its number of orders has disappointed. On top of that, its relatively low ROIC suggests management has struggled to find compelling investment opportunities.
ThredUp’s EV-to-EBITDA ratio based on the next 12 months is 42.4x. This valuation tells us it’s a bit of a market darling with a lot of good news priced in - we think there are better opportunities elsewhere.
Wall Street analysts have a consensus one-year price target of $12.50 on the company (compared to the current share price of $5.19).
Although the price target is bullish, readers should exercise caution because analysts tend to be overly optimistic. The firms they work for, often big banks, have relationships with companies that extend into fundraising, M&A advisory, and other rewarding business lines. As a result, they typically hesitate to say bad things for fear they will lose out. We at StockStory do not suffer from such conflicts of interest, so we’ll always tell it like it is.