
Tenable (TENB)
We’re wary of Tenable. Its decelerating growth and inability to generate meaningful profits make us question its prospects.― StockStory Analyst Team
1. News


2. Summary
Why We Think Tenable Will Underperform
Starting with the widely-used Nessus vulnerability scanner first released in 1998, Tenable (NASDAQ:TENB) provides exposure management solutions that help organizations identify, assess, and prioritize cybersecurity vulnerabilities across their IT infrastructure and cloud environments.
- Estimated sales growth of 7% for the next 12 months implies demand will slow from its two-year trend
- Operating profits increased over the last year as the company gained some leverage on its fixed costs and became more efficient
- The good news is that its strong free cash flow margin of 25.4% gives it the option to reinvest, repurchase shares, or pay dividends


Tenable doesn’t meet our quality criteria. There are more profitable opportunities elsewhere.
Why There Are Better Opportunities Than Tenable


Tenable’s stock price of $22.45 implies a valuation ratio of 2.7x forward price-to-sales. This sure is a cheap multiple, but you get what you pay for.
We’d rather pay up for companies with elite fundamentals than get a bargain on weak ones. Cheap stocks can be value traps, and as their performance deteriorates, they will stay cheap or get even cheaper.
3. Tenable (TENB) Research Report: Q3 CY2025 Update
Cybersecurity exposure management company Tenable (NASDAQ:TENB) reported Q3 CY2025 results exceeding the market’s revenue expectations, with sales up 11.2% year on year to $252.4 million. The company expects next quarter’s revenue to be around $251.1 million, close to analysts’ estimates. Its non-GAAP profit of $0.42 per share was 13.5% above analysts’ consensus estimates.
Tenable (TENB) Q3 CY2025 Highlights:
- Revenue: $252.4 million vs analyst estimates of $247.3 million (11.2% year-on-year growth, 2.1% beat)
- Adjusted EPS: $0.42 vs analyst estimates of $0.37 (13.5% beat)
- Adjusted Operating Income: $51.44 million vs analyst estimates of $53.2 million (20.4% margin, 3.3% miss)
- Revenue Guidance for Q4 CY2025 is $251.1 million at the midpoint, roughly in line with what analysts were expecting
- Management raised its full-year Adjusted EPS guidance to $1.53 at the midpoint, a 2.3% increase
- Operating Margin: 2.8%, up from -0.9% in the same quarter last year
- Free Cash Flow Margin: 20.5%, up from 15.1% in the previous quarter
- Billings: $267.5 million at quarter end, up 7.5% year on year
- Market Capitalization: $3.68 billion
Company Overview
Starting with the widely-used Nessus vulnerability scanner first released in 1998, Tenable (NASDAQ:TENB) provides exposure management solutions that help organizations identify, assess, and prioritize cybersecurity vulnerabilities across their IT infrastructure and cloud environments.
Tenable's platform gives security teams visibility into vulnerabilities, misconfigurations, and compliance issues across their entire technology landscape. The company's flagship product, Tenable One, combines various security solutions to provide a comprehensive view of an organization's attack surface. This includes traditional IT assets, cloud resources, web applications, Active Directory environments, and operational technology systems used in industrial settings.
Behind Tenable's solutions is its research team of cybersecurity experts who continuously identify new vulnerabilities and security issues. The company employs artificial intelligence and machine learning to analyze vast amounts of security data, prioritize risks, and provide actionable remediation guidance. This helps security teams focus their efforts on the most critical issues first.
A typical customer might use Tenable to scan their network and discover that several cloud servers are running outdated software with known security flaws, while also identifying excessive user permissions that could be exploited by attackers. Tenable then helps prioritize which issues to fix first based on their potential impact.
Tenable generates revenue through subscription licenses to its software platforms. The company sells through a two-tiered channel model, working with distributors who sell to resellers, who then sell to end customers spanning industries from manufacturing and healthcare to government and finance.
4. Vulnerability Management
The demand for cybersecurity is growing as more and more businesses are moving their data and processes into the cloud, which along with a major increase in employees working remotely, has increased their exposure to attacks and malware. Additionally, the growing array of corporate IT systems, applications and internet connected devices has increased the complexity of network security, all of which has substantially increased the demand for software meant to protect data breaches.
Tenable competes with vulnerability management vendors like Qualys (NASDAQ:QLYS) and Rapid7 (NASDAQ:RPD), cloud security specialists including Wiz (private) and Palo Alto Networks (NASDAQ:PANW), and endpoint security providers with vulnerability assessment capabilities such as CrowdStrike (NASDAQ:CRWD).
5. Revenue Growth
A company’s long-term performance is an indicator of its overall quality. Any business can put up a good quarter or two, but the best consistently grow over the long haul. Thankfully, Tenable’s 18.4% annualized revenue growth over the last five years was decent. Its growth was slightly above the average software company and shows its offerings resonate with customers.
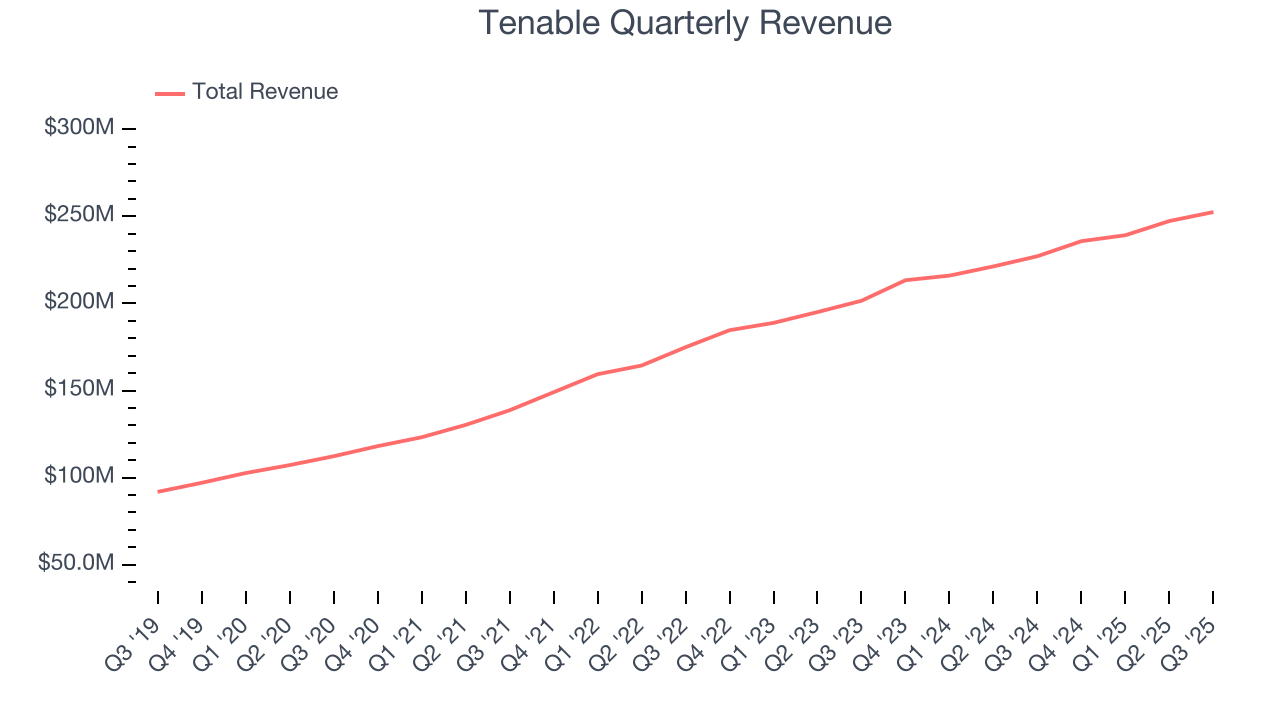
We at StockStory place the most emphasis on long-term growth, but within software, a half-decade historical view may miss recent innovations or disruptive industry trends. Tenable’s recent performance shows its demand has slowed as its annualized revenue growth of 12.5% over the last two years was below its five-year trend. 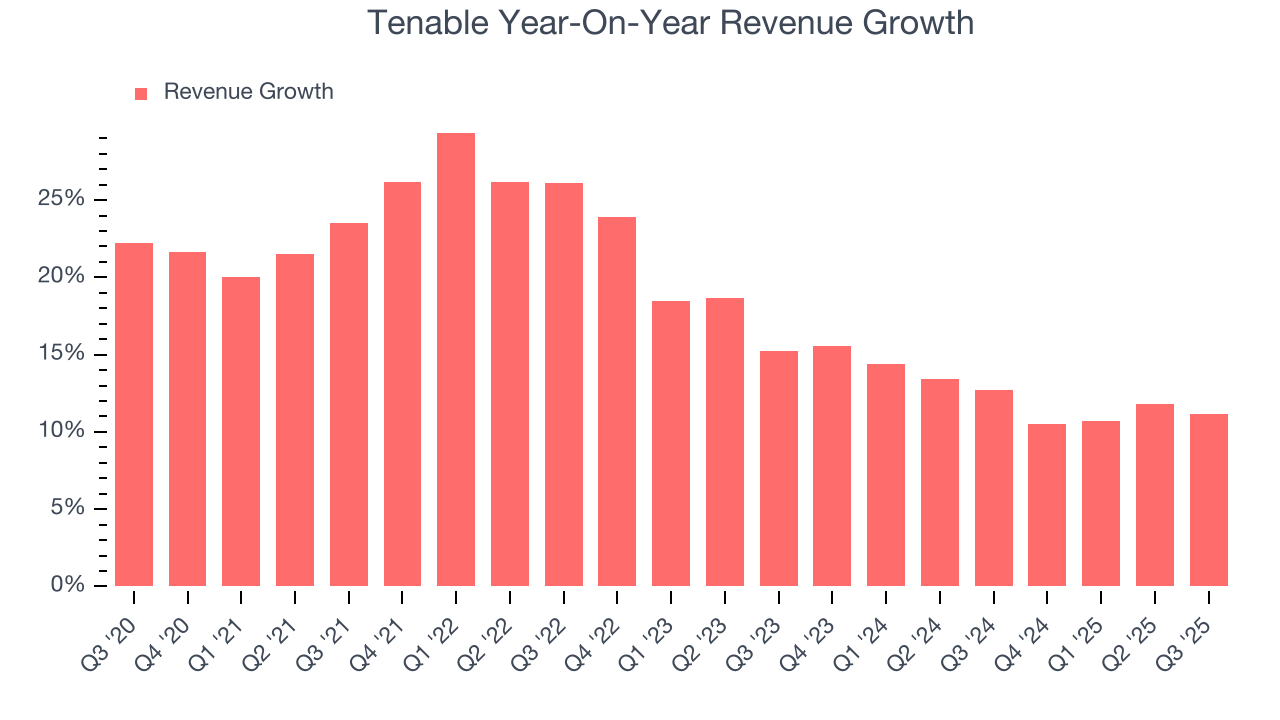
This quarter, Tenable reported year-on-year revenue growth of 11.2%, and its $252.4 million of revenue exceeded Wall Street’s estimates by 2.1%. Company management is currently guiding for a 6.5% year-on-year increase in sales next quarter.
Looking further ahead, sell-side analysts expect revenue to grow 6.8% over the next 12 months, a deceleration versus the last two years. This projection doesn't excite us and implies its products and services will face some demand challenges.
6. Billings
Billings is a non-GAAP metric that is often called “cash revenue” because it shows how much money the company has collected from customers in a certain period. This is different from revenue, which must be recognized in pieces over the length of a contract.
Tenable’s billings came in at $267.5 million in Q3, and over the last four quarters, its growth was underwhelming as it averaged 10.6% year-on-year increases. This performance mirrored its total sales and suggests that increasing competition is causing challenges in acquiring/retaining customers. 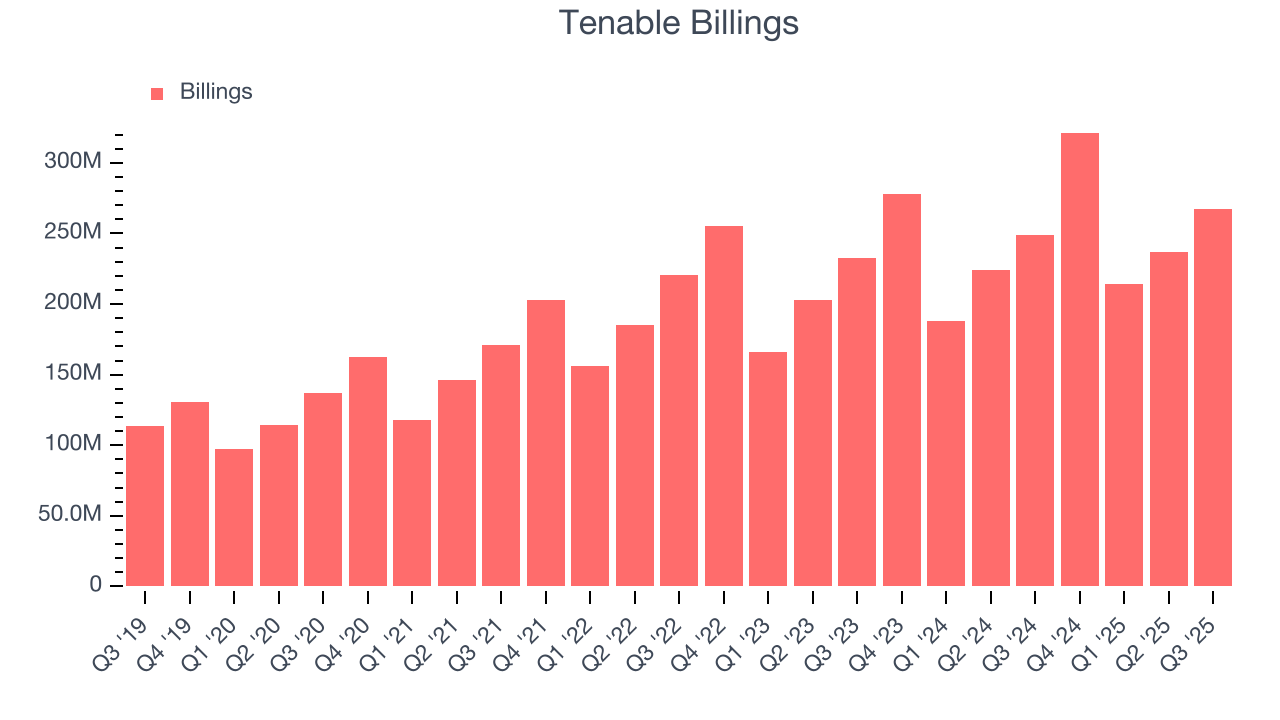
7. Customer Acquisition Efficiency
The customer acquisition cost (CAC) payback period represents the months required to recover the cost of acquiring a new customer. Essentially, it’s the break-even point for sales and marketing investments. A shorter CAC payback period is ideal, as it implies better returns on investment and business scalability.
It’s relatively expensive for Tenable to acquire new customers as its CAC payback period checked in at 70 months this quarter. The company’s slow recovery of its sales and marketing expenses indicates it operates in a highly competitive market and must invest to stand out, even if the return on that investment is low. 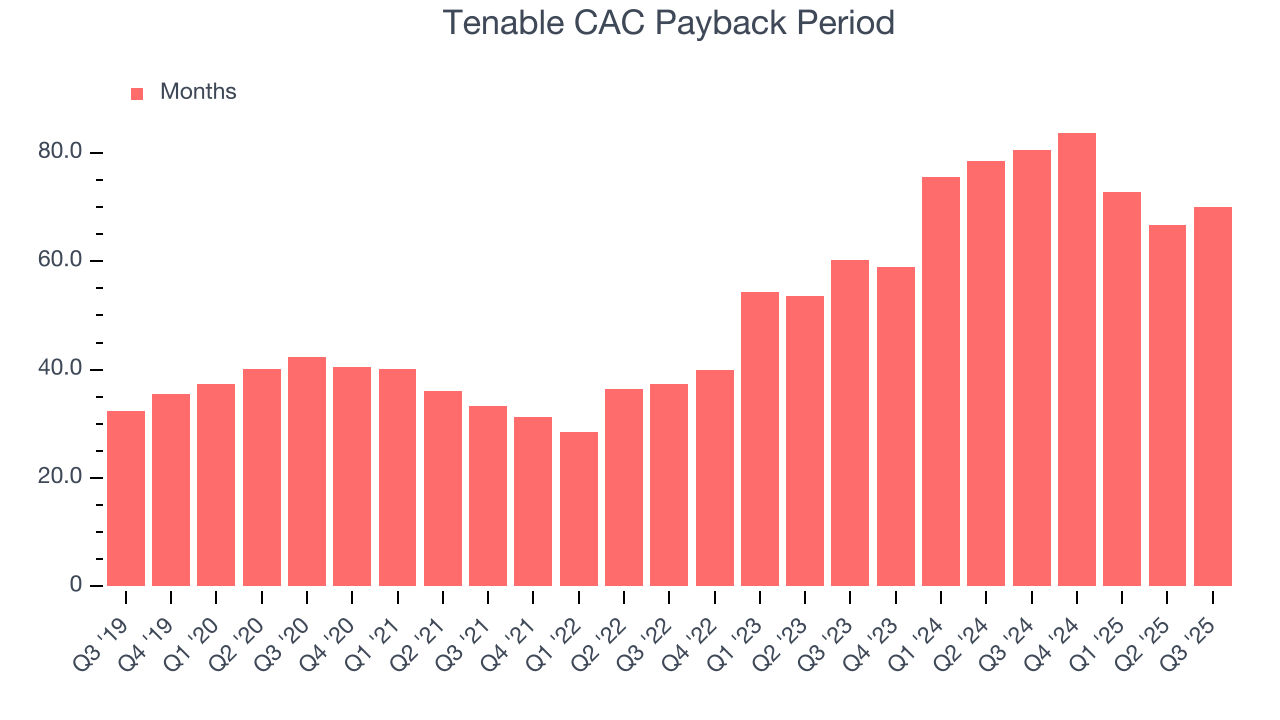
8. Gross Margin & Pricing Power
For software companies like Tenable, gross profit tells us how much money remains after paying for the base cost of products and services (typically servers, licenses, and certain personnel). These costs are usually low as a percentage of revenue, explaining why software is more lucrative than other sectors.
Tenable’s robust unit economics are better than the broader software industry, an output of its asset-lite business model and pricing power. They also enable the company to fund large investments in new products and sales during periods of rapid growth to achieve outsized profits at scale. As you can see below, it averaged an excellent 77.9% gross margin over the last year. Said differently, roughly $77.93 was left to spend on selling, marketing, and R&D for every $100 in revenue.
The market not only cares about gross margin levels but also how they change over time because expansion creates firepower for profitability and free cash generation. Tenable has seen gross margins improve by 1.3 percentage points over the last 2 year, which is solid in the software space.
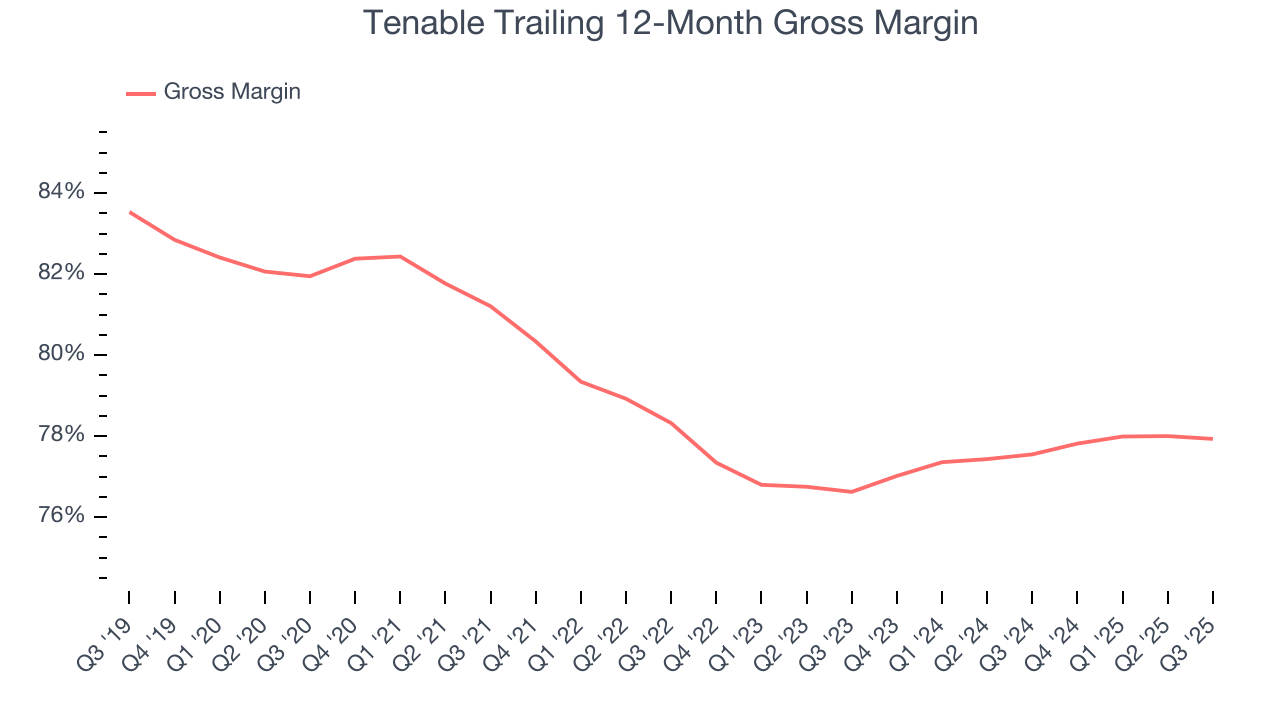
This quarter, Tenable’s gross profit margin was 77.5%, in line with the same quarter last year. Zooming out, the company’s full-year margin has remained steady over the past 12 months, suggesting its input costs have been stable and it isn’t under pressure to lower prices.
9. Operating Margin
Tenable was roughly breakeven when averaging the last year of quarterly operating profits, mediocre for a software business. This result is surprising given its high gross margin as a starting point.
On the plus side, Tenable’s operating margin rose by 3.4 percentage points over the last two years, as its sales growth gave it operating leverage.
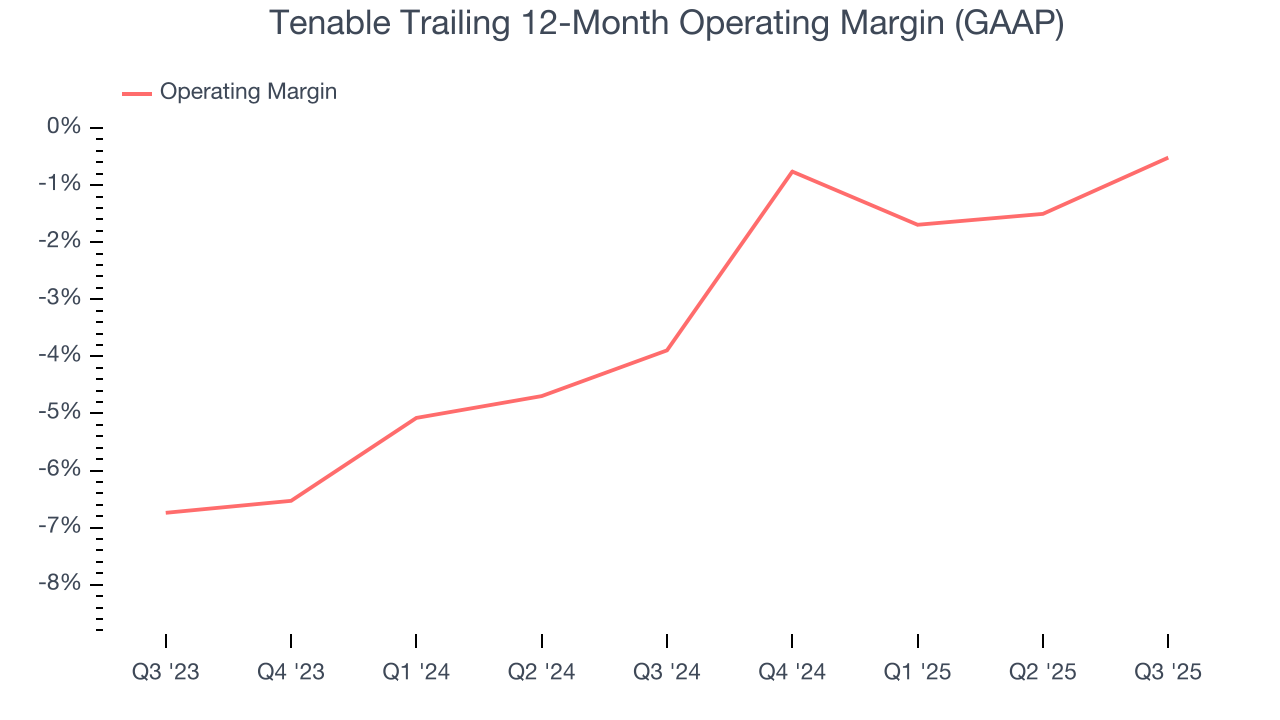
In Q3, Tenable generated an operating margin profit margin of 2.8%, up 3.7 percentage points year on year. The increase was encouraging, and because its operating margin rose more than its gross margin, we can infer it was more efficient with expenses such as marketing, R&D, and administrative overhead.
10. Cash Is King
If you’ve followed StockStory for a while, you know we emphasize free cash flow. Why, you ask? We believe that in the end, cash is king, and you can’t use accounting profits to pay the bills.
Tenable has shown robust cash profitability, driven by its attractive business model that enables it to reinvest or return capital to investors while maintaining a cash cushion. The company’s free cash flow margin averaged 25.4% over the last year, quite impressive for a software business. The divergence from its underwhelming operating margin stems from the add-back of non-cash charges like depreciation and stock-based compensation. GAAP operating profit expenses these line items, but free cash flow does not.
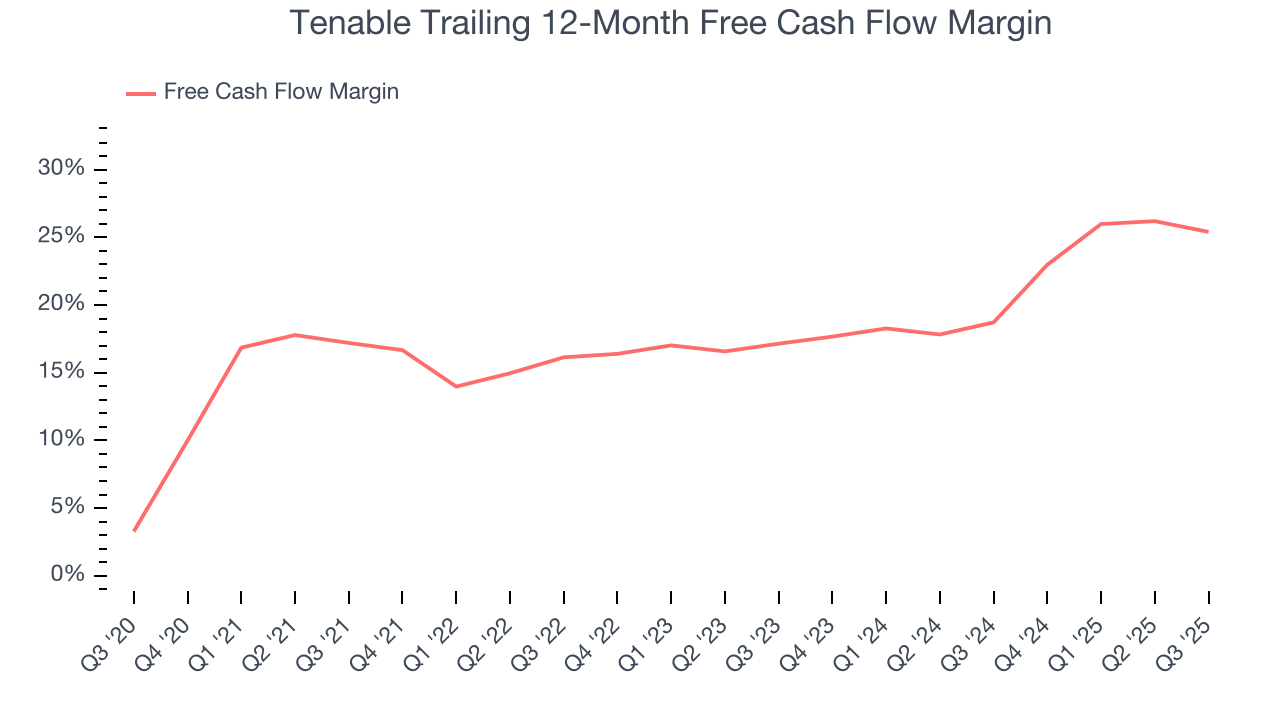
Tenable’s free cash flow clocked in at $51.63 million in Q3, equivalent to a 20.5% margin. The company’s cash profitability regressed as it was 2.8 percentage points lower than in the same quarter last year, prompting us to pay closer attention. Short-term fluctuations typically aren’t a big deal because investment needs can be seasonal, but we’ll be watching to see if the trend extrapolates into future quarters.
Over the next year, analysts’ consensus estimates show they’re expecting Tenable’s free cash flow margin of 25.4% for the last 12 months to remain the same.
11. Balance Sheet Assessment
Tenable reported $383.6 million of cash and $415.2 million of debt on its balance sheet in the most recent quarter. As investors in high-quality companies, we primarily focus on two things: 1) that a company’s debt level isn’t too high and 2) that its interest payments are not excessively burdening the business.
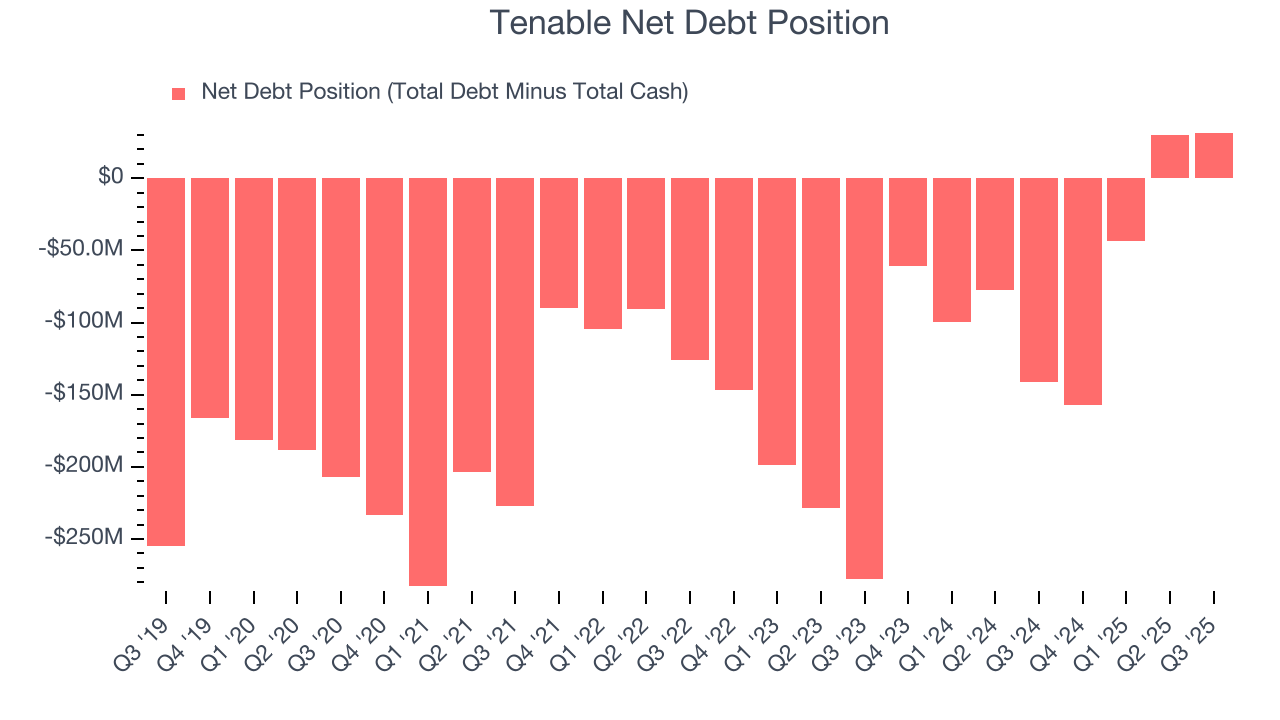
With $231 million of EBITDA over the last 12 months, we view Tenable’s 0.1× net-debt-to-EBITDA ratio as safe. We also see its $10.62 million of annual interest expenses as appropriate. The company’s profits give it plenty of breathing room, allowing it to continue investing in growth initiatives.
12. Key Takeaways from Tenable’s Q3 Results
It was great to see Tenable’s full-year EPS guidance top analysts’ expectations. We were also happy its revenue outperformed Wall Street’s estimates. On the other hand, its billings and adjusted operating income fell short. Overall, this quarter could have been better. The stock traded up 1.1% to $28.94 immediately after reporting.
13. Is Now The Time To Buy Tenable?
Updated: January 24, 2026 at 9:10 PM EST
Before deciding whether to buy Tenable or pass, we urge investors to consider business quality, valuation, and the latest quarterly results.
Tenable isn’t a terrible business, but it doesn’t pass our quality test. Although its revenue growth was solid over the last five years, it’s expected to deteriorate over the next 12 months and its expanding operating margin shows it’s becoming more efficient at building and selling its software.
Tenable’s price-to-sales ratio based on the next 12 months is 2.7x. This valuation is reasonable, but the company’s shakier fundamentals present too much downside risk. We're fairly confident there are better investments elsewhere.
Wall Street analysts have a consensus one-year price target of $35.63 on the company (compared to the current share price of $22.45).
Although the price target is bullish, readers should exercise caution because analysts tend to be overly optimistic. The firms they work for, often big banks, have relationships with companies that extend into fundraising, M&A advisory, and other rewarding business lines. As a result, they typically hesitate to say bad things for fear they will lose out. We at StockStory do not suffer from such conflicts of interest, so we’ll always tell it like it is.