
Texas Instruments (TXN)
We aren’t fans of Texas Instruments. Its underwhelming revenue growth and failure to generate meaningful free cash flow is a concerning trend.― StockStory Analyst Team
1. News
2. Summary
Why Texas Instruments Is Not Exciting
Headquartered in Dallas, Texas since the 1950s, Texas Instruments (NASDAQ:TXN) is the world’s largest producer of analog semiconductors.
- Earnings per share fell by 1.8% annually over the last five years while its revenue grew, showing its incremental sales were much less profitable
- Lacking free cash flow margin got worse over the last five years as its investment needs accelerated
- A bright spot is that its industry-leading 44.6% return on capital demonstrates management’s skill in finding high-return investments


Texas Instruments is in the penalty box. There are more appealing investments to be made.
Why There Are Better Opportunities Than Texas Instruments


Texas Instruments’s stock price of $212.67 implies a valuation ratio of 32x forward P/E. Texas Instruments’s valuation may seem like a bargain, especially when stacked up against other semiconductor companies. We remind you that you often get what you pay for, though.
It’s better to pay up for high-quality businesses with higher long-term earnings potential rather than to buy lower-quality stocks because they appear cheap. These challenged businesses often don’t re-rate, a phenomenon known as a “value trap”.
3. Texas Instruments (TXN) Research Report: Q4 CY2025 Update
Analog chip manufacturer Texas Instruments (NASDAQ:TXN) missed Wall Street’s revenue expectations in Q4 CY2025, but sales rose 10.4% year on year to $4.42 billion. On the other hand, next quarter’s outlook exceeded expectations with revenue guided to $4.5 billion at the midpoint, or 1.7% above analysts’ estimates. Its GAAP profit of $1.27 per share was 2.9% below analysts’ consensus estimates.
Texas Instruments (TXN) Q4 CY2025 Highlights:
- Revenue: $4.42 billion vs analyst estimates of $4.46 billion (10.4% year-on-year growth, 0.8% miss)
- EPS (GAAP): $1.27 vs analyst expectations of $1.31 (2.9% miss)
- Adjusted EBITDA: $2.09 billion vs analyst estimates of $2.05 billion (47.3% margin, 1.9% beat)
- Revenue Guidance for Q1 CY2026 is $4.5 billion at the midpoint, above analyst estimates of $4.42 billion
- EPS (GAAP) guidance for Q1 CY2026 is $1.35 at the midpoint, beating analyst estimates by 5.6%
- Operating Margin: 33.3%, down from 34.4% in the same quarter last year
- Free Cash Flow Margin: 30%, up from 20.1% in the same quarter last year
- Inventory Days Outstanding: 224, up from 218 in the previous quarter
- Market Capitalization: $178.6 billion
Company Overview
Headquartered in Dallas, Texas since the 1950s, Texas Instruments (NASDAQ:TXN) is the world’s largest producer of analog semiconductors.
One of the oldest US-based technology companies, Texas Instruments created the first commercial silicon transistor and the transistor radio in 1954, the first handheld calculator in 1967, and the first microcontroller in 1970. Texas Instruments has long been the largest manufacturer and seller of analog chips, and serves one of the widest customer bases of
Its breadth of products is matched by its breadth of manufacturing, it runs 14 manufacturing sites around the world, from Germany to China to Japan and throughout Southeast Asia.
While personal electronics and industrial (manufacturing) end markets have long been TXN’s largest end markets, it also serves customers in automotive, communications, and enterprise computing.
Texas Instruments’ peers and competitors include Analog Devices (NASDAQ:ADI), Skyworks (NASDAQ:SWKS), Infineon (XTRA:IFX), NXP Semiconductors NV (NASDAQ:NXPI), ON Semi (NASDAQ:ON), and Microchip (NASDAQ:MCHP).
4. Analog Semiconductors
Longer manufacturing duration allows analog chip makers to generate greater efficiencies, leading to structurally higher gross margins than their fabless digital peers. The downside of vertical integration is that cyclicality can be more pronounced for analog chipmakers, as capacity utilization upsides work in reverse during down periods.
5. Revenue Growth
A company’s long-term sales performance can indicate its overall quality. Any business can put up a good quarter or two, but many enduring ones grow for years. Over the last five years, Texas Instruments grew its sales at a mediocre 4.1% compounded annual growth rate. This was below our standard for the semiconductor sector and is a rough starting point for our analysis. Semiconductors are a cyclical industry, and long-term investors should be prepared for periods of high growth followed by periods of revenue contractions.
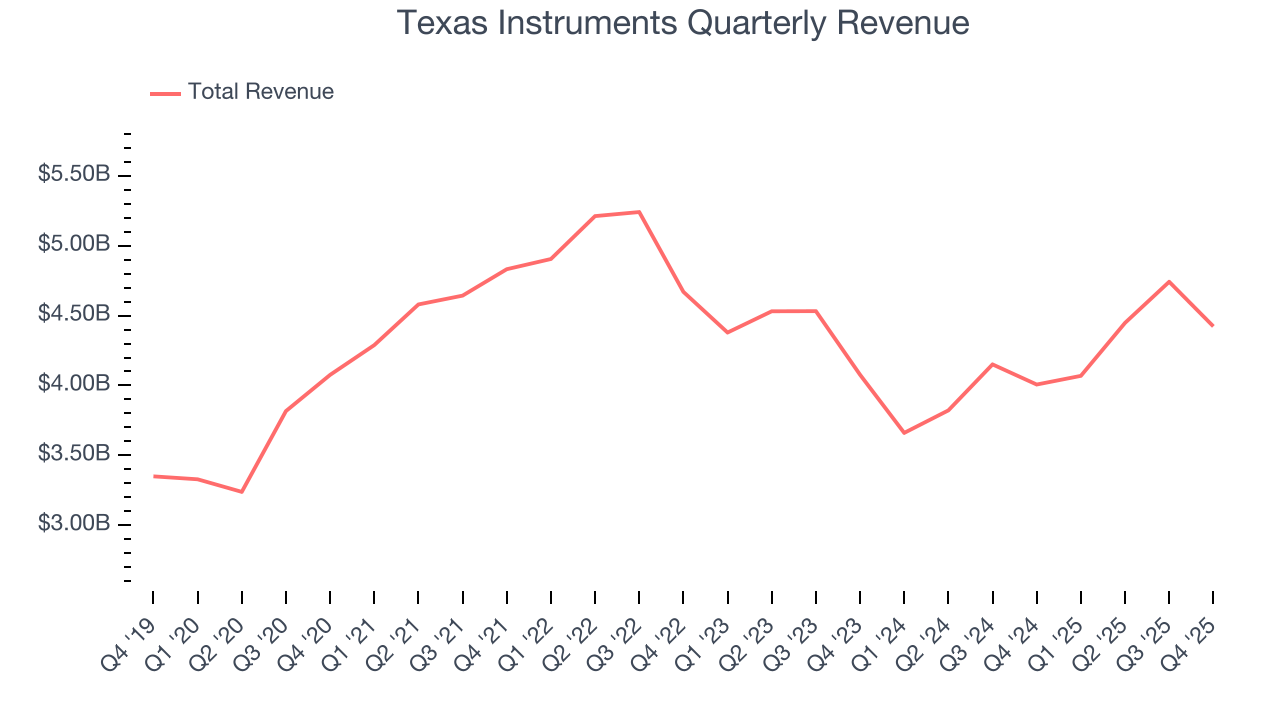
We at StockStory place the most emphasis on long-term growth, but within semiconductors, a half-decade historical view may miss new demand cycles or industry trends like AI. Texas Instruments’s recent performance shows its demand has slowed as its revenue was flat over the last two years. 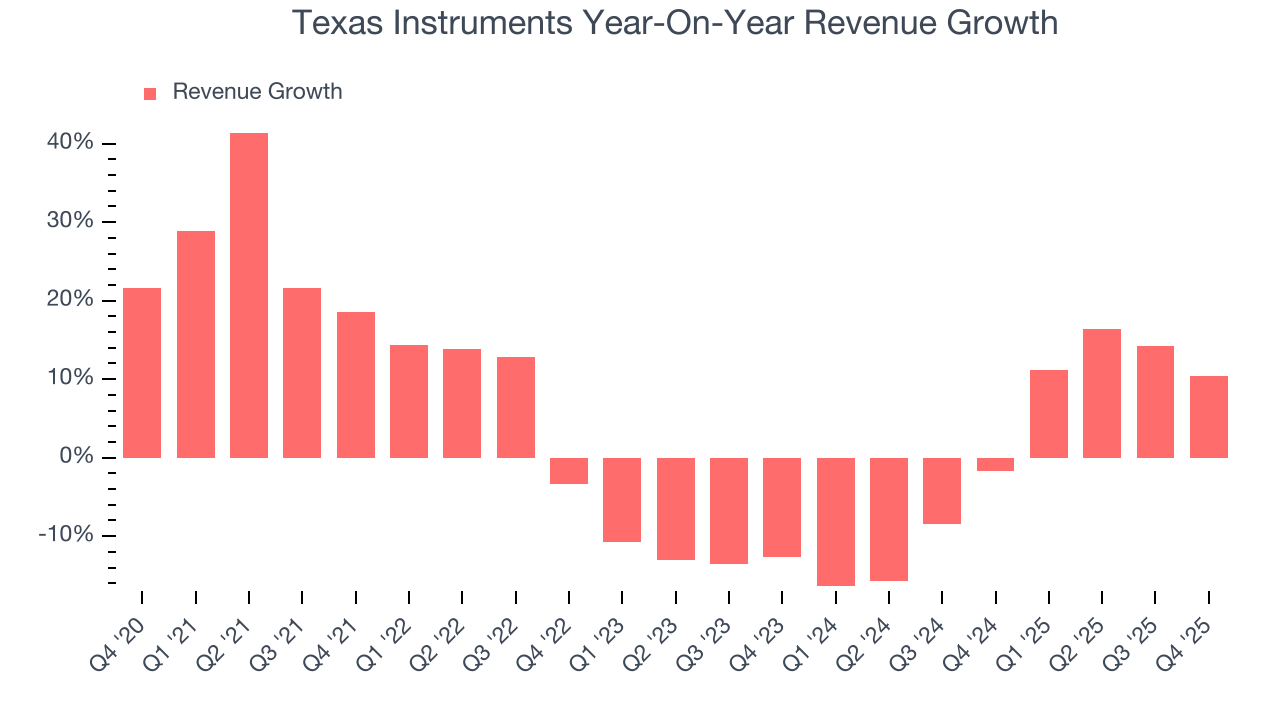
This quarter, Texas Instruments’s revenue grew by 10.4% year on year to $4.42 billion but fell short of Wall Street’s estimates. Beyond the miss, this marks 4 straight quarters of growth, implying that Texas Instruments is in the middle of its cycle - a typical upcycle generally lasts 8-10 quarters. Company management is currently guiding for a 10.6% year-on-year increase in sales next quarter.
Looking further ahead, sell-side analysts expect revenue to grow 8.4% over the next 12 months. While this projection indicates its newer products and services will spur better top-line performance, it is still below average for the sector.
6. Product Demand & Outstanding Inventory
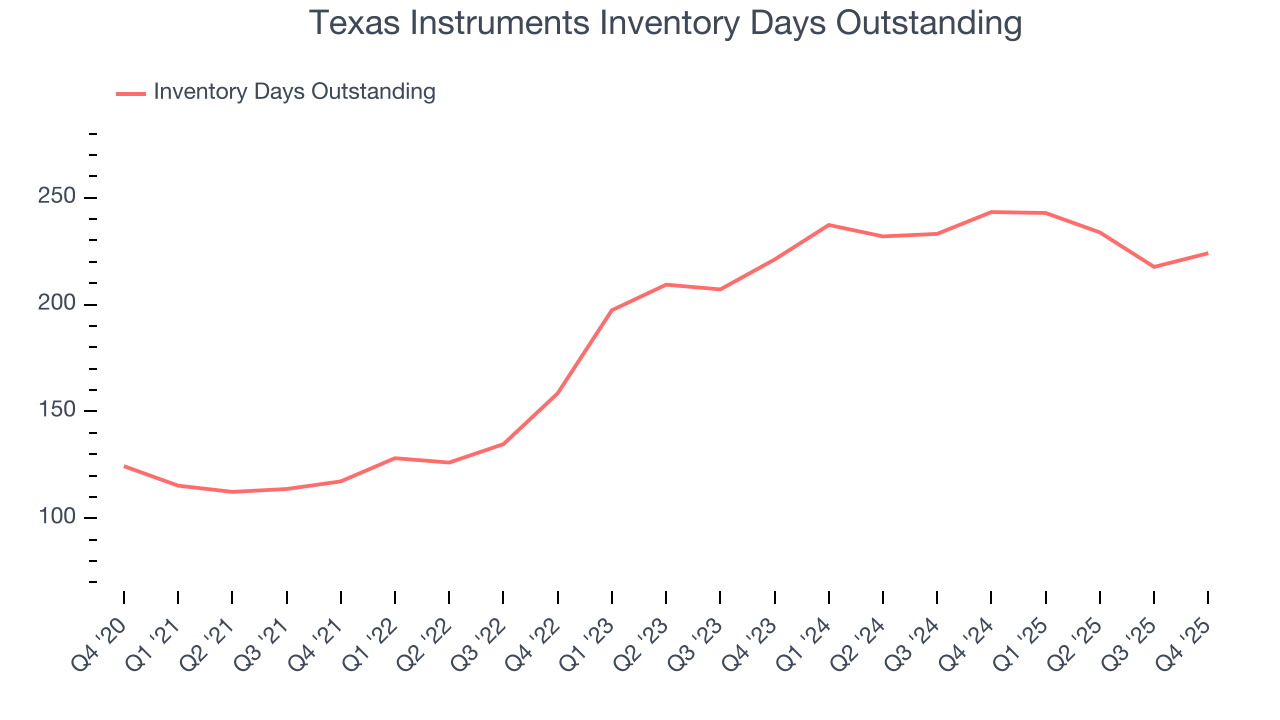
Days Inventory Outstanding (DIO) is an important metric for chipmakers, as it reflects a business’ capital intensity and the cyclical nature of semiconductor supply and demand. In a tight supply environment, inventories tend to be stable, allowing chipmakers to exert pricing power. Steadily increasing DIO can be a warning sign that demand is weak, and if inventories continue to rise, the company may have to downsize production.
This quarter, Texas Instruments’s DIO came in at 224, which is 39 days above its five-year average, suggesting that the company’s inventory has grown to higher levels than we’ve seen in the past.
7. Gross Margin & Pricing Power
In the semiconductor industry, a company’s gross profit margin is a critical metric to track because it sheds light on its pricing power, complexity of products, and ability to procure raw materials, equipment, and labor.
Texas Instruments’s gross margin is well ahead of its semiconductor peers, and its strong pricing power is an output of its differentiated, value-add products. As you can see below, it averaged an excellent 57.5% gross margin over the last two years. Said differently, roughly $57.55 was left to spend on selling, marketing, R&D, and general administrative overhead for every $100 in revenue. 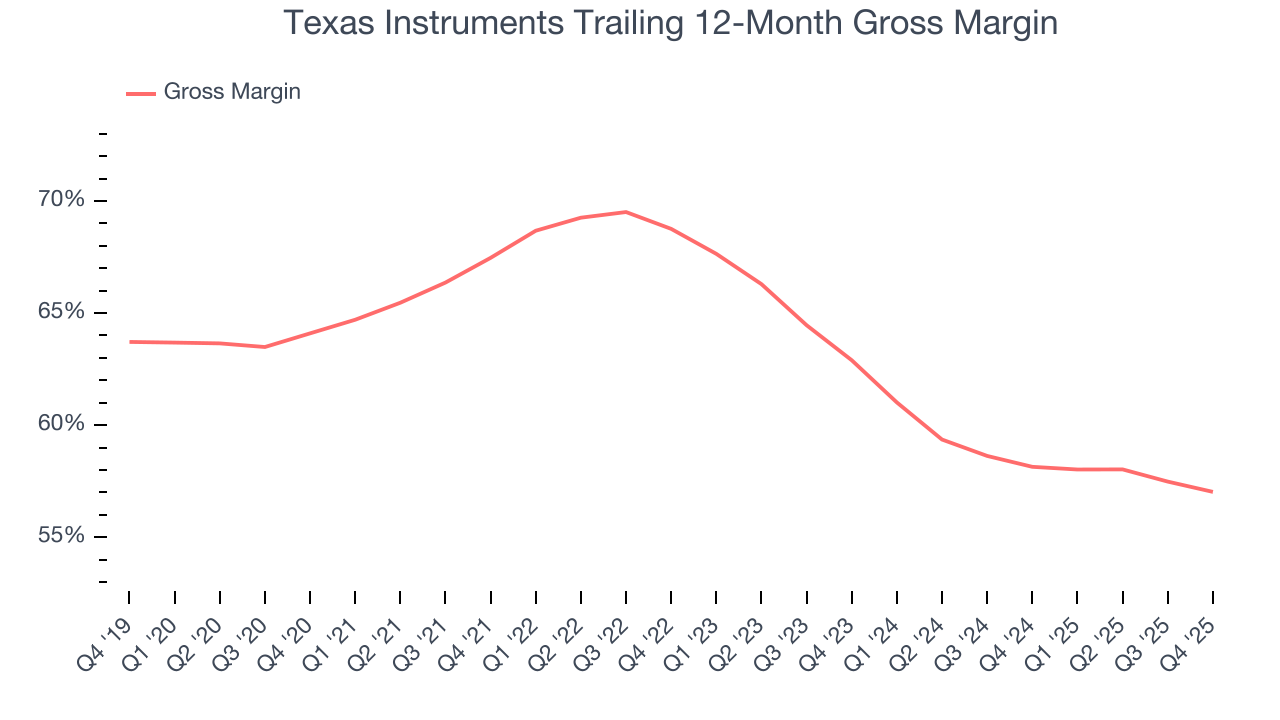
Texas Instruments produced a 55.9% gross profit margin in Q4, marking a 1.9 percentage point decrease from 57.7% in the same quarter last year. Texas Instruments’s full-year margin has also been trending down over the past 12 months, decreasing by 1.1 percentage points. If this move continues, it could suggest a more competitive environment with some pressure to lower prices and higher input costs (such as raw materials and manufacturing expenses).
8. Operating Margin
Texas Instruments has been a well-oiled machine over the last two years. It demonstrated elite profitability for a semiconductor business, boasting an average operating margin of 34.5%. This result isn’t surprising as its high gross margin gives it a favorable starting point.
Analyzing the trend in its profitability, Texas Instruments’s operating margin decreased by 15.3 percentage points over the last five years. This raises questions about the company’s expense base because its revenue growth should have given it leverage on its fixed costs, resulting in better economies of scale and profitability.
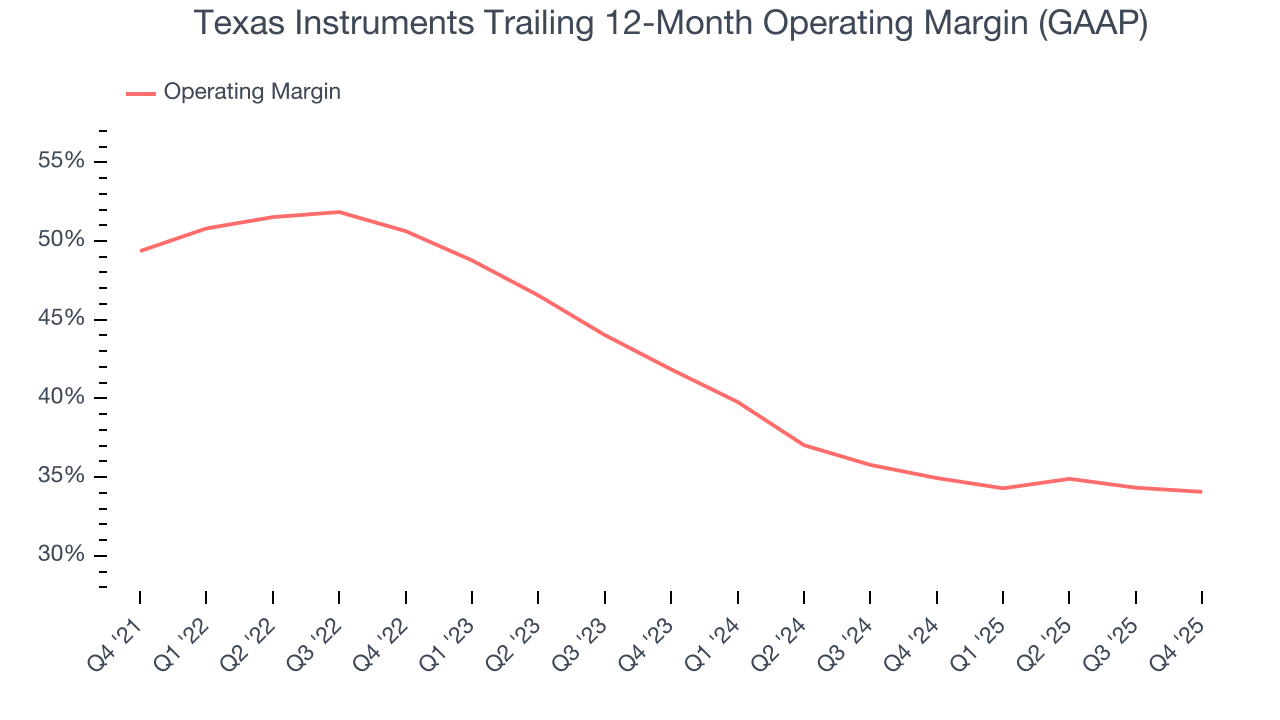
In Q4, Texas Instruments generated an operating margin profit margin of 33.3%, down 1.1 percentage points year on year. Since Texas Instruments’s gross margin decreased more than its operating margin, we can assume its recent inefficiencies were driven more by weaker leverage on its cost of sales rather than increased marketing, R&D, and administrative overhead expenses.
9. Earnings Per Share
Revenue trends explain a company’s historical growth, but the long-term change in earnings per share (EPS) points to the profitability of that growth – for example, a company could inflate its sales through excessive spending on advertising and promotions.
Sadly for Texas Instruments, its EPS declined by 1.8% annually over the last five years while its revenue grew by 4.1%. This tells us the company became less profitable on a per-share basis as it expanded due to non-fundamental factors such as interest expenses and taxes.
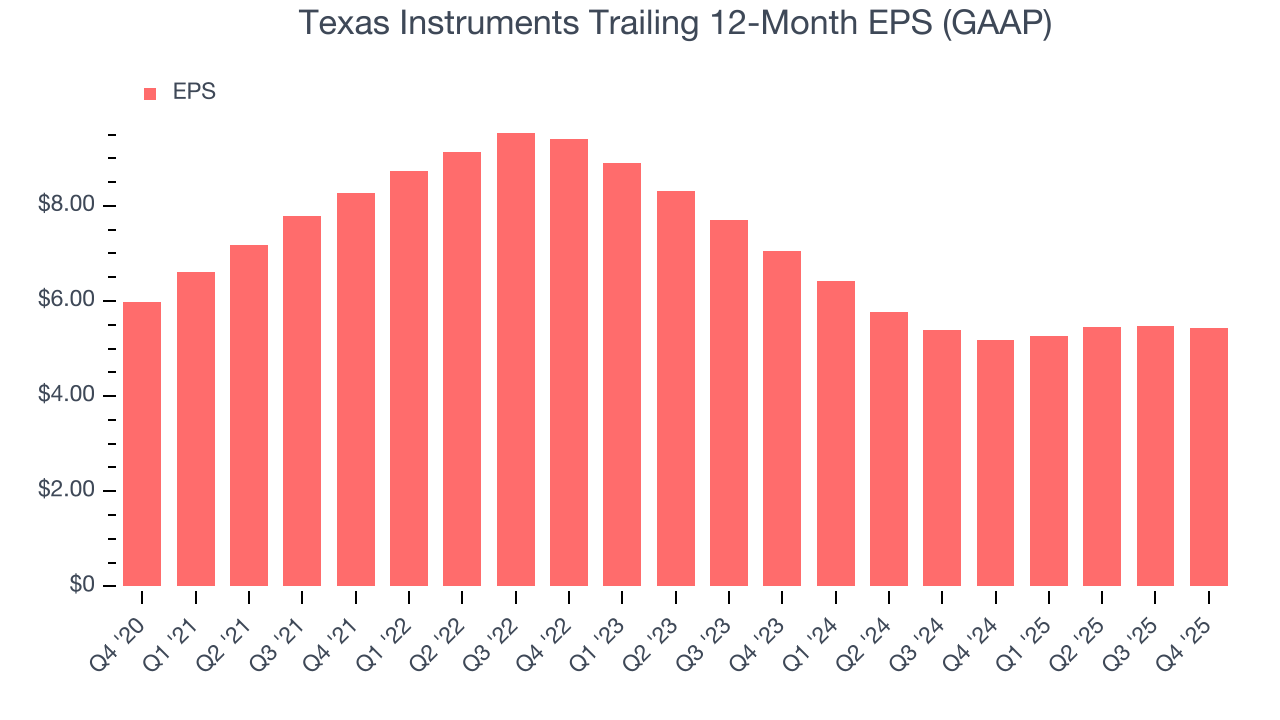
Diving into the nuances of Texas Instruments’s earnings can give us a better understanding of its performance. As we mentioned earlier, Texas Instruments’s operating margin declined by 15.3 percentage points over the last five years. This was the most relevant factor (aside from the revenue impact) behind its lower earnings; interest expenses and taxes can also affect EPS but don’t tell us as much about a company’s fundamentals.
In Q4, Texas Instruments reported EPS of $1.27, down from $1.30 in the same quarter last year. This print missed analysts’ estimates. Over the next 12 months, Wall Street expects Texas Instruments’s full-year EPS of $5.44 to grow 13%.
10. Cash Is King
Although earnings are undoubtedly valuable for assessing company performance, we believe cash is king because you can’t use accounting profits to pay the bills.
Texas Instruments has shown mediocre cash profitability over the last two years, giving the company limited opportunities to return capital to shareholders. Its free cash flow margin averaged 12.3%, subpar for a semiconductor business. The divergence from its good operating margin stems from its capital-intensive business model, which requires Texas Instruments to make large cash investments in working capital and capital expenditures.
Taking a step back, we can see that Texas Instruments’s margin dropped by 19.6 percentage points over the last five years. It may have ticked higher more recently, but shareholders are likely hoping for its margin to at least revert to its historical level. Almost any movement in the wrong direction is undesirable because of its relatively low cash conversion. If the longer-term trend returns, it could signal it’s becoming a more capital-intensive business.
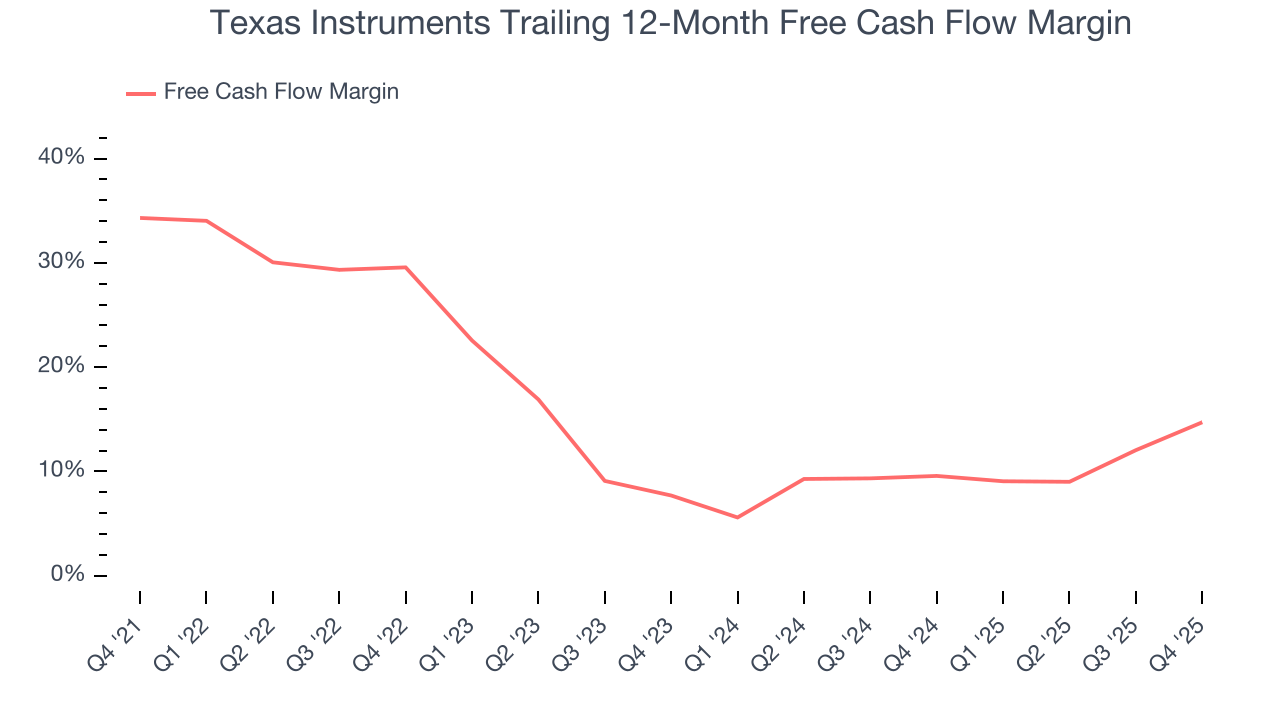
Texas Instruments’s free cash flow clocked in at $1.33 billion in Q4, equivalent to a 30% margin. This result was good as its margin was 9.9 percentage points higher than in the same quarter last year, but we wouldn’t put too much weight on the short term because investment needs can be seasonal, causing temporary swings. Long-term trends trump fluctuations.
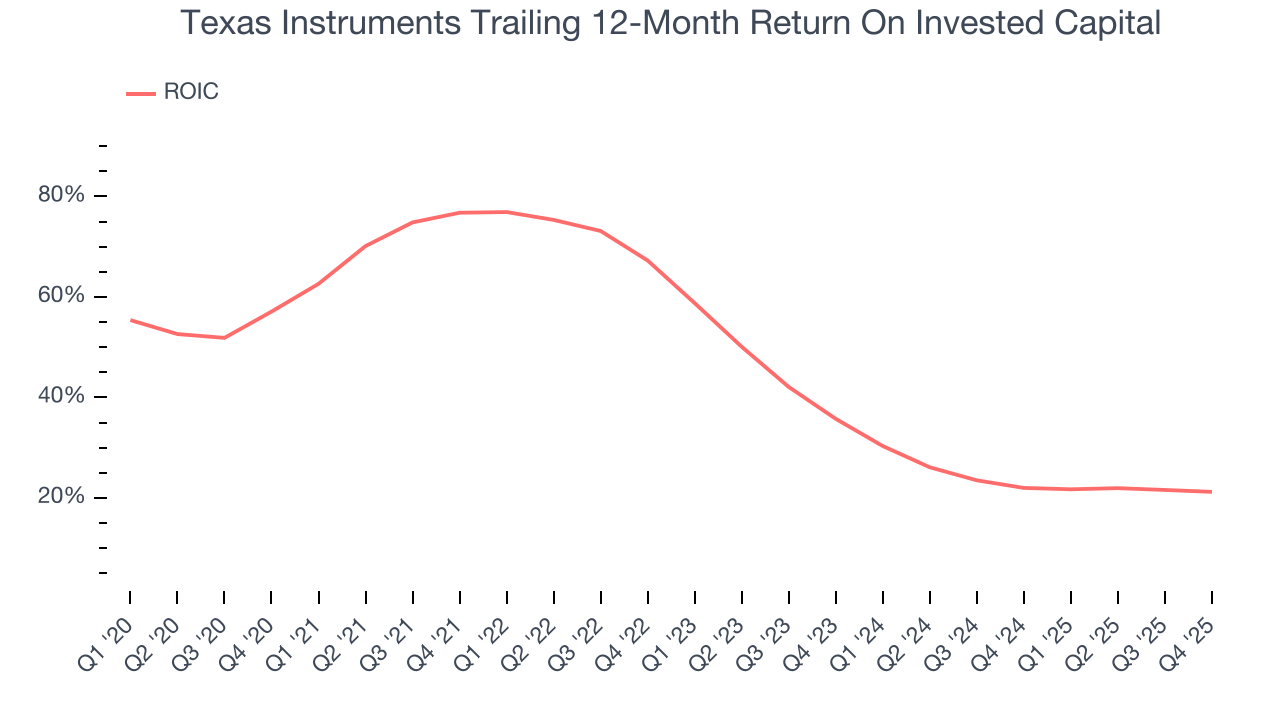
11. Return on Invested Capital (ROIC)
EPS and free cash flow tell us whether a company was profitable while growing its revenue. But was it capital-efficient? Enter ROIC, a metric showing how much operating profit a company generates relative to the money it has raised (debt and equity).
Although Texas Instruments hasn’t been the highest-quality company lately because of its poor bottom-line (EPS) performance, it found a few growth initiatives in the past that worked out wonderfully. Its five-year average ROIC was 44.6%, splendid for a semiconductor business.
12. Balance Sheet Assessment
Texas Instruments reported $4.88 billion of cash and $14.05 billion of debt on its balance sheet in the most recent quarter. As investors in high-quality companies, we primarily focus on two things: 1) that a company’s debt level isn’t too high and 2) that its interest payments are not excessively burdening the business.
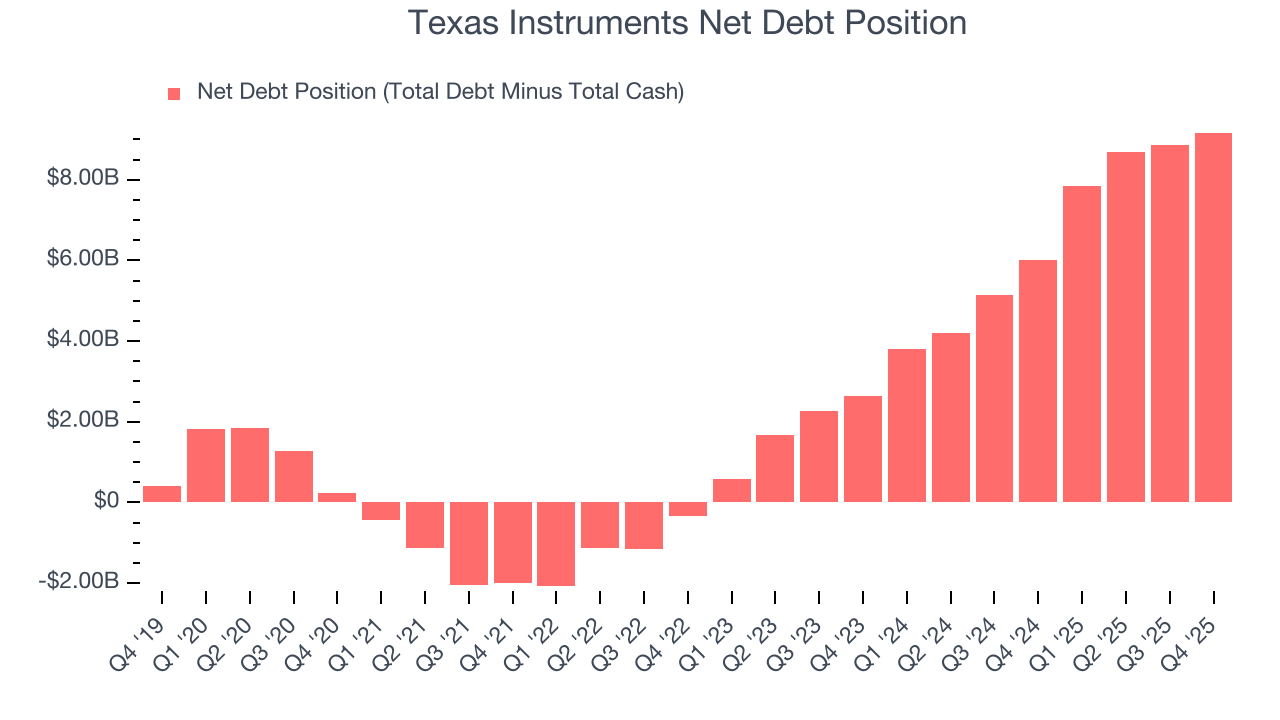
With $8.08 billion of EBITDA over the last 12 months, we view Texas Instruments’s 1.1× net-debt-to-EBITDA ratio as safe. We also see its $261 million of annual interest expenses as appropriate. The company’s profits give it plenty of breathing room, allowing it to continue investing in growth initiatives.
13. Key Takeaways from Texas Instruments’s Q4 Results
It was encouraging to see Texas Instruments’s revenue guidance for next quarter beat analysts’ expectations. On the other hand, its EPS missed and its revenue fell slightly short of Wall Street’s estimates. Overall, this was a weaker quarter. The stock traded up 4.2% to $206.27 immediately following the results.
14. Is Now The Time To Buy Texas Instruments?
Updated: January 27, 2026 at 9:17 PM EST
Are you wondering whether to buy Texas Instruments or pass? We urge investors to not only consider the latest earnings results but also longer-term business quality and valuation as well.
Texas Instruments isn’t a terrible business, but it doesn’t pass our bar. For starters, its revenue growth was mediocre over the last five years. And while its impressive operating margins show it has a highly efficient business model, the downside is its cash profitability fell over the last five years. On top of that, its declining operating margin shows the business has become less efficient.
Texas Instruments’s P/E ratio based on the next 12 months is 32x. While this valuation is fair, the upside isn’t great compared to the potential downside. We're pretty confident there are superior stocks to buy right now.
Wall Street analysts have a consensus one-year price target of $194.98 on the company (compared to the current share price of $212.67).