
CBRE (CBRE)
CBRE is up against the odds. Its weak sales growth and low returns on capital show it struggled to generate demand and profits.― StockStory Analyst Team
1. News

2. Summary
Why We Think CBRE Will Underperform
Established in 1906, CBRE (NYSE:CBRE) is one of the largest commercial real estate services firms in the world.
- The company has faced growth challenges as its 11.2% annual revenue increases over the last five years fell short of other consumer discretionary companies
- Earnings growth underperformed the sector average over the last five years as its EPS grew by just 14.3% annually
- Subpar operating margin constrains its ability to invest in process improvements or effectively respond to new competitive threats


CBRE’s quality isn’t great. We’d search for superior opportunities elsewhere.
Why There Are Better Opportunities Than CBRE


CBRE’s stock price of $132.00 implies a valuation ratio of 17.5x forward P/E. This multiple expensive for its subpar fundamentals.
Paying a premium for high-quality companies with strong long-term earnings potential is preferable to owning challenged businesses with questionable prospects. That helps the prudent investor sleep well at night.
3. CBRE (CBRE) Research Report: Q4 CY2025 Update
Commercial real estate firm CBRE (NYSE:CBRE) met Wall Street’s revenue expectations in Q4 CY2025, with sales up 11.8% year on year to $11.63 billion. Its non-GAAP profit of $2.73 per share was 2% above analysts’ consensus estimates.
CBRE (CBRE) Q4 CY2025 Highlights:
- Revenue: $11.63 billion vs analyst estimates of $11.66 billion (11.8% year-on-year growth, in line)
- Adjusted EPS: $2.73 vs analyst estimates of $2.68 (2% beat)
- Adjusted EBITDA: $1.29 billion vs analyst estimates of $1.23 billion (11.1% margin, 4.7% beat)
- Adjusted EPS guidance for the upcoming financial year 2026 is $7.45 at the midpoint, missing analyst estimates by 0.6%
- Operating Margin: 5.4%, in line with the same quarter last year
- Free Cash Flow Margin: 11.7%, similar to the same quarter last year
- Market Capitalization: $43.82 billion
Company Overview
Established in 1906, CBRE (NYSE:CBRE) is one of the largest commercial real estate services firms in the world.
CBRE’s comprehensive offerings include property management, leasing, commercial property and corporate facility management, project management, capital markets solutions (including property sales, mortgage brokerage, and loan origination), valuation, and advisory services. This wide range of services positions CBRE as a full-service provider in the commercial real estate market, capable of meeting a diverse array of client needs.
The company operates through three primary business segments: Advisory Services, Global Workplace Solutions, and Real Estate Investments. Advisory Services provides a broad range of services to property owners and investors, including leasing, capital markets, property management, valuation, and consulting. Global Workplace Solutions offers a comprehensive suite of facilities management and project management services for occupiers of commercial properties. The Real Estate Investments segment includes investment management services through CBRE Global Investors and development services through Trammell Crow Company.
CBRE’s global footprint is extensive, with more than 500 offices and tens of thousands of employees worldwide. This expansive network allows the company to serve clients across various geographies and industries, offering local market insight along with global expertise.
4. Real Estate Services
Technology has been a double-edged sword in real estate services. On the one hand, internet listings are effective at disseminating information far and wide, casting a wide net for buyers and sellers to increase the chances of transactions. On the other hand, digitization in the real estate market could potentially disintermediate key players like agents who use information asymmetries to their advantage.
CBRE’s primary competitors include Jones Lang LaSalle (NYSE:JLL), Cushman & Wakefield (NYSE:CWK), Colliers International (NASDAQ:CIGI), and BGC Partners (NASDAQ:BGCP).
5. Revenue Growth
Examining a company’s long-term performance can provide clues about its quality. Any business can experience short-term success, but top-performing ones enjoy sustained growth for years. Over the last five years, CBRE grew its sales at a 11.2% annual rate. Though this growth is acceptable on an absolute basis, we need to see more than just topline growth for the consumer discretionary sector, which can display significant earnings volatility. This means our bar for the sector is particularly high, reflecting the non-essential and hit-driven nature of the products and services offered. Additionally, five-year CAGR starts around Covid, when revenue was depressed then rebounded.
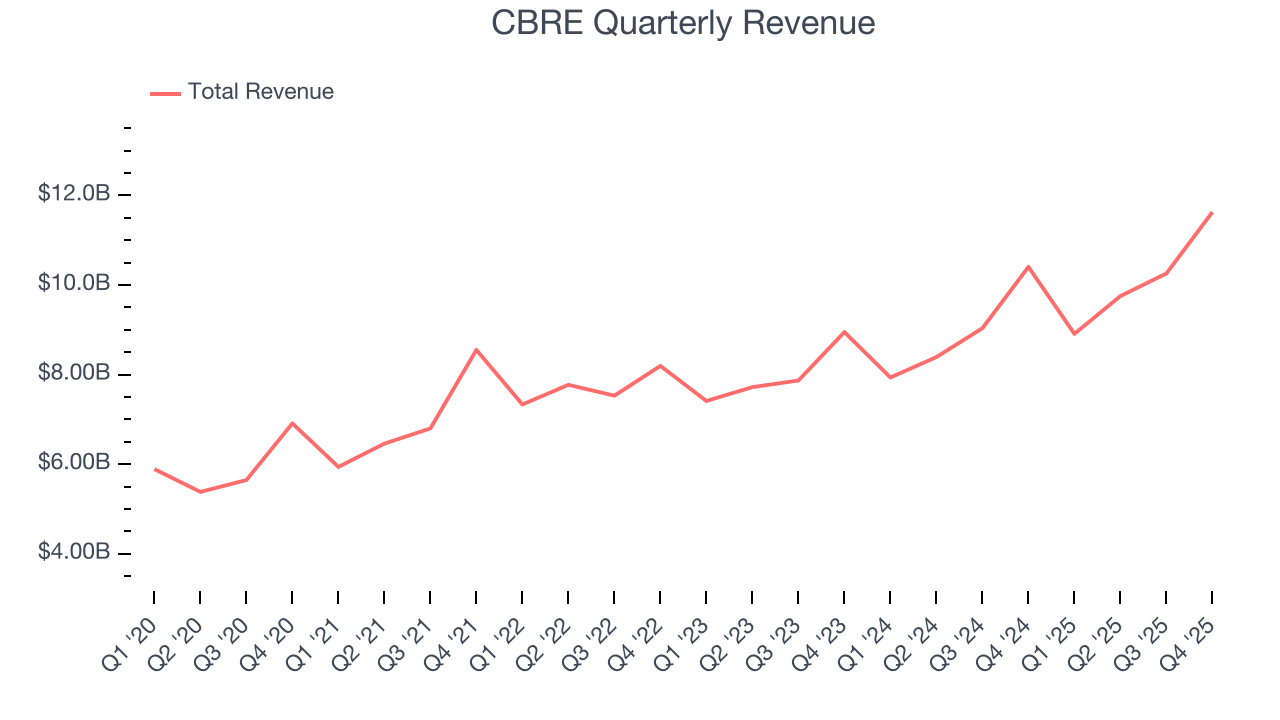
Long-term growth is the most important, but within consumer discretionary, product cycles are short and revenue can be hit-driven due to rapidly changing trends and consumer preferences. CBRE’s annualized revenue growth of 12.7% over the last two years is above its five-year trend, which is encouraging. 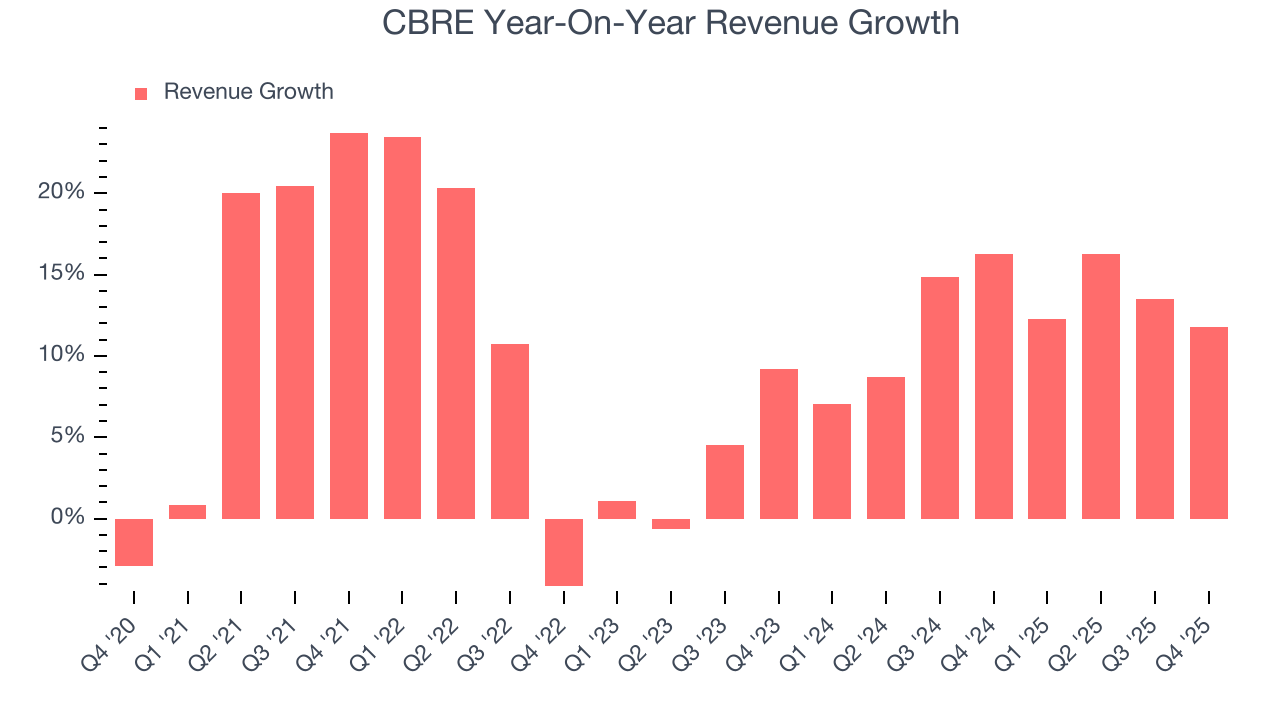
We can dig further into the company’s revenue dynamics by analyzing its most important segment, Advisory Services. Over the last two years, CBRE’s Advisory Services revenue (leasing, capital markets) averaged 8.3% year-on-year declines. This segment has lagged the company’s overall sales. 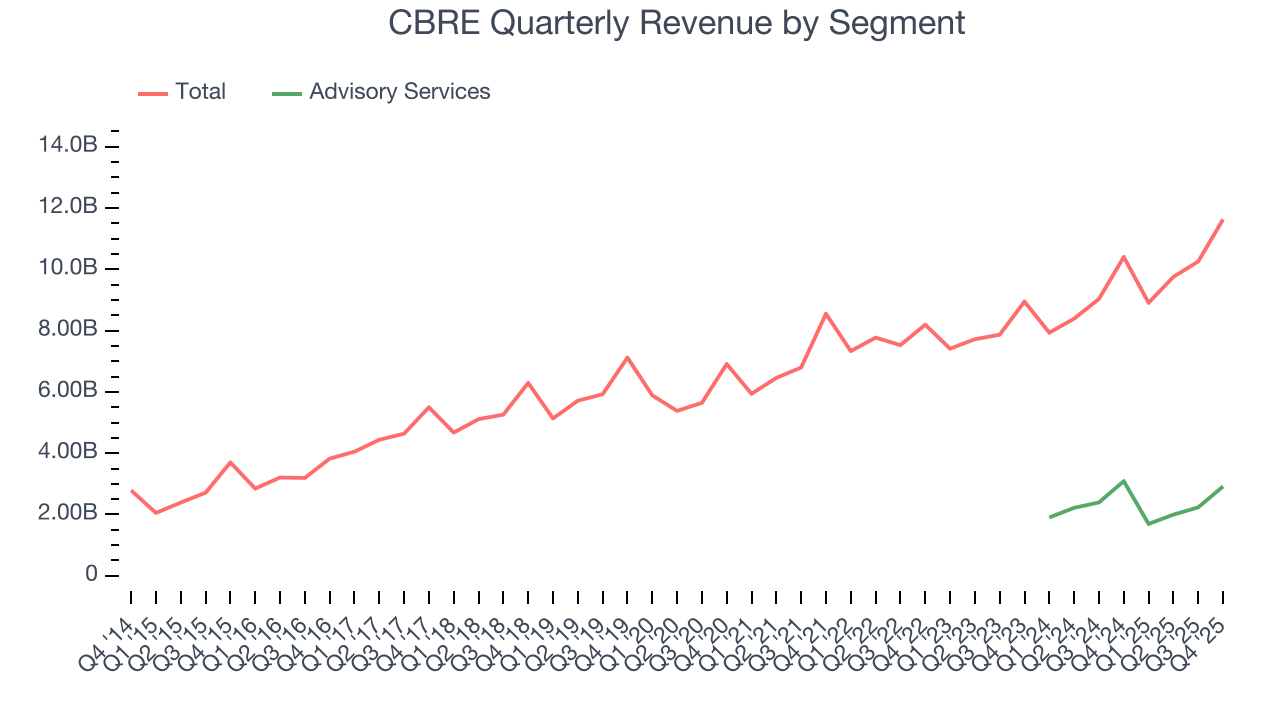
This quarter, CBRE’s year-on-year revenue growth was 11.8%, and its $11.63 billion of revenue was in line with Wall Street’s estimates.
Looking ahead, sell-side analysts expect revenue to grow 11.4% over the next 12 months, similar to its two-year rate. This projection doesn't excite us and suggests its products and services will face some demand challenges.
6. Operating Margin
CBRE’s operating margin might fluctuated slightly over the last 12 months but has generally stayed the same, averaging 4.2% over the last two years. This profitability was inadequate for a consumer discretionary business and caused by its suboptimal cost structure.
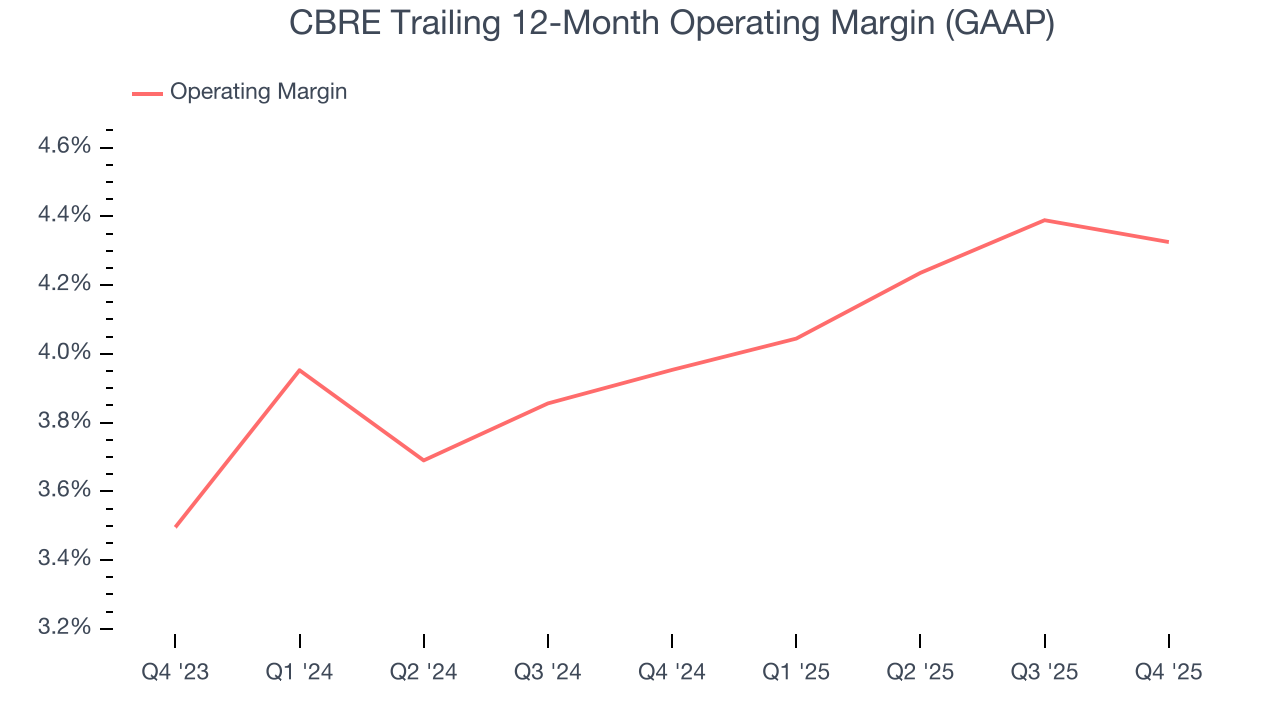
In Q4, CBRE generated an operating margin profit margin of 5.4%, in line with the same quarter last year. This indicates the company’s overall cost structure has been relatively stable.
7. Earnings Per Share
Revenue trends explain a company’s historical growth, but the long-term change in earnings per share (EPS) points to the profitability of that growth – for example, a company could inflate its sales through excessive spending on advertising and promotions.
CBRE’s EPS grew at a weak 14.3% compounded annual growth rate over the last five years. This performance was better than its flat revenue but doesn’t tell us much about its business quality because its operating margin didn’t improve.
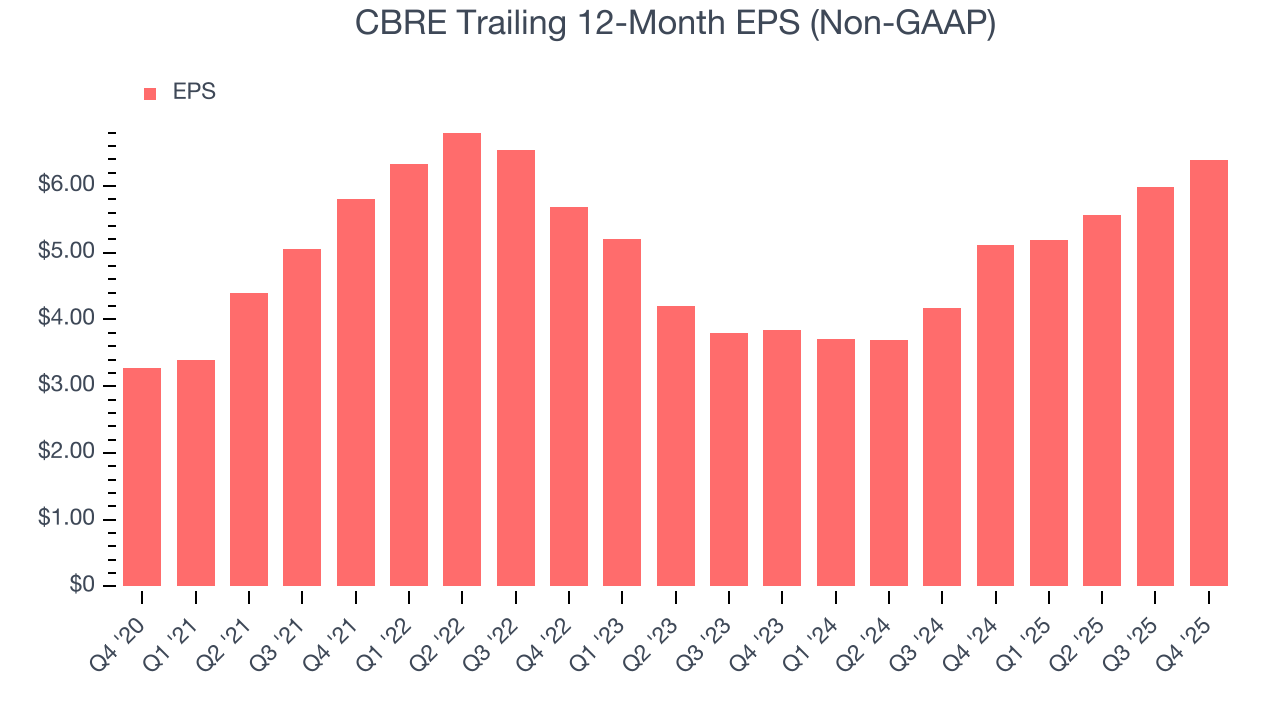
In Q4, CBRE reported adjusted EPS of $2.73, up from $2.32 in the same quarter last year. This print beat analysts’ estimates by 2%. Over the next 12 months, Wall Street expects CBRE’s full-year EPS of $6.39 to grow 14.8%.
8. Cash Is King
If you’ve followed StockStory for a while, you know we emphasize free cash flow. Why, you ask? We believe that in the end, cash is king, and you can’t use accounting profits to pay the bills.
CBRE has shown poor cash profitability over the last two years, giving the company limited opportunities to return capital to shareholders. Its free cash flow margin averaged 3.8%, lousy for a consumer discretionary business.
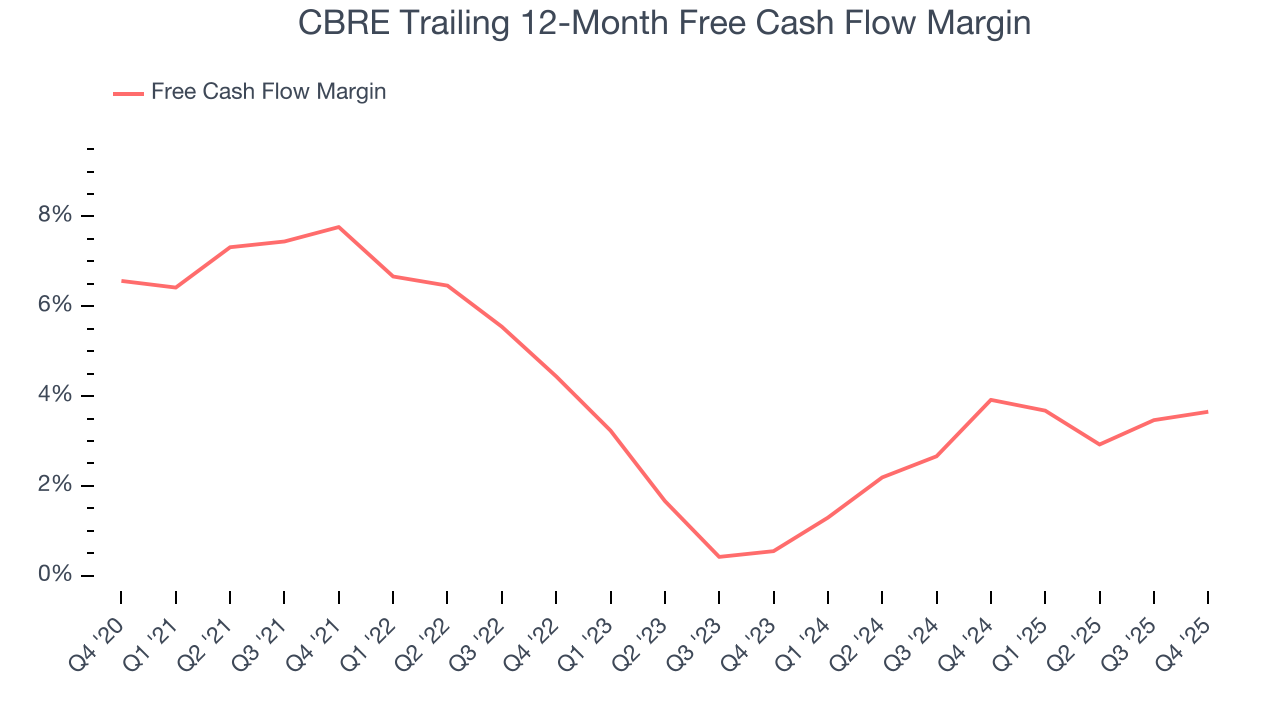
CBRE’s free cash flow clocked in at $1.37 billion in Q4, equivalent to a 11.7% margin. This cash profitability was in line with the comparable period last year and above its two-year average.
9. Return on Invested Capital (ROIC)
EPS and free cash flow tell us whether a company was profitable while growing its revenue. But was it capital-efficient? A company’s ROIC explains this by showing how much operating profit it makes compared to the money it has raised (debt and equity).
CBRE historically did a mediocre job investing in profitable growth initiatives. Its five-year average ROIC was 9.6%, somewhat low compared to the best consumer discretionary companies that consistently pump out 25%+.
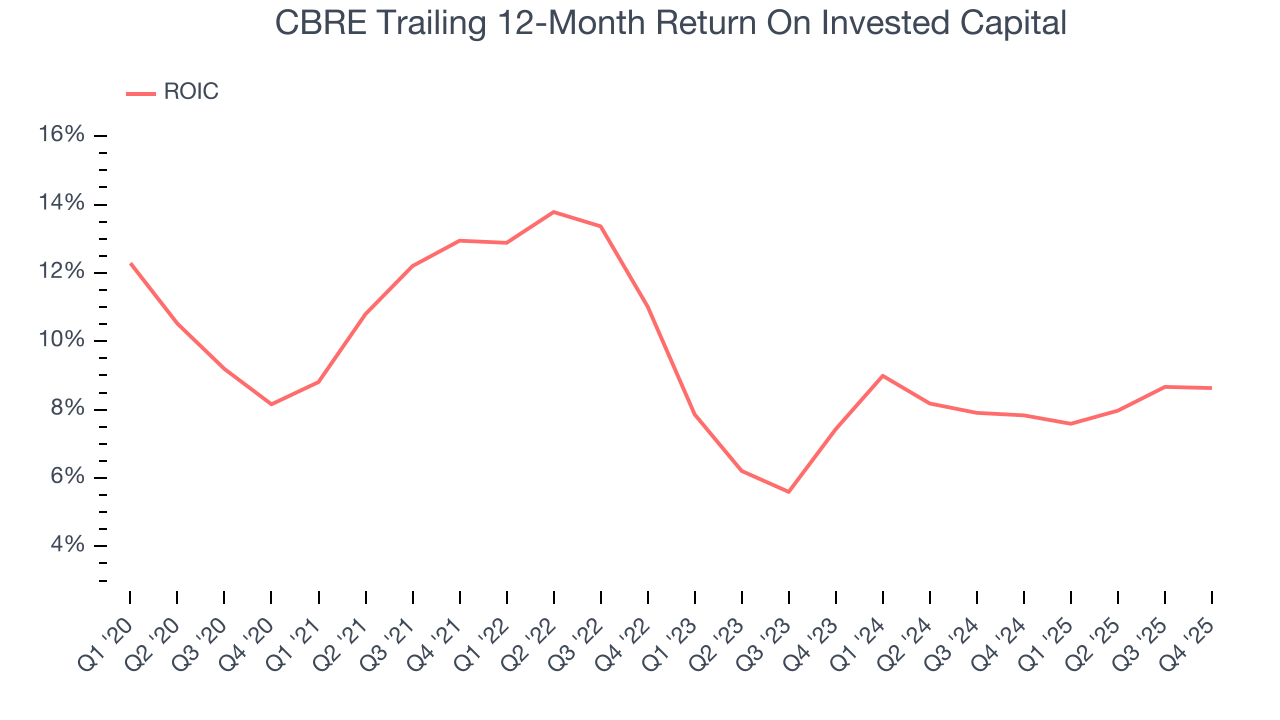
We like to invest in businesses with high returns, but the trend in a company’s ROIC is what often surprises the market and moves the stock price. Unfortunately, CBRE’s ROIC averaged 3.7 percentage point decreases each year over the last few years. Paired with its already low returns, these declines suggest its profitable growth opportunities are few and far between.
10. Balance Sheet Assessment
CBRE reported $2.01 billion of cash and $9.99 billion of debt on its balance sheet in the most recent quarter. As investors in high-quality companies, we primarily focus on two things: 1) that a company’s debt level isn’t too high and 2) that its interest payments are not excessively burdening the business.
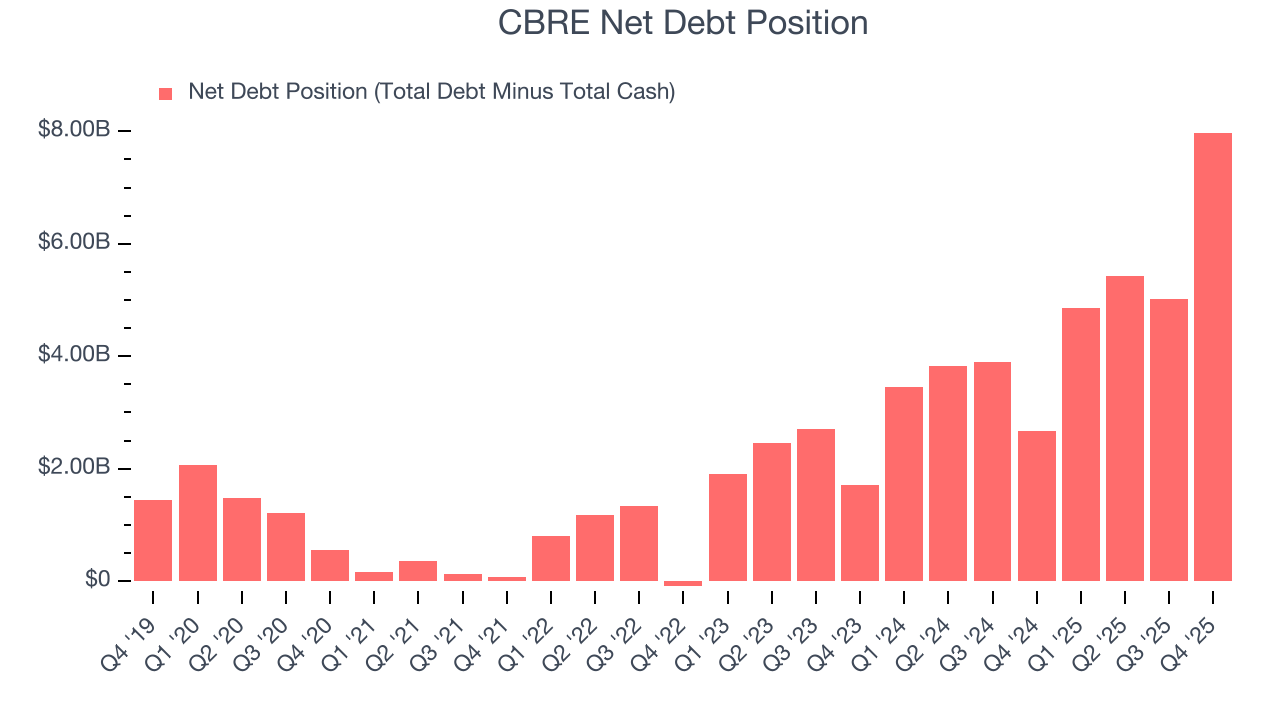
With $3.31 billion of EBITDA over the last 12 months, we view CBRE’s 2.4× net-debt-to-EBITDA ratio as safe. We also see its $102 million of annual interest expenses as appropriate. The company’s profits give it plenty of breathing room, allowing it to continue investing in growth initiatives.
11. Key Takeaways from CBRE’s Q4 Results
It was encouraging to see CBRE beat analysts’ EPS expectations this quarter on in-line revenue. On the other hand, EPS guidance missed. Zooming out, we think this was a mixed quarter. The stock traded up 2.1% to $152.60 immediately after reporting.
12. Is Now The Time To Buy CBRE?
Updated: March 15, 2026 at 10:59 PM EDT
Before investing in or passing on CBRE, we urge you to understand the company’s business quality (or lack thereof), valuation, and the latest quarterly results - in that order.
We see the value of companies helping consumers, but in the case of CBRE, we’re out. On top of that, CBRE’s Forecasted free cash flow margin suggests the company will have more capital to invest or return to shareholders next year, and its weak EPS growth over the last five years shows it’s failed to produce meaningful profits for shareholders.
CBRE’s P/E ratio based on the next 12 months is 17.5x. This valuation tells us a lot of optimism is priced in - you can find more timely opportunities elsewhere.
Wall Street analysts have a consensus one-year price target of $178.83 on the company (compared to the current share price of $132.00).
Although the price target is bullish, readers should exercise caution because analysts tend to be overly optimistic. The firms they work for, often big banks, have relationships with companies that extend into fundraising, M&A advisory, and other rewarding business lines. As a result, they typically hesitate to say bad things for fear they will lose out. We at StockStory do not suffer from such conflicts of interest, so we’ll always tell it like it is.