
Carnival (CCL)
Carnival keeps us up at night. Not only has its sales growth been weak but also its negative returns on capital show it destroyed value.― StockStory Analyst Team
1. News


2. Summary
Why We Think Carnival Will Underperform
Boasting outrageous amenities like a planetarium on board its ships, Carnival (NYSE:CCL) is one of the world's largest leisure travel companies and a prominent player in the cruise industry.
- Annual sales growth of 11% over the last two years lagged behind its consumer discretionary peers as its large revenue base made it difficult to generate incremental demand
- Poor free cash flow generation means it has few chances to reinvest for growth, repurchase shares, or distribute capital
- Negative returns on capital show management lost money while trying to expand the business


Carnival doesn’t pass our quality test. There are more promising alternatives.
Why There Are Better Opportunities Than Carnival


At $24.50 per share, Carnival trades at 10.1x forward P/E. This multiple is cheaper than most consumer discretionary peers, but we think this is justified.
Cheap stocks can look like great bargains at first glance, but you often get what you pay for. These mediocre businesses often have less earnings power, meaning there is more reliance on a re-rating to generate good returns - an unlikely scenario for low-quality companies.
3. Carnival (CCL) Research Report: Q4 CY2025 Update
Cruise ship company Carnival (NYSE:CCL) fell short of the markets revenue expectations in Q4 CY2025, but sales rose 6.6% year on year to $6.33 billion. Its non-GAAP profit of $0.34 per share was 38.6% above analysts’ consensus estimates.
Carnival (CCL) Q4 CY2025 Highlights:
- Revenue: $6.33 billion vs analyst estimates of $6.37 billion (6.6% year-on-year growth, 0.6% miss)
- Adjusted EPS: $0.34 vs analyst estimates of $0.25 (38.6% beat)
- Adjusted EBITDA: $1.48 billion vs analyst estimates of $1.37 billion (23.3% margin, 8.1% beat)
- Adjusted EPS guidance for the upcoming financial year 2026 is $2.48 at the midpoint, beating analyst estimates by 2.5%
- EBITDA guidance for the upcoming financial year 2026 is $7.63 billion at the midpoint, above analyst estimates of $7.53 billion
- Operating Margin: 11.6%, up from 9.4% in the same quarter last year
- Free Cash Flow Margin: 0.2%, down from 5.3% in the same quarter last year
- Passenger Cruise Days: 24.6 million, in line with the same quarter last year
- Market Capitalization: $36.96 billion
Company Overview
Boasting outrageous amenities like a planetarium on board its ships, Carnival (NYSE:CCL) is one of the world's largest leisure travel companies and a prominent player in the cruise industry.
Carnival operates a vast fleet of ~90 ships, each offering a range of cruise experiences to suit various traveler preferences. Its portfolio consists of nine brands, including its flagship Carnival Cruise Line along with Princess Cruises, Holland America Line, Seabourn, Costa Cruises, AIDA Cruises, P&O Cruises (UK), and Cunard. Each brand has its unique identity and market segment, ranging from fun and family-friendly to luxury and exotic.
On its cruises, the company offers comprehensive packages of entertainment, dining, accommodation, and activities. Its fleet travels to many destinations around the world, including the Caribbean, Alaska, Europe, South America, and Asia-Pacific regions.
Carnival's flagship brand, Carnival Cruise Line, accounts for a majority of its revenue and prides itself on affordability, catering to the mass market. Its number two and three brands by revenue are Princess Cruises and Holland America Line, which are also reasonably priced. As such, the company's marketing strategy emphasizes the value and convenience of its cruise vacations compared to traditional land-based holidays.
4. Travel and Vacation Providers
Airlines, hotels, resorts, and cruise line companies often sell experiences rather than tangible products, and in the last decade-plus, consumers have slowly shifted from buying "things" (wasteful) to buying "experiences" (memorable). In addition, the internet has introduced new ways of approaching leisure and lodging such as booking homes and longer-term accommodations. Traditional airlines, hotel, resorts, and cruise line companies must innovate to stay relevant in a market rife with innovation.
Carnival Corporation (NYSE:CCL) primary competitors include Royal Caribbean (NYSE:RCL), Norwegian Cruise Line (NYSE:NCLH), Disney Cruise Line (owned by Disney, NYSE:DIS), and private companies Viking Cruises and MSC Cruises.
5. Revenue Growth
A company’s long-term sales performance is one signal of its overall quality. Even a bad business can shine for one or two quarters, but a top-tier one grows for years. Over the last five years, Carnival grew its sales at a 36.6% compounded annual growth rate. Although this growth is acceptable on an absolute basis, it fell slightly short of our standards for the consumer discretionary sector, which enjoys a number of secular tailwinds.
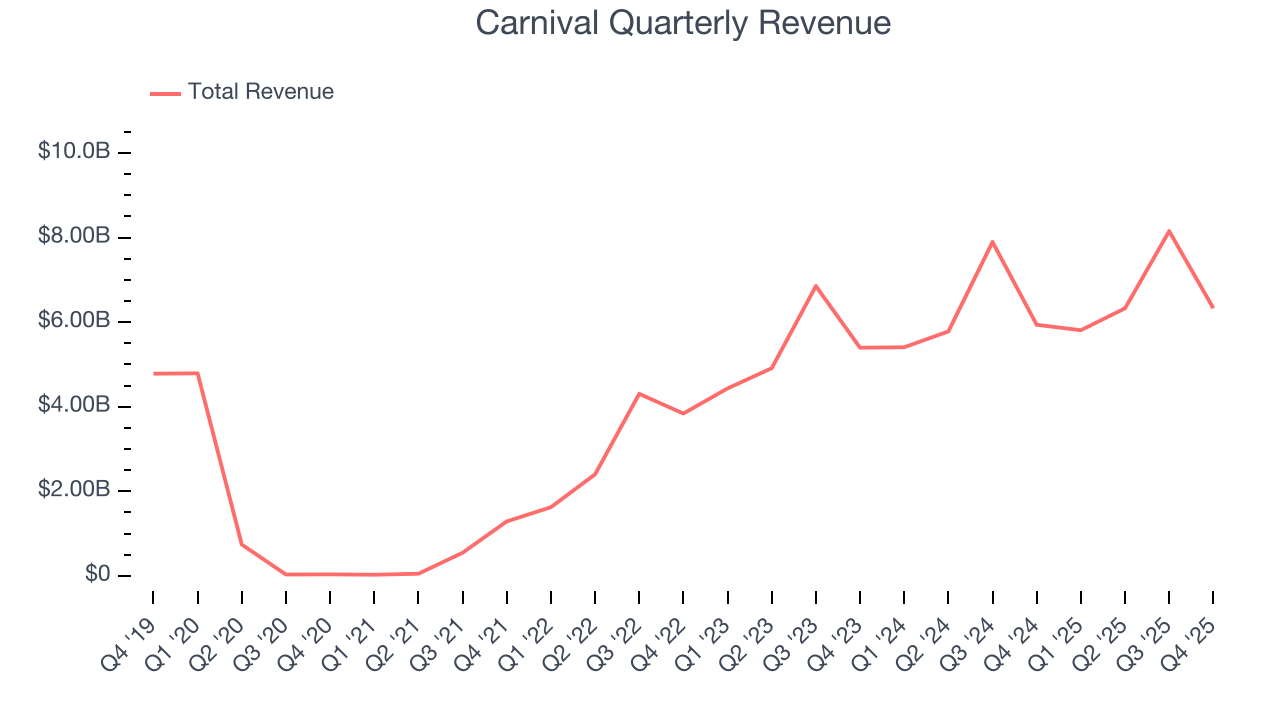
We at StockStory place the most emphasis on long-term growth, but within consumer discretionary, a stretched historical view may miss a company riding a successful new property or trend. Carnival’s recent performance shows its demand has slowed as its annualized revenue growth of 11% over the last two years was below its five-year trend. 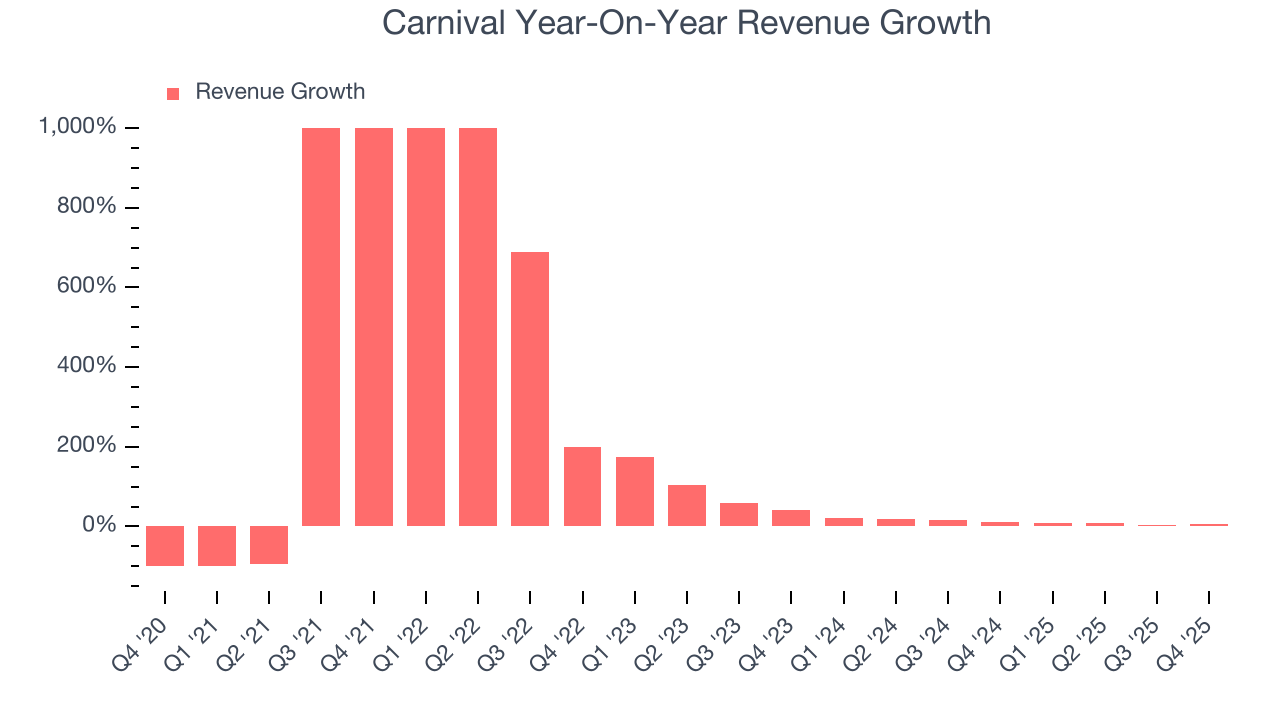
We can better understand the company’s revenue dynamics by analyzing its number of passenger cruise days, which reached 24.6 million in the latest quarter. Over the last two years, Carnival’s passenger cruise days averaged 5.8% year-on-year growth. Because this number is lower than its revenue growth during the same period, we can see the company’s monetization has risen. 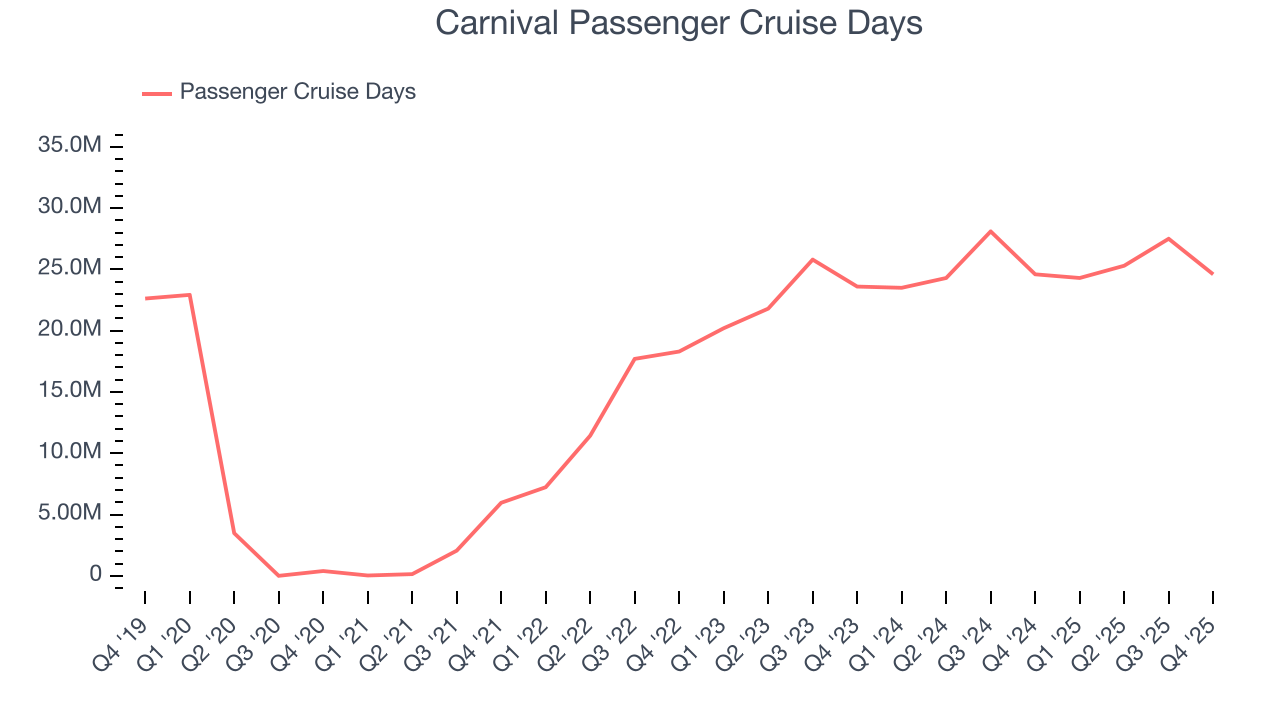
This quarter, Carnival’s revenue grew by 6.6% year on year to $6.33 billion, missing Wall Street’s estimates.
Looking ahead, sell-side analysts expect revenue to grow 4.3% over the next 12 months, a deceleration versus the last two years. This projection doesn't excite us and indicates its products and services will face some demand challenges.
6. Operating Margin
Carnival’s operating margin has been trending up over the last 12 months and averaged 15.6% over the last two years. The company’s higher efficiency is a breath of fresh air, but its suboptimal cost structure means it still sports inadequate profitability for a consumer discretionary business.
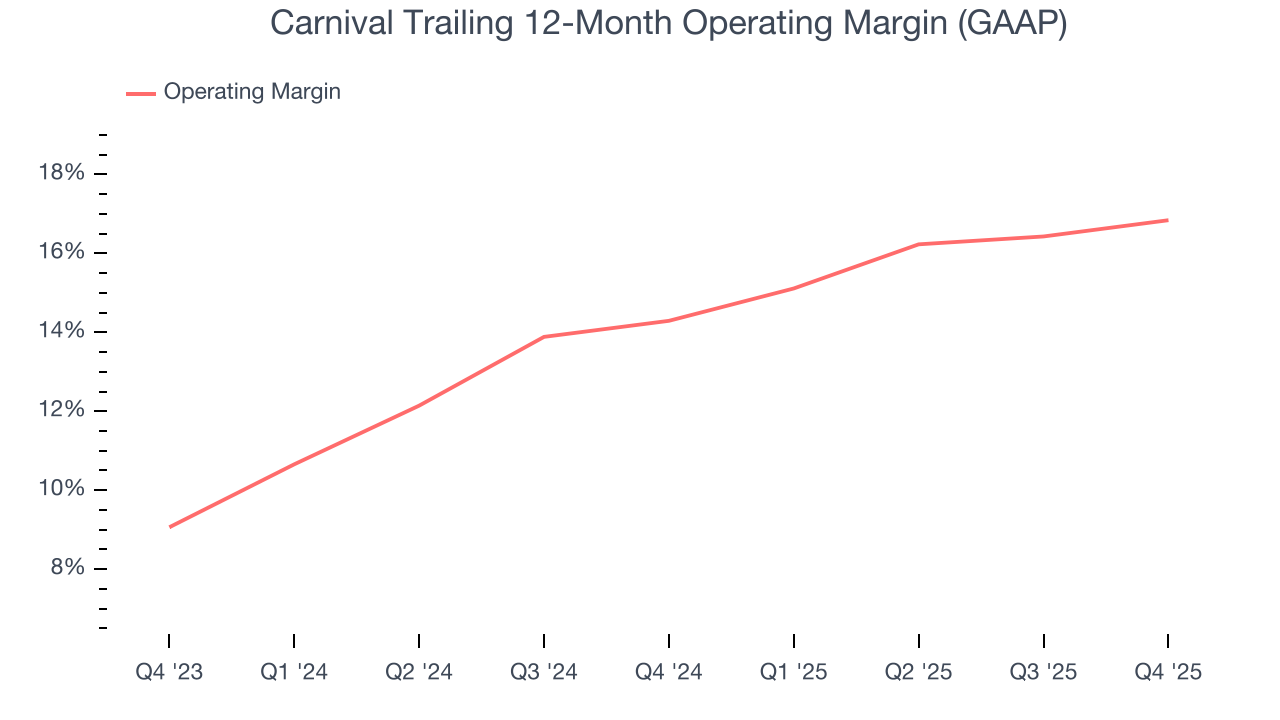
This quarter, Carnival generated an operating margin profit margin of 11.6%, up 2.2 percentage points year on year. This increase was a welcome development and shows it was more efficient.
7. Earnings Per Share
Revenue trends explain a company’s historical growth, but the long-term change in earnings per share (EPS) points to the profitability of that growth – for example, a company could inflate its sales through excessive spending on advertising and promotions.
Carnival’s full-year EPS flipped from negative to positive over the last five years. This is encouraging and shows it’s at a critical moment in its life.
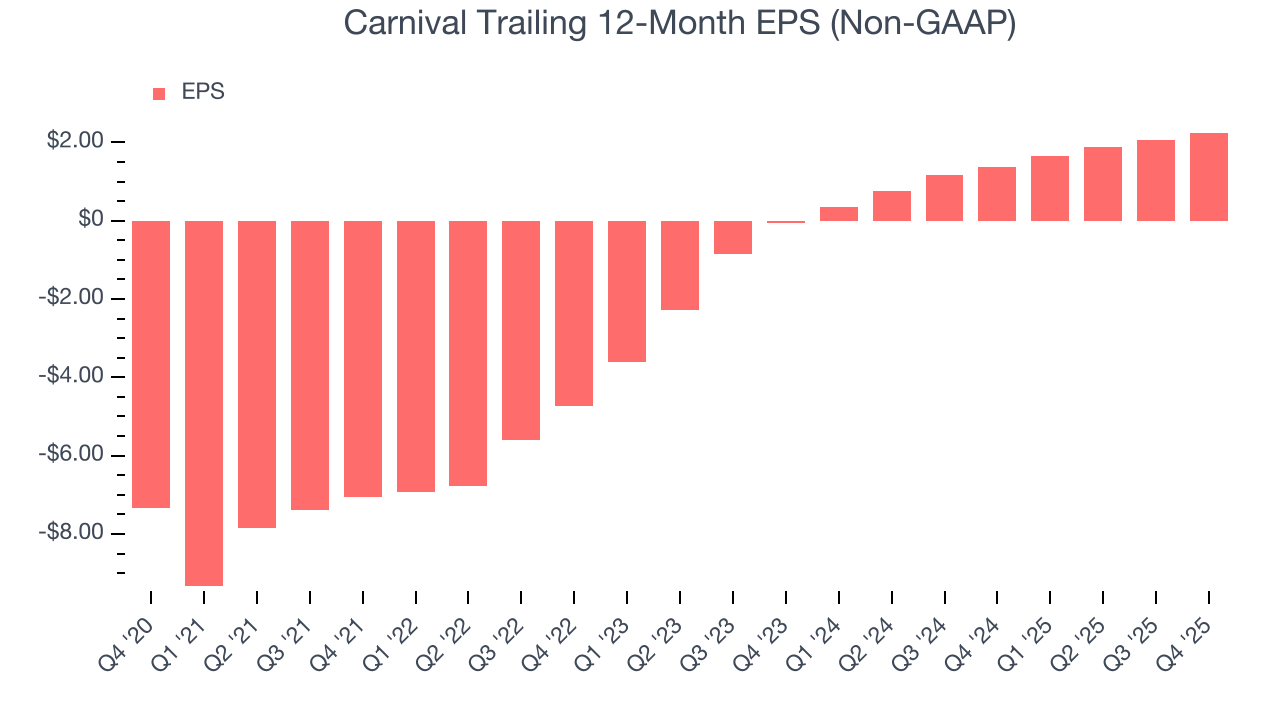
In Q4, Carnival reported adjusted EPS of $0.34, up from $0.14 in the same quarter last year. This print easily cleared analysts’ estimates, and shareholders should be content with the results. Over the next 12 months, Wall Street expects Carnival’s full-year EPS of $2.25 to grow 7.5%.
8. Cash Is King
If you’ve followed StockStory for a while, you know we emphasize free cash flow. Why, you ask? We believe that in the end, cash is king, and you can’t use accounting profits to pay the bills.
Carnival has shown poor cash profitability over the last two years, giving the company limited opportunities to return capital to shareholders. Its free cash flow margin averaged 7.6%, lousy for a consumer discretionary business.
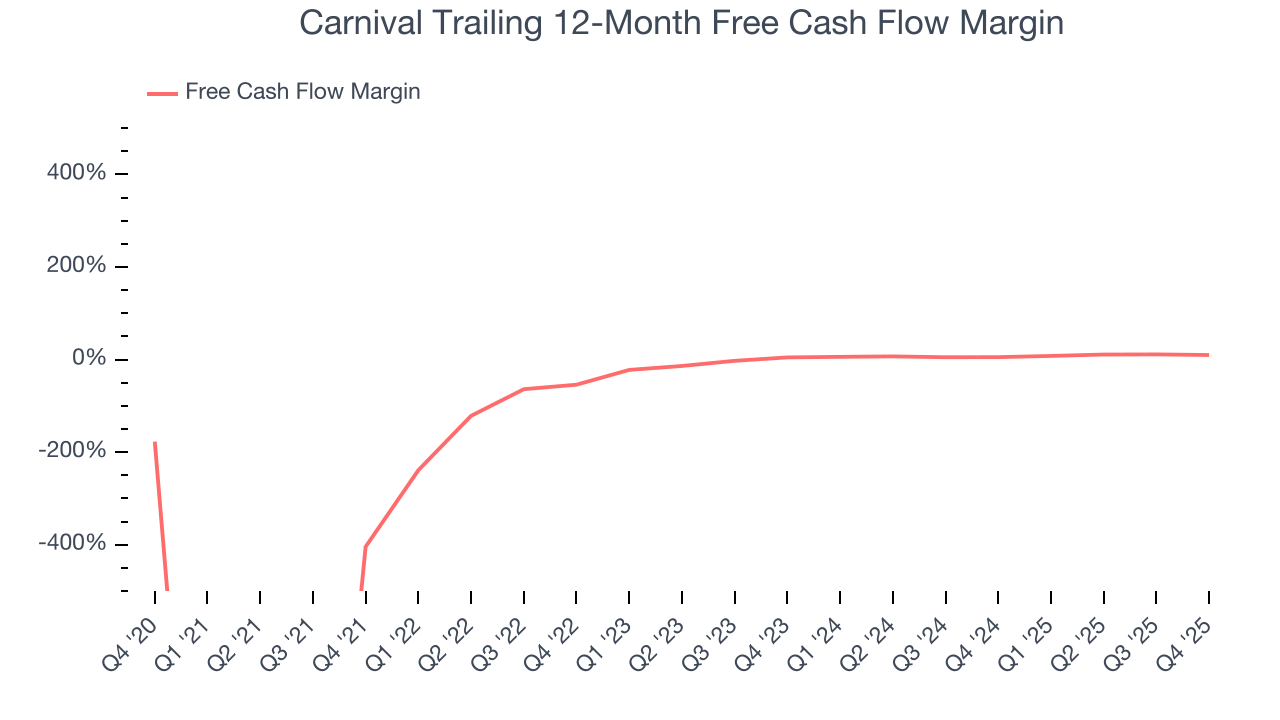
Carnival broke even from a free cash flow perspective in Q4. The company’s cash profitability regressed as it was 5.1 percentage points lower than in the same quarter last year, prompting us to pay closer attention. Short-term fluctuations typically aren’t a big deal because investment needs can be seasonal, but we’ll be watching to see if the trend extrapolates into future quarters.
Over the next year, analysts predict Carnival’s cash conversion will improve. Their consensus estimates imply its free cash flow margin of 9.8% for the last 12 months will increase to 15.4%, it options for capital deployment (investments, share buybacks, etc.).
9. Return on Invested Capital (ROIC)
EPS and free cash flow tell us whether a company was profitable while growing its revenue. But was it capital-efficient? A company’s ROIC explains this by showing how much operating profit it makes compared to the money it has raised (debt and equity).
Carnival’s five-year average ROIC was negative 1%, meaning management lost money while trying to expand the business. Its returns were among the worst in the consumer discretionary sector.
We like to invest in businesses with high returns, but the trend in a company’s ROIC is what often surprises the market and moves the stock price. Over the last few years, Carnival’s ROIC has increased. This is a good sign, but we recognize its lack of profitable growth during the COVID era was the primary reason for the change.
10. Balance Sheet Assessment
Carnival reported $1.93 billion of cash and $27.99 billion of debt on its balance sheet in the most recent quarter. As investors in high-quality companies, we primarily focus on two things: 1) that a company’s debt level isn’t too high and 2) that its interest payments are not excessively burdening the business.
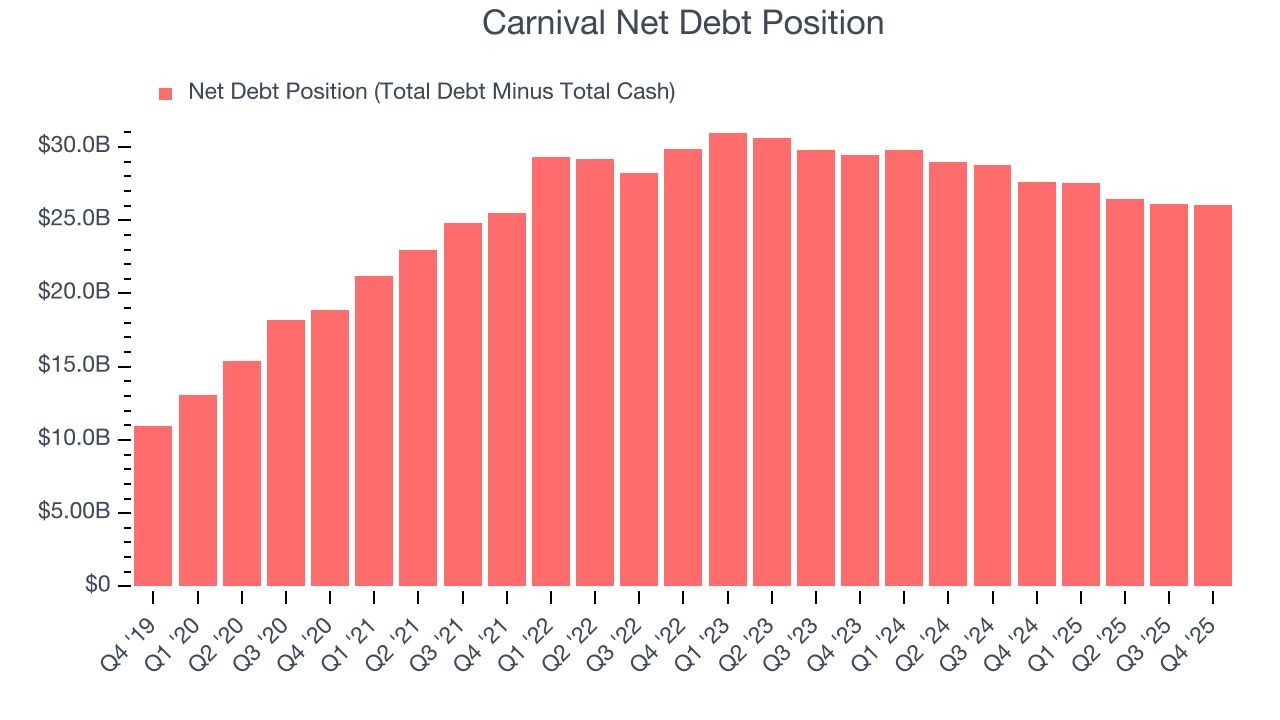
With $7.18 billion of EBITDA over the last 12 months, we view Carnival’s 3.6× net-debt-to-EBITDA ratio as safe. We also see its $703 million of annual interest expenses as appropriate. The company’s profits give it plenty of breathing room, allowing it to continue investing in growth initiatives.
11. Key Takeaways from Carnival’s Q4 Results
It was good to see Carnival beat analysts’ EPS expectations this quarter. We were also happy its EBITDA outperformed Wall Street’s estimates. On the other hand, its number of passenger cruise days missed and its EBITDA guidance for next quarter fell short of Wall Street’s estimates. Overall, this print was mixed but still had some key positives.
12. Is Now The Time To Buy Carnival?
Updated: March 21, 2026 at 10:46 PM EDT
Before deciding whether to buy Carnival or pass, we urge investors to consider business quality, valuation, and the latest quarterly results.
Carnival falls short of our quality standards. On top of that, Carnival’s projected EPS for the next year is lacking, and its relatively low ROIC suggests management has struggled to find compelling investment opportunities.
Carnival’s P/E ratio based on the next 12 months is 10.1x. While this valuation is reasonable, we don’t see a big opportunity at the moment. There are more exciting stocks to buy at the moment.
Wall Street analysts have a consensus one-year price target of $37.35 on the company (compared to the current share price of $24.50).
Although the price target is bullish, readers should exercise caution because analysts tend to be overly optimistic. The firms they work for, often big banks, have relationships with companies that extend into fundraising, M&A advisory, and other rewarding business lines. As a result, they typically hesitate to say bad things for fear they will lose out. We at StockStory do not suffer from such conflicts of interest, so we’ll always tell it like it is.