
Carnival (CCL)
Carnival faces an uphill battle. Its underwhelming returns on capital show it struggled to generate meaningful profits for shareholders.― StockStory Analyst Team
1. News
2. Summary
Why We Think Carnival Will Underperform
Boasting outrageous amenities like a planetarium on board its ships, Carnival (NYSE:CCL) is one of the world's largest leisure travel companies and a prominent player in the cruise industry.
- Scale is a double-edged sword because it limits the company’s growth potential compared to its smaller competitors, as reflected in its below-average annual revenue increases of 9.3% for the last two years
- Poor free cash flow generation means it has few chances to reinvest for growth, repurchase shares, or distribute capital
- Low returns on capital reflect management’s struggle to allocate funds effectively


Carnival doesn’t check our boxes. More profitable opportunities exist elsewhere.
Why There Are Better Opportunities Than Carnival


Carnival is trading at $24.32 per share, or 11.3x forward P/E. This multiple is lower than most consumer discretionary companies, but for good reason.
It’s better to pay up for high-quality businesses with higher long-term earnings potential rather than to buy lower-quality stocks because they appear cheap. These challenged businesses often don’t re-rate, a phenomenon known as a “value trap”.
3. Carnival (CCL) Research Report: Q1 CY2026 Update
Cruise ship company Carnival (NYSE:CCL) beat Wall Street’s revenue expectations in Q1 CY2026, with sales up 6.1% year on year to $6.17 billion. Its non-GAAP profit of $0.20 per share was 8.9% above analysts’ consensus estimates.
Carnival (CCL) Q1 CY2026 Highlights:
- Revenue: $6.17 billion vs analyst estimates of $6.13 billion (6.1% year-on-year growth, beat)
- Adjusted EPS: $0.20 vs analyst estimates of $0.18 (8.9% beat)
- Adjusted EBITDA: $1.27 billion vs analyst estimates of $1.26 billion (20.6% margin, in line)
- Management lowered its full-year Adjusted EPS guidance to $2.21 at the midpoint, a 10.9% decrease
- EBITDA guidance for the full year is $7.19 billion at the midpoint, below analyst estimates of $7.48 billion
- Operating Margin: 9.8%, in line with the same quarter last year
- Free Cash Flow Margin: 11.3%, up from 5.5% in the same quarter last year
- Passenger Cruise Days: in line with the same quarter last year
- Market Capitalization: $35.02 billion
Company Overview
Boasting outrageous amenities like a planetarium on board its ships, Carnival (NYSE:CCL) is one of the world's largest leisure travel companies and a prominent player in the cruise industry.
Carnival operates a vast fleet of ~90 ships, each offering a range of cruise experiences to suit various traveler preferences. Its portfolio consists of nine brands, including its flagship Carnival Cruise Line along with Princess Cruises, Holland America Line, Seabourn, Costa Cruises, AIDA Cruises, P&O Cruises (UK), and Cunard. Each brand has its unique identity and market segment, ranging from fun and family-friendly to luxury and exotic.
On its cruises, the company offers comprehensive packages of entertainment, dining, accommodation, and activities. Its fleet travels to many destinations around the world, including the Caribbean, Alaska, Europe, South America, and Asia-Pacific regions.
Carnival's flagship brand, Carnival Cruise Line, accounts for a majority of its revenue and prides itself on affordability, catering to the mass market. Its number two and three brands by revenue are Princess Cruises and Holland America Line, which are also reasonably priced. As such, the company's marketing strategy emphasizes the value and convenience of its cruise vacations compared to traditional land-based holidays.
4. Consumer Discretionary - Travel and Vacation Providers
The Consumer Discretionary sector, by definition, is made up of companies selling non-essential goods and services. When economic conditions deteriorate or tastes shift, consumers can easily cut back or eliminate these purchases. For long-term investors with five-year holding periods, this creates a structural challenge: the sector is inherently hit-driven, with low switching costs and fickle customers. As a result, only a handful of companies can reliably grow demand and compound earnings over long periods, which is why our bar is high and High Quality ratings are rare.
Travel and vacation providers operate tour packages, cruise lines, online travel agencies, and vacation rental platforms, connecting consumers with leisure and business travel experiences. Tailwinds include robust post-pandemic travel demand, a consumer preference shift toward experiences over goods, and technology-enabled personalization improving conversion and loyalty. However, headwinds are significant: the industry is acutely sensitive to macroeconomic cycles, geopolitical instability, and fuel price volatility. Low switching costs mean fierce price competition, while capacity additions in segments like cruises can lead to oversupply. Regulatory burdens, weather disruptions, and public health risks further create episodic but potentially severe demand shocks.
Carnival Corporation (NYSE:CCL) primary competitors include Royal Caribbean (NYSE:RCL), Norwegian Cruise Line (NYSE:NCLH), Disney Cruise Line (owned by Disney, NYSE:DIS), and private companies Viking Cruises and MSC Cruises.
5. Revenue Growth
Examining a company’s long-term performance can provide clues about its quality. Any business can put up a good quarter or two, but many enduring ones grow for years. Thankfully, Carnival’s 101% annualized revenue growth over the last five years was incredible. Its growth beat the average consumer discretionary company and shows its offerings resonate with customers.
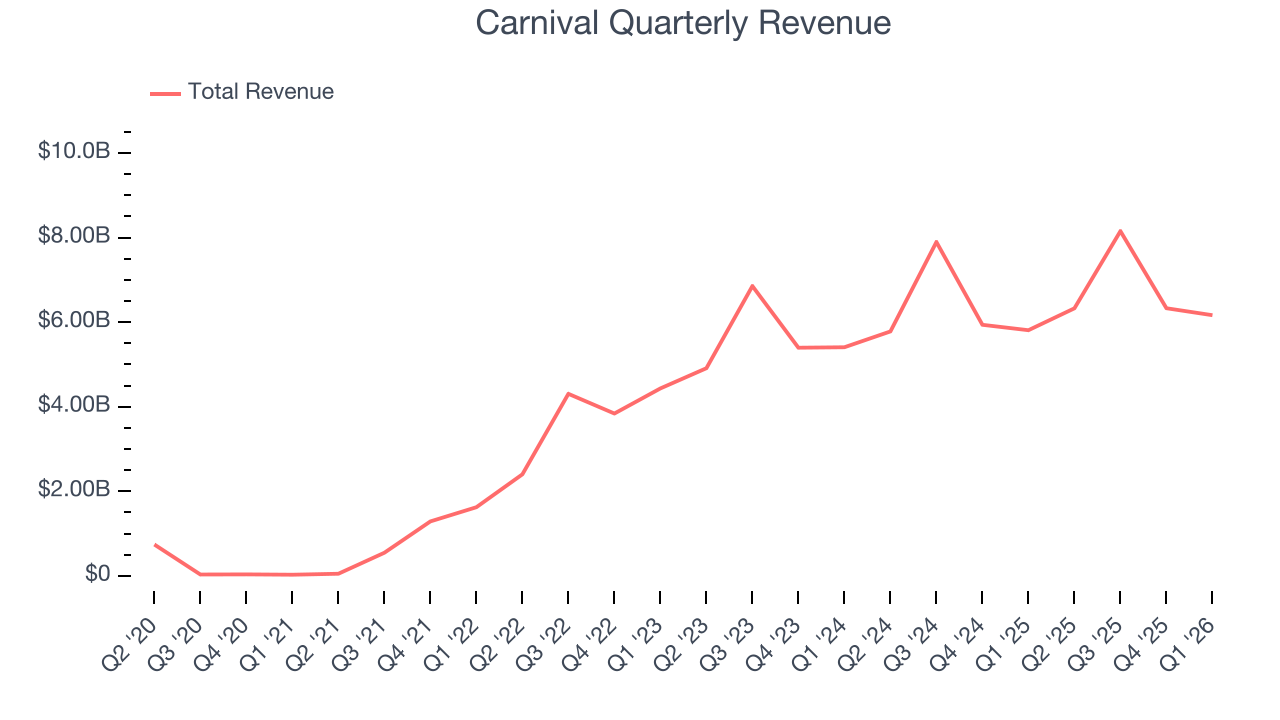
We at StockStory place the most emphasis on long-term growth, but within consumer discretionary, a stretched historical view may miss a company riding a successful new property or trend. Carnival’s recent performance shows its demand has slowed significantly as its annualized revenue growth of 9.3% over the last two years was well below its five-year trend. 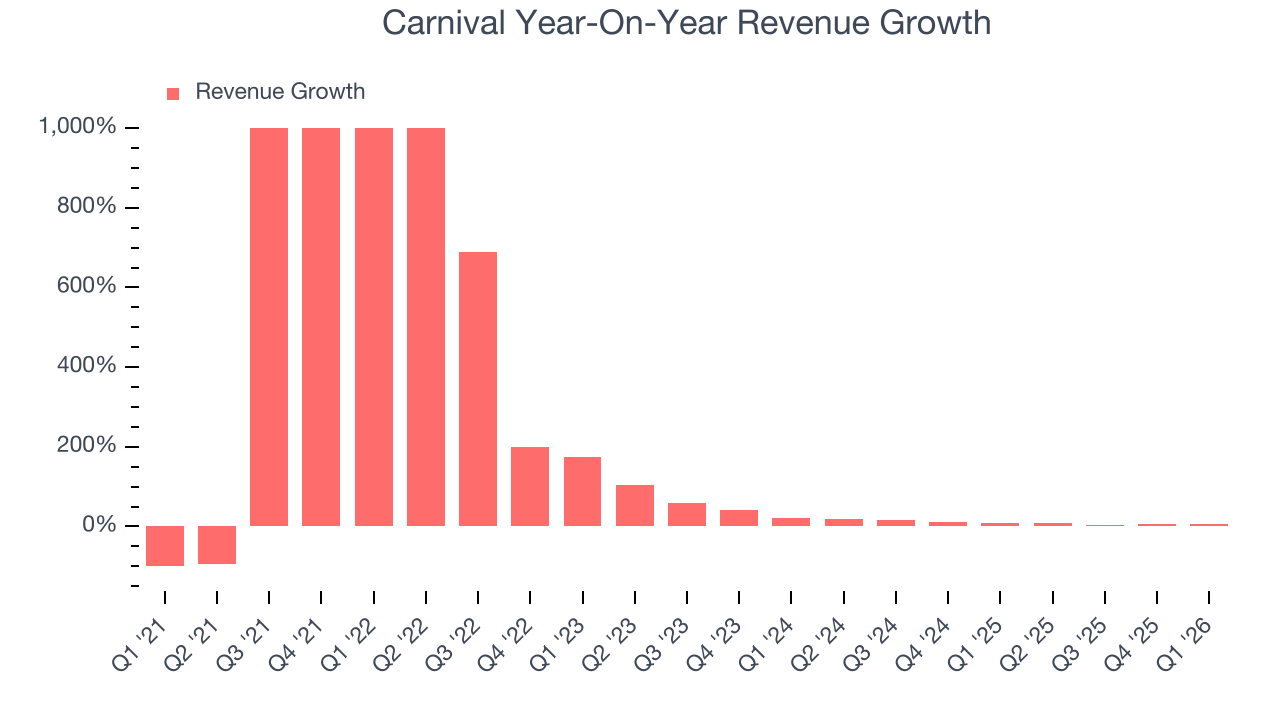
We can dig further into the company’s revenue dynamics by analyzing its number of passenger cruise days, which reached 24.4 million in the latest quarter. Over the last two years, Carnival’s passenger cruise days averaged 1.2% year-on-year growth. Because this number is lower than its revenue growth during the same period, we can see the company’s monetization has risen. 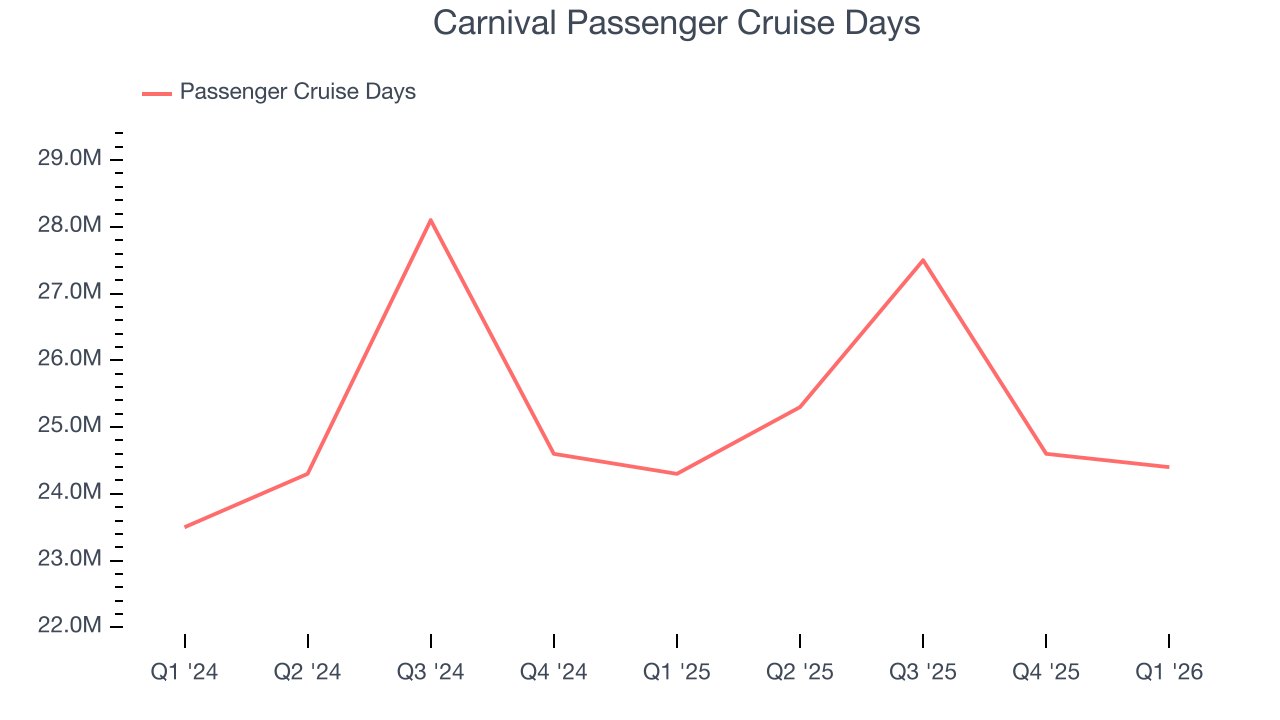
This quarter, Carnival grew its revenue by 6.1% year on year, and its $6.17 billion of revenue was in line with Wall Street’s estimates.
Looking ahead, sell-side analysts expect revenue to grow 3.8% over the next 12 months, a deceleration versus the last two years. This projection doesn't excite us and suggests its products and services will see some demand headwinds.
6. Operating Margin
Operating margin is an important measure of profitability as it shows the portion of revenue left after accounting for all core expenses – everything from the cost of goods sold to advertising and wages. It’s also useful for comparing profitability across companies with different levels of debt and tax rates because it excludes interest and taxes.
Carnival’s operating margin has been trending up over the last 12 months and averaged 16% over the last two years. The company’s higher efficiency is a breath of fresh air, but its suboptimal cost structure means it still sports inadequate profitability for a consumer discretionary business.
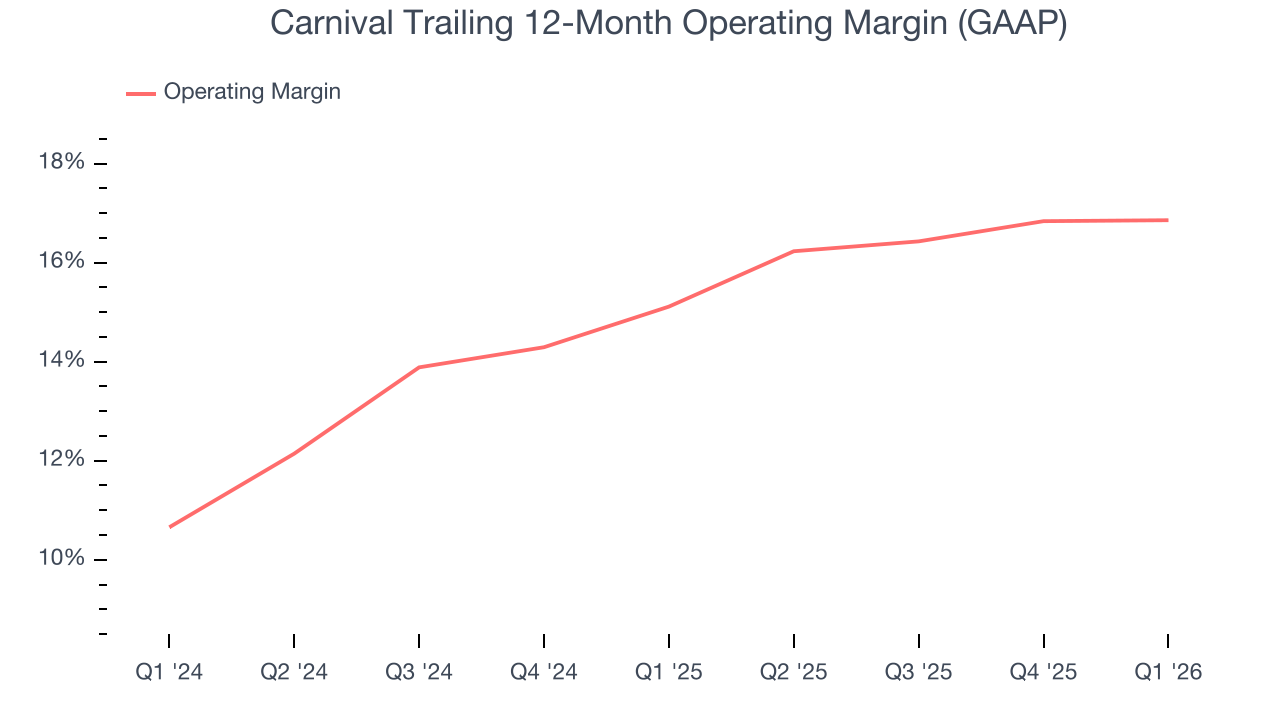
In Q1, Carnival generated an operating margin profit margin of 9.8%, in line with the same quarter last year. This indicates the company’s overall cost structure has been relatively stable.
7. Earnings Per Share
We track the long-term change in earnings per share (EPS) for the same reason as long-term revenue growth. Compared to revenue, however, EPS highlights whether a company’s growth is profitable.
Carnival’s full-year EPS flipped from negative to positive over the last five years. This is encouraging and shows it’s at a critical moment in its life.
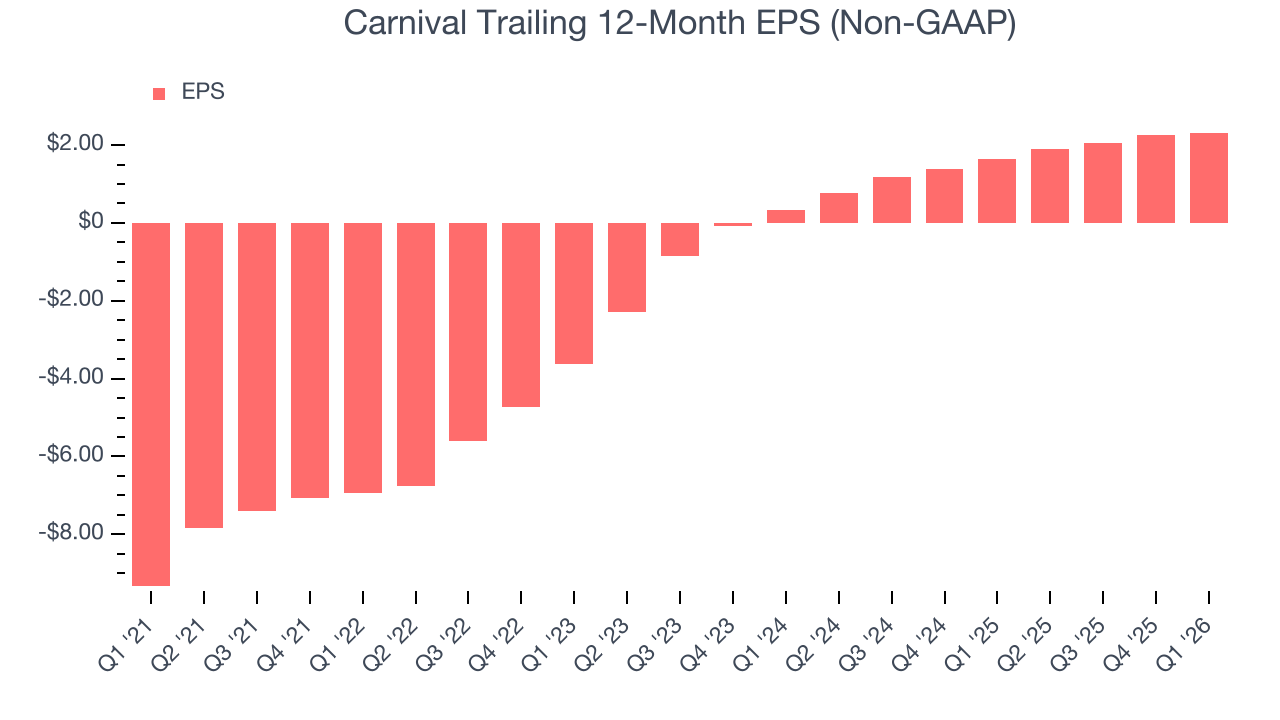
In Q1, Carnival reported adjusted EPS of $0.20, up from $0.13 in the same quarter last year. This print beat analysts’ estimates by 8.9%. Over the next 12 months, Wall Street expects Carnival’s full-year EPS of $2.32 to shrink by 1%.
8. Cash Is King
Although earnings are undoubtedly valuable for assessing company performance, we believe cash is king because you can’t use accounting profits to pay the bills.
Carnival has shown poor cash profitability relative to peers over the last two years, giving the company fewer opportunities to return capital to shareholders. Its free cash flow margin averaged 9.5%, below what we’d expect for a consumer discretionary business.
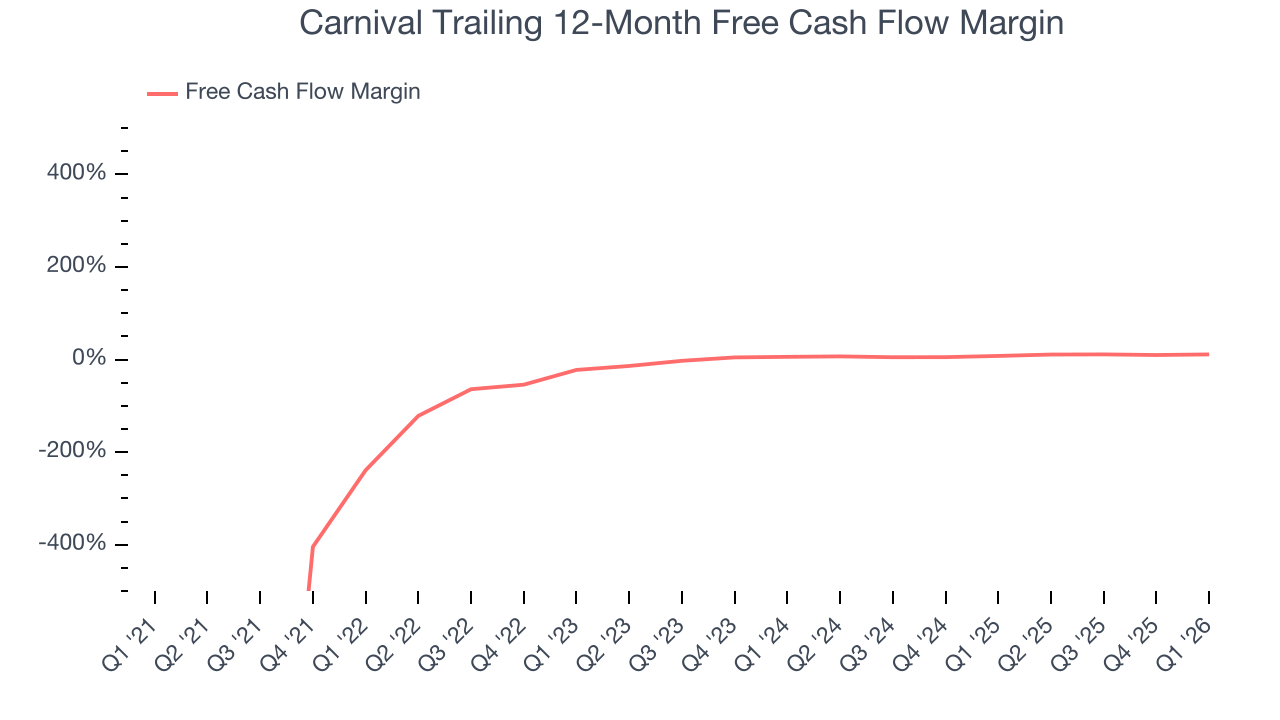
Carnival’s free cash flow clocked in at $697 million in Q1, equivalent to a 11.3% margin. This result was good as its margin was 5.8 percentage points higher than in the same quarter last year, but we wouldn’t read too much into the short term because investment needs can be seasonal, leading to temporary swings. Long-term trends carry greater meaning.
Over the next year, analysts predict Carnival’s cash conversion will improve. Their consensus estimates imply its free cash flow margin of 11.1% for the last 12 months will increase to 13.5%, it options for capital deployment (investments, share buybacks, etc.).
9. Return on Invested Capital (ROIC)
EPS and free cash flow tell us whether a company was profitable while growing its revenue. But was it capital-efficient? A company’s ROIC explains this by showing how much operating profit it makes compared to the money it has raised (debt and equity).
Carnival historically did a mediocre job investing in profitable growth initiatives. Its five-year average ROIC was 0.1%, lower than the typical cost of capital (how much it costs to raise money) for consumer discretionary companies.
We like to invest in businesses with high returns, but the trend in a company’s ROIC is what often surprises the market and moves the stock price. Over the last few years, Carnival’s ROIC has increased. This is a good sign, but we recognize its lack of profitable growth during the COVID era was the primary reason for the change.
10. Balance Sheet Assessment
Carnival reported $1.42 billion of cash and $26.61 billion of debt on its balance sheet in the most recent quarter. As investors in high-quality companies, we primarily focus on two things: 1) that a company’s debt level isn’t too high and 2) that its interest payments are not excessively burdening the business.
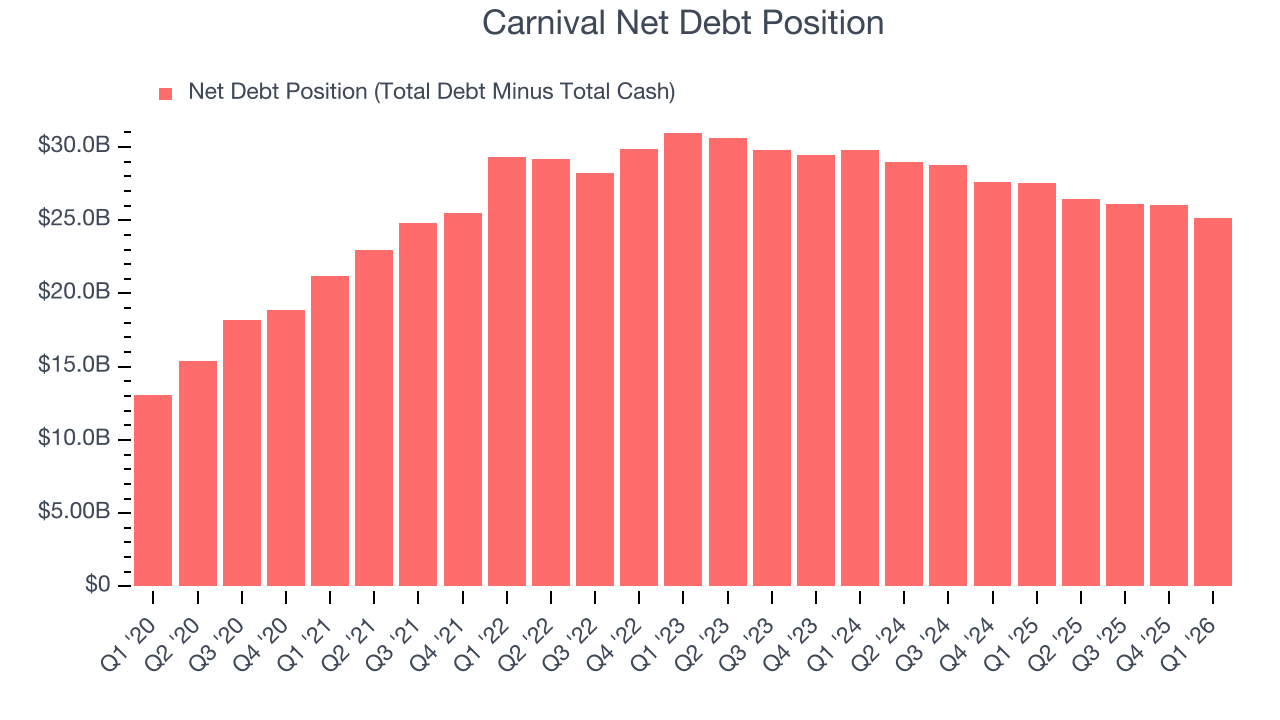
With $7.25 billion of EBITDA over the last 12 months, we view Carnival’s 3.5× net-debt-to-EBITDA ratio as safe. We also see its $650 million of annual interest expenses as appropriate. The company’s profits give it plenty of breathing room, allowing it to continue investing in growth initiatives.
11. Key Takeaways from Carnival’s Q1 Results
It was good to see Carnival beat analysts’ EPS expectations this quarter. On the other hand, its EBITDA guidance for next quarter missed and its full-year EBITDA guidance fell short of Wall Street’s estimates. Overall, this was a weaker quarter. The stock traded down 2.9% to $24.55 immediately following the results.
12. Is Now The Time To Buy Carnival?
Updated: March 28, 2026 at 10:50 PM EDT
When considering an investment in Carnival, investors should account for its valuation and business qualities as well as what’s happened in the latest quarter.
Carnival falls short of our quality standards. Although its revenue growth was exceptional over the last five years, it’s expected to deteriorate over the next 12 months and its number of passenger cruise days has disappointed. On top of that, the company’s projected EPS for the next year is lacking.
Carnival’s P/E ratio based on the next 12 months is 11.3x. While this valuation is reasonable, we don’t see a big opportunity at the moment. There are better investments elsewhere.
Wall Street analysts have a consensus one-year price target of $35.98 on the company (compared to the current share price of $24.32).
Although the price target is bullish, readers should exercise caution because analysts tend to be overly optimistic. The firms they work for, often big banks, have relationships with companies that extend into fundraising, M&A advisory, and other rewarding business lines. As a result, they typically hesitate to say bad things for fear they will lose out. We at StockStory do not suffer from such conflicts of interest, so we’ll always tell it like it is.