Carter's (CRI)
Carter's faces an uphill battle. Its low returns on capital and plummeting sales suggest it struggles to generate demand and profits, a red flag.― StockStory Analyst Team
1. News


2. Summary
Why We Think Carter's Will Underperform
Rumored to sell more than 10 products for every child born in the United States, Carter's (NYSE:CRI) is an American designer and marketer of children's apparel.
- Sales stagnated over the last five years and signal the need for new growth strategies
- Performance over the past five years shows each sale was less profitable, as its earnings per share fell by 3.5% annually
- Subpar operating margin constrains its ability to invest in process improvements or effectively respond to new competitive threats


Carter's doesn’t fulfill our quality requirements. More profitable opportunities exist elsewhere.
Why There Are Better Opportunities Than Carter's


Carter's is trading at $34.83 per share, or 11.3x forward P/E. Carter’s valuation may seem like a bargain, especially when stacked up against other consumer discretionary companies. We remind you that you often get what you pay for, though.
It’s better to pay up for high-quality businesses with higher long-term earnings potential rather than to buy lower-quality stocks because they appear cheap. These challenged businesses often don’t re-rate, a phenomenon known as a “value trap”.
3. Carter's (CRI) Research Report: Q4 CY2025 Update
Children’s apparel manufacturer Carter’s (NYSE:CRI) beat Wall Street’s revenue expectations in Q4 CY2025, with sales up 7.6% year on year to $925.5 million. Its non-GAAP profit of $1.90 per share was 11.5% above analysts’ consensus estimates.
Carter's (CRI) Q4 CY2025 Highlights:
- Revenue: $925.5 million vs analyst estimates of $917.8 million (7.6% year-on-year growth, 0.8% beat)
- Adjusted EPS: $1.90 vs analyst estimates of $1.70 (11.5% beat)
- Adjusted EBITDA: $105 million vs analyst estimates of $104.7 million (11.3% margin, in line)
- Adjusted EPS guidance for Q1 CY2026 is $0.05 at the midpoint, below analyst estimates of $0.36
- Operating Margin: 9.2%, in line with the same quarter last year
- Same-Store Sales rose 4.7% year on year (-3.4% in the same quarter last year)
- Market Capitalization: $1.53 billion
Company Overview
Rumored to sell more than 10 products for every child born in the United States, Carter's (NYSE:CRI) is an American designer and marketer of children's apparel.
The company's flagship brand, Carter's, caters to parents and caregivers seeking reliable children's clothes including bodysuits, pajamas, outerwear, and swimwear.
Since its founding in 1865, it has acquired two other brands to expand its offerings: OshKosh B'gosh (2005) and Skip Hop (2017). OshKosh B'gosh is a fashion-forward clothing brand focusing on denim products while Skip Hop provides lifestyle goods such as diaper bags, toys, baby gear, and home essentials.
Carter's sells its products through retail stores in the United States, Canada, and Mexico, as well as online and in department stores, national chains, specialty retailers, and distributors internationally. Its multi-channel approach reflects the company’s vision that parents should be able to access children’s clothing in the most convenient way possible.
4. Consumer Discretionary - Apparel and Accessories
The Consumer Discretionary sector, by definition, is made up of companies selling non-essential goods and services. When economic conditions deteriorate or tastes shift, consumers can easily cut back or eliminate these purchases. For long-term investors with five-year holding periods, this creates a structural challenge: the sector is inherently hit-driven, with low switching costs and fickle customers. As a result, only a handful of companies can reliably grow demand and compound earnings over long periods, which is why our bar is high and High Quality ratings are rare.
Apparel and accessories companies design, brand, and distribute clothing, handbags, jewelry, and related lifestyle products, often spanning multiple price tiers. Tailwinds include premiumization trends (consumers trading up for perceived quality), international expansion into emerging markets, and growing digital commerce penetration. However, these businesses face headwinds from highly cyclical demand, intense promotional environments, and counterfeit competition undermining brand equity. Tariff volatility and sourcing concentration in a handful of countries add risk. Additionally, rapidly changing fashion cycles and the rise of ultra-fast-fashion digital competitors compress product life cycles and make demand forecasting exceptionally difficult.
Carter's primary competitors include The Children's Place (NASDAQ:PLCE), Gap (NYSE:GPS), Gymboree (owned by Hanesbrands NYSE:HBI), and Zara Kids (owned by Inditex BME:ITX).
5. Revenue Growth
Reviewing a company’s long-term sales performance reveals insights into its quality. Any business can put up a good quarter or two, but many enduring ones grow for years. Unfortunately, Carter's struggled to consistently increase demand as its $2.9 billion of sales for the trailing 12 months was close to its revenue five years ago. This was below our standards and suggests it’s a low quality business.
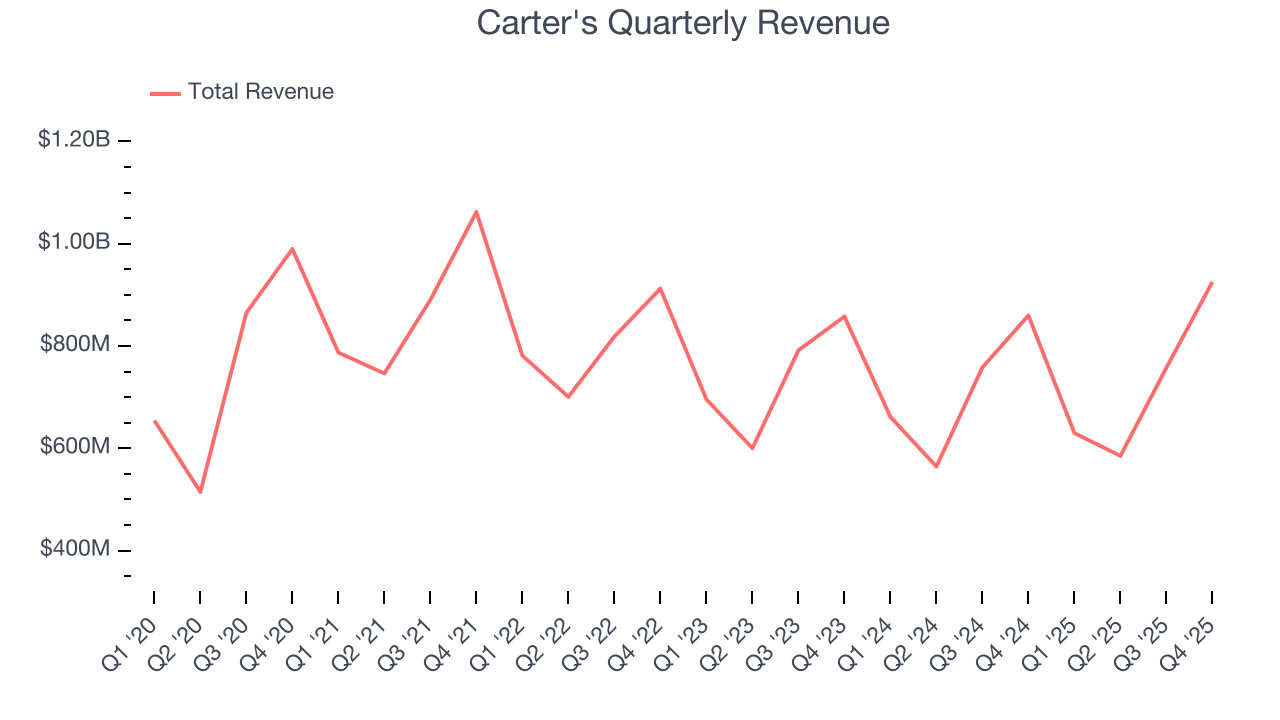
We at StockStory place the most emphasis on long-term growth, but within consumer discretionary, a stretched historical view may miss a company riding a successful new product or trend. Just like its five-year trend, Carter’s revenue over the last two years was flat, suggesting it is in a slump. 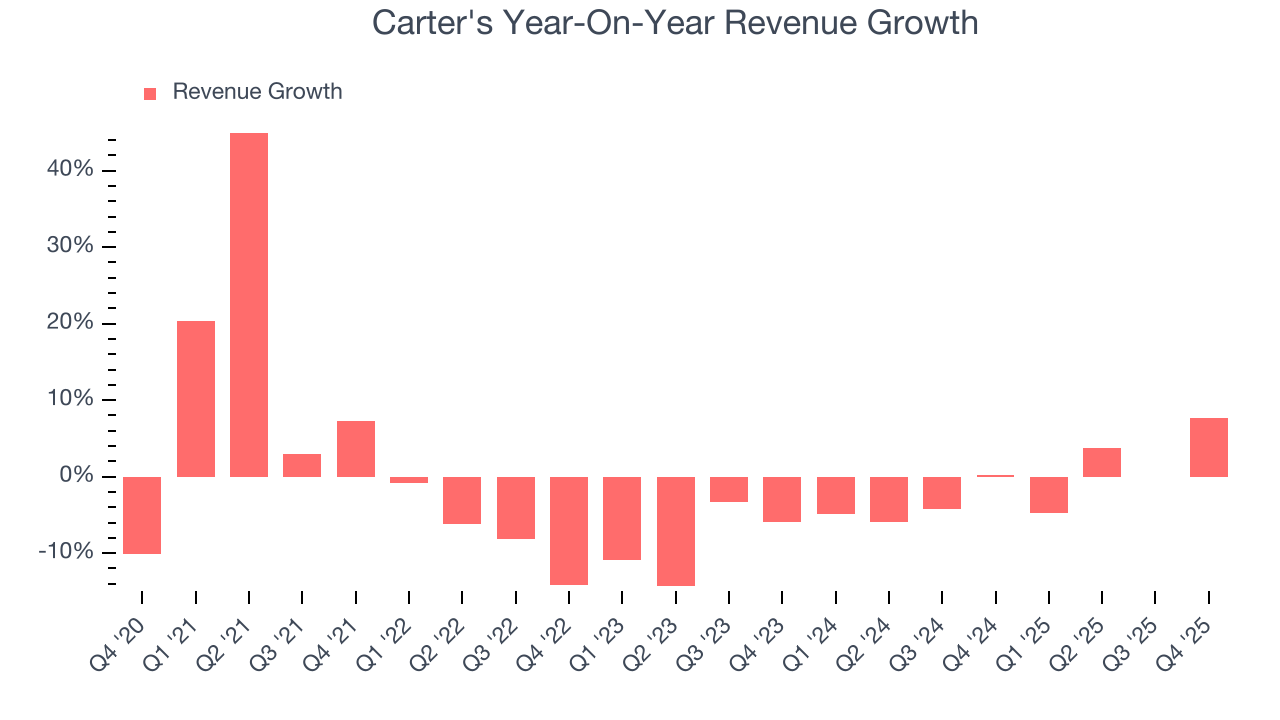
We can dig further into the company’s revenue dynamics by analyzing its same-store sales, which show how much revenue its established locations generate. Over the last two years, Carter’s same-store sales were flat. This number doesn’t surprise us as it’s in line with its revenue growth. 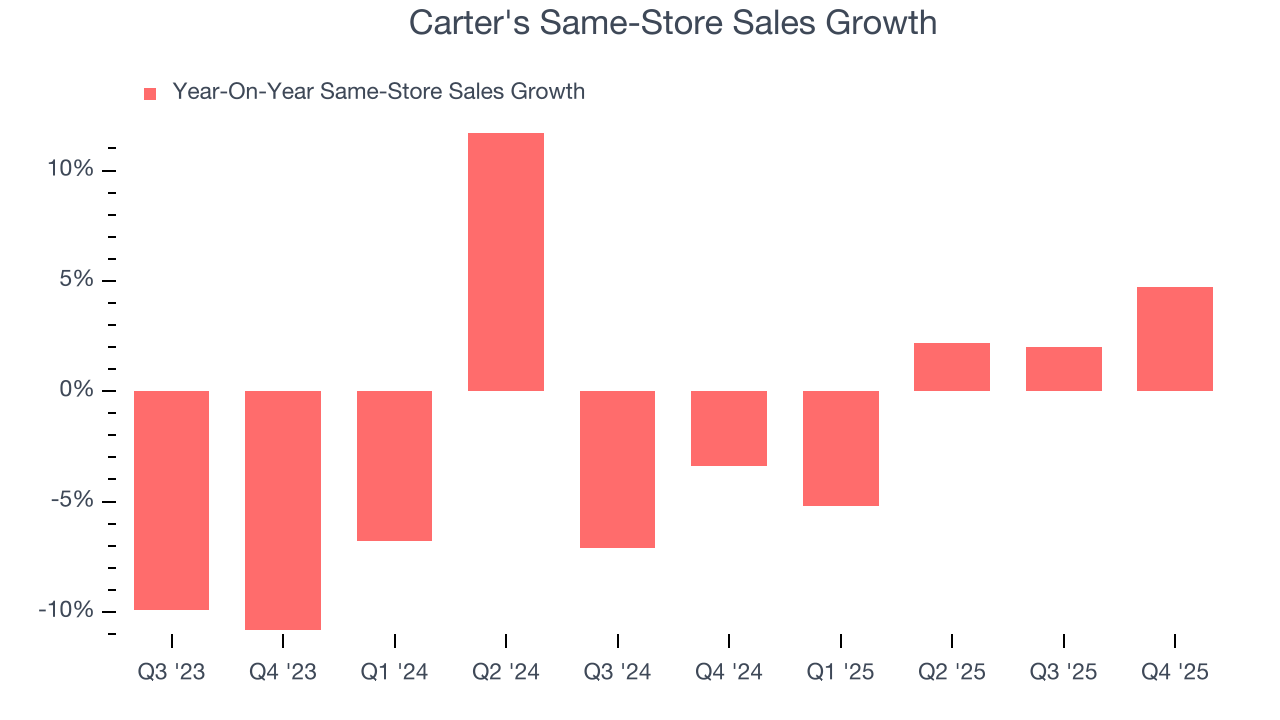
This quarter, Carter's reported year-on-year revenue growth of 7.6%, and its $925.5 million of revenue exceeded Wall Street’s estimates by 0.8%.
Looking ahead, sell-side analysts expect revenue to remain flat over the next 12 months. This projection is underwhelming and indicates its newer products and services will not catalyze better top-line performance yet.
6. Operating Margin
Carter’s operating margin has been trending down over the last 12 months and averaged 6.9% over the last two years. The company’s profitability was mediocre for a consumer discretionary business and shows it couldn’t pass its higher operating expenses onto its customers.
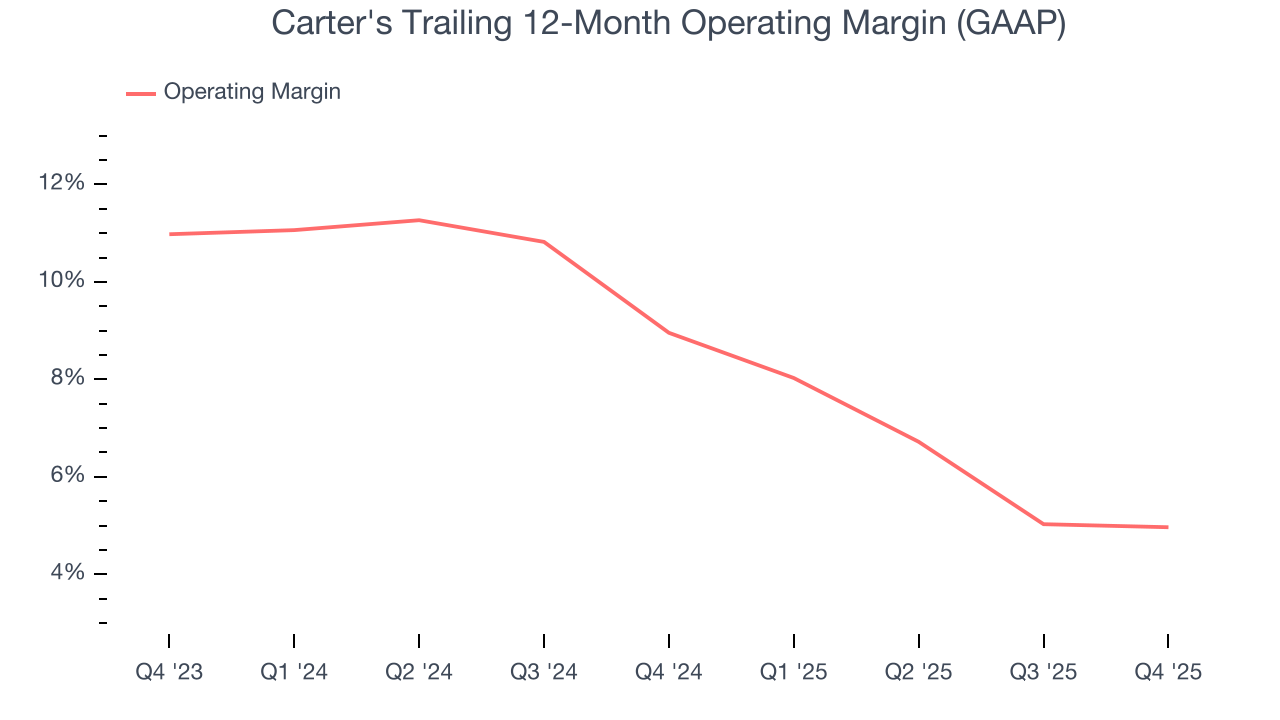
In Q4, Carter's generated an operating margin profit margin of 9.2%, in line with the same quarter last year. This indicates the company’s overall cost structure has been relatively stable.
7. Earnings Per Share
Revenue trends explain a company’s historical growth, but the long-term change in earnings per share (EPS) points to the profitability of that growth – for example, a company could inflate its sales through excessive spending on advertising and promotions.
Sadly for Carter's, its EPS declined by 3.5% annually over the last five years while its revenue was flat. This tells us the company struggled because its fixed cost base made it difficult to adjust to choppy demand.
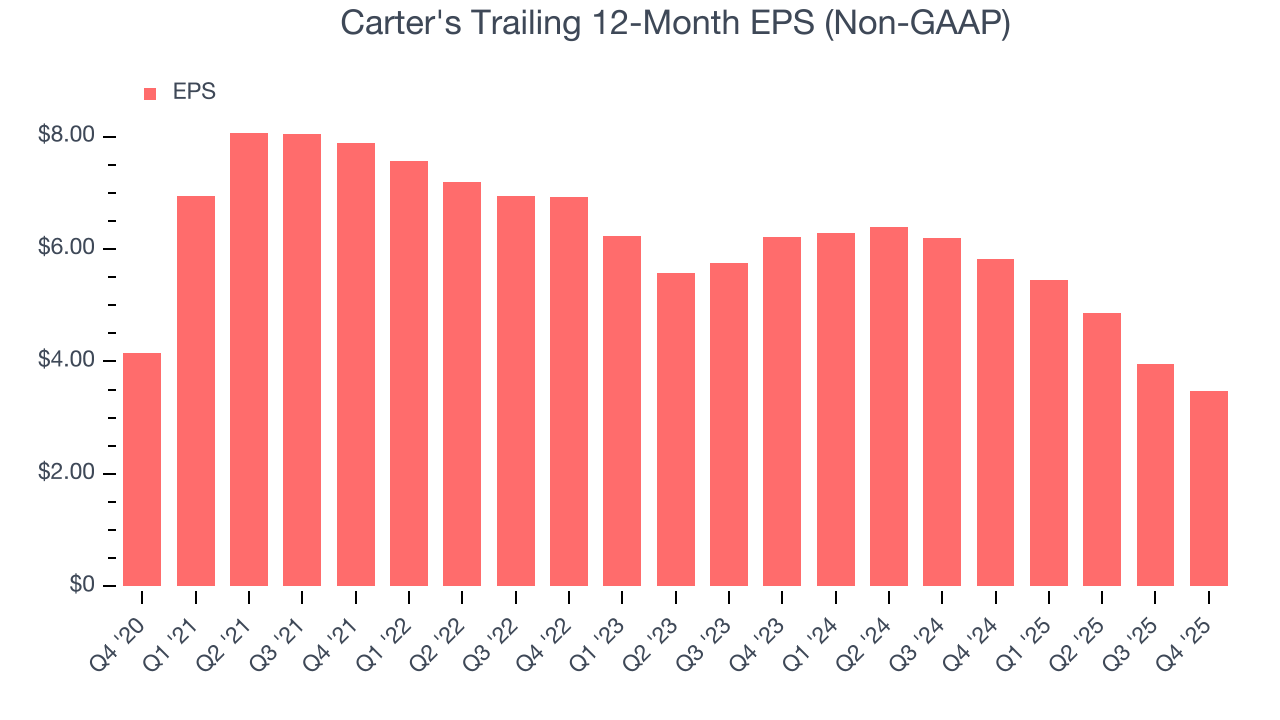
In Q4, Carter's reported adjusted EPS of $1.90, down from $2.39 in the same quarter last year. Despite falling year on year, this print easily cleared analysts’ estimates. Over the next 12 months, Wall Street expects Carter’s full-year EPS of $3.47 to shrink by 18.1%.
8. Cash Is King
If you’ve followed StockStory for a while, you know we emphasize free cash flow. Why, you ask? We believe that in the end, cash is king, and you can’t use accounting profits to pay the bills.
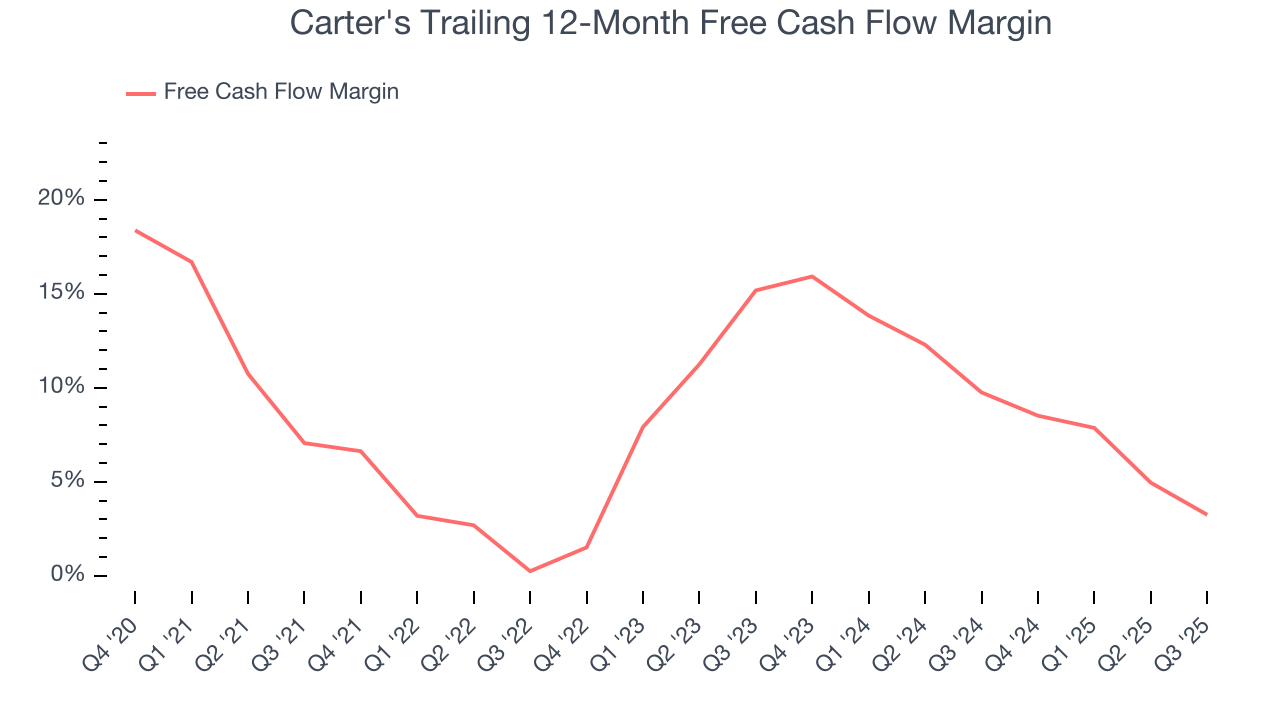
Carter's has shown poor cash profitability over the last two years, giving the company limited opportunities to return capital to shareholders. Its free cash flow margin averaged 1.3%, lousy for a consumer discretionary business.
9. Return on Invested Capital (ROIC)
EPS and free cash flow tell us whether a company was profitable while growing its revenue. But was it capital-efficient? A company’s ROIC explains this by showing how much operating profit it makes compared to the money it has raised (debt and equity).
Carter's historically did a mediocre job investing in profitable growth initiatives. Its five-year average ROIC was 18.7%, somewhat low compared to the best consumer discretionary companies that consistently pump out 25%+.
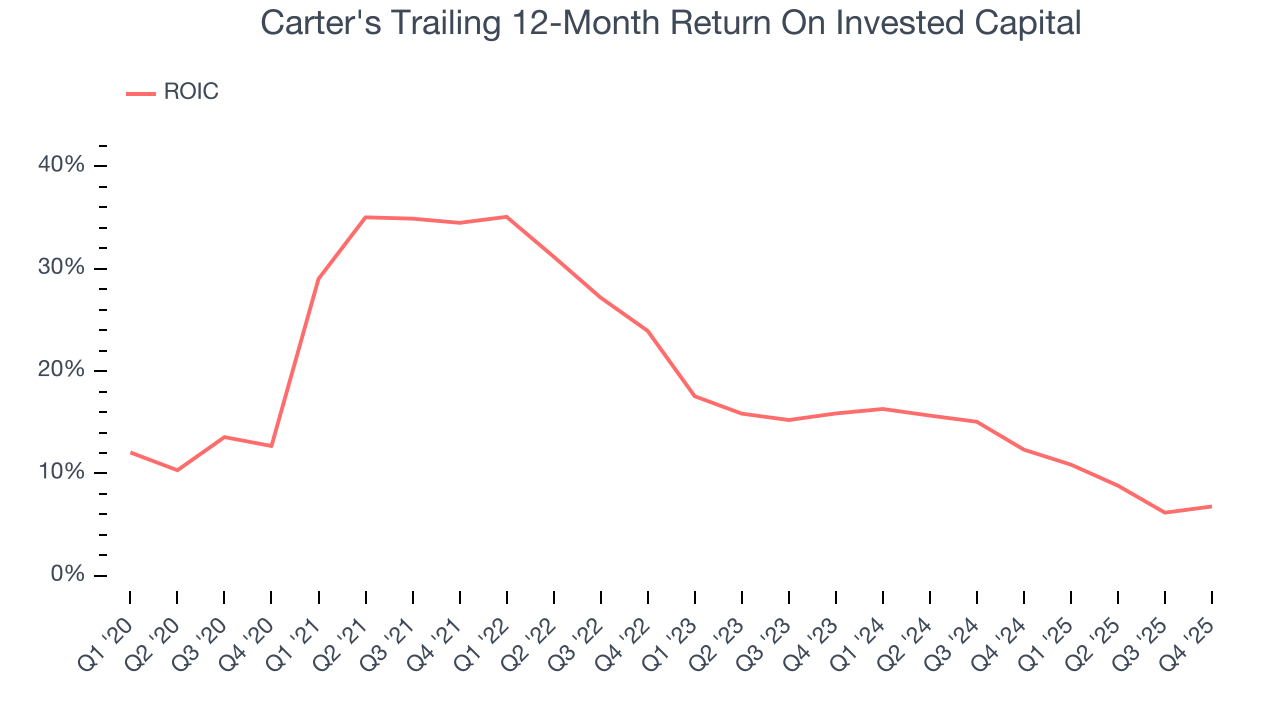
We like to invest in businesses with high returns, but the trend in a company’s ROIC is what often surprises the market and moves the stock price. Over the last few years, Carter’s ROIC has unfortunately decreased significantly. Paired with its already low returns, these declines suggest its profitable growth opportunities are few and far between.
10. Balance Sheet Assessment
Carter's reported $487.1 million of cash and $1.21 billion of debt on its balance sheet in the most recent quarter. As investors in high-quality companies, we primarily focus on two things: 1) that a company’s debt level isn’t too high and 2) that its interest payments are not excessively burdening the business.
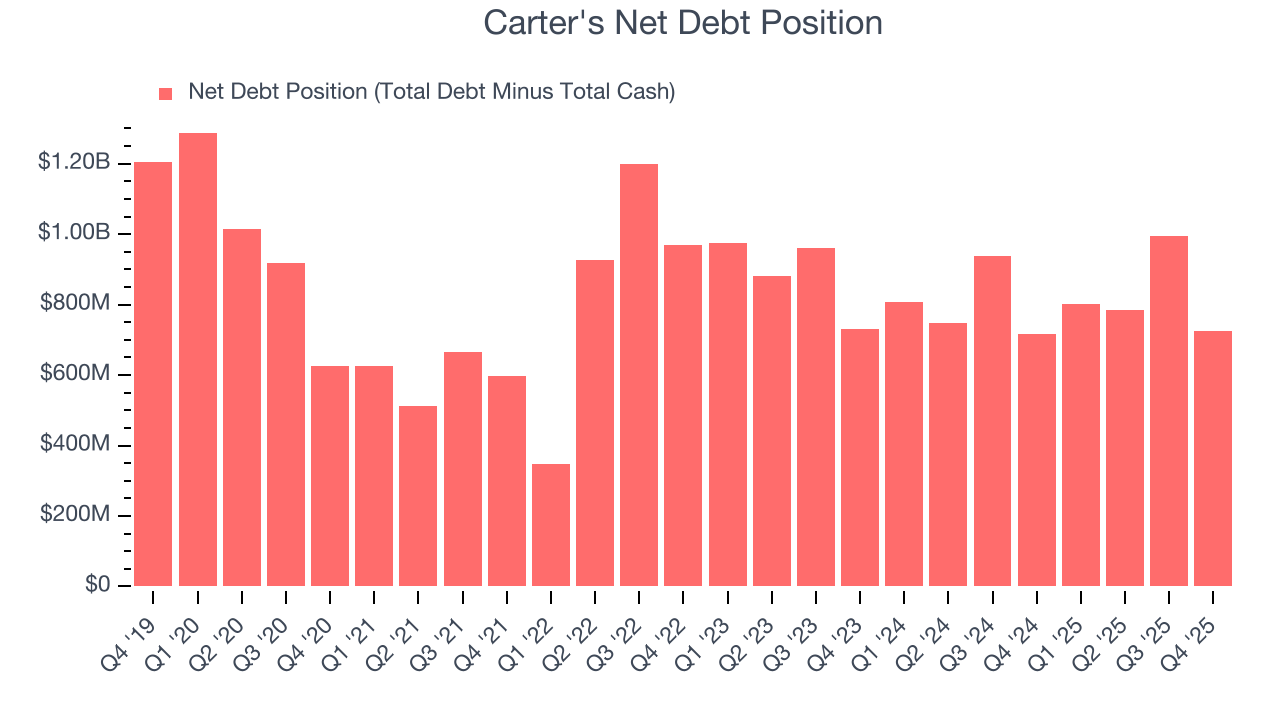
With $232.4 million of EBITDA over the last 12 months, we view Carter’s 3.1× net-debt-to-EBITDA ratio as safe. We also see its $4.93 million of annual interest expenses as appropriate. The company’s profits give it plenty of breathing room, allowing it to continue investing in growth initiatives.
11. Key Takeaways from Carter’s Q4 Results
It was good to see Carter's beat analysts’ EPS expectations this quarter. We were also happy its revenue narrowly outperformed Wall Street’s estimates. On the other hand, its EPS guidance for next quarter missed. Overall, this was a softer quarter. The stock traded down 9.1% to $38.23 immediately following the results.
12. Is Now The Time To Buy Carter's?
Updated: March 29, 2026 at 10:53 PM EDT
The latest quarterly earnings matters, sure, but we actually think longer-term fundamentals and valuation matter more. Investors should consider all these pieces before deciding whether or not to invest in Carter's.
We see the value of companies helping consumers, but in the case of Carter's, we’re out. On top of that, Carter’s same-store sales performance has disappointed, and its declining EPS over the last five years makes it a less attractive asset to the public markets.
Carter’s P/E ratio based on the next 12 months is 11.3x. While this valuation is reasonable, we don’t see a big opportunity at the moment. There are better investments elsewhere.
Wall Street analysts have a consensus one-year price target of $37 on the company (compared to the current share price of $34.83).