Dillard's (DDS)
We’re skeptical of Dillard's. Not only is its demand weak but also its falling returns on capital suggest it’s becoming less profitable.― StockStory Analyst Team
1. News


2. Summary
Why We Think Dillard's Will Underperform
With stores located largely in the Southern and Western US, Dillard’s (NYSE:DDS) is a department store chain that sells clothing, cosmetics, accessories, and home goods.
- Sales tumbled by 2.1% annually over the last three years, showing consumer trends are working against its favor
- Lagging same-store sales over the past two years suggest it might have to change its pricing and marketing strategy to stimulate demand
- On the bright side, its market-beating returns on capital illustrate that management has a knack for investing in profitable ventures


Dillard’s quality doesn’t meet our bar. We’re hunting for superior stocks elsewhere.
Why There Are Better Opportunities Than Dillard's


Dillard's is trading at $577.31 per share, or 18.8x forward P/E. This multiple is quite expensive for the quality you get.
We’d rather pay up for companies with elite fundamentals than get a decent price on a poor one. High-quality businesses often have more durable earnings power, helping us sleep well at night.
3. Dillard's (DDS) Research Report: Q4 CY2025 Update
Department store chain Dillard’s (NYSE:DDS) missed Wall Street’s revenue expectations in Q4 CY2025, with sales falling 3% year on year to $1.99 billion. Its GAAP profit of $13.05 per share was 13.5% above analysts’ consensus estimates.
Dillard's (DDS) Q4 CY2025 Highlights:
- Revenue: $1.99 billion vs analyst estimates of $2.02 billion (3% year-on-year decline, 1.5% miss)
- EPS (GAAP): $13.05 vs analyst estimates of $11.49 (13.5% beat)
- Adjusted EBITDA: $304 million vs analyst estimates of $259.3 million (15.3% margin, 17.3% beat)
- Operating Margin: 13%, up from 11.7% in the same quarter last year
- Free Cash Flow Margin: 9.6%, down from 17% in the same quarter last year
- Locations: 271 at quarter end, down from 272 in the same quarter last year
- Same-Store Sales fell 1% year on year, in line with the same quarter last year
- Market Capitalization: $10.09 billion
Company Overview
With stores located largely in the Southern and Western US, Dillard’s (NYSE:DDS) is a department store chain that sells clothing, cosmetics, accessories, and home goods.
As the name suggests, a department store offers a wide variety of merchandise organized into different departments or sections. Before the introduction of department stores in the 19th century, consumers would have to visit three different stores to buy an evening dress, a bottle of perfume, and a picture frame.
Today, the Dillard’s customer is a middle to upper-income woman over 35 years old who is looking for high-quality products in a variety of categories. While other department stores may offer products from affordable to luxury, Dillard’s products tend to be in the middle of the price spectrum, with a focus on quality over trendiness. Brands such as Ralph Lauren, Coach, and Lancome can be found in stores or on its e-commerce site.
Stores vary in size but are roughly 150,000 square feet. They are typically located in suburban malls and shopping centers. Common departments in a store include women’s/men’s/children’s apparel, beauty/cosmetics, and home goods. Additionally, Dillard's has an active e-commerce presence, which was launched in 1998 and made Dillard’s a fairly early adopter in the department store category at the time.
4. Department Store
Department stores emerged in the 19th century to provide customers with a wide variety of merchandise under one roof, offering a convenient and luxurious shopping experience. They played an important role in the history of American retail and urbanization, and prior to department stores, retailers tended to sell narrow specialty and niche items. But what was once new is now old, and department stores are somewhat considered a relic of the past. They are being attacked from multiple angles–stagnant foot traffic at malls where they’ve served as anchors; more nimble off-price and fast-fashion retailers; and e-commerce-first competitors not burdened by large physical footprints.
Department store competitors include Macy’s (NYSE:M), Kohl’s (NYSE:KSS), and Nordstrom (NYSE:JWN).
5. Revenue Growth
Reviewing a company’s long-term sales performance reveals insights into its quality. Any business can put up a good quarter or two, but the best consistently grow over the long haul.
With $6.56 billion in revenue over the past 12 months, Dillard's is a mid-sized retailer, which sometimes brings disadvantages compared to larger competitors benefiting from better economies of scale.
As you can see below, Dillard’s demand was weak over the last three years. Its sales fell by 2.1% annually as it didn’t open many new stores and observed lower sales at existing, established locations.
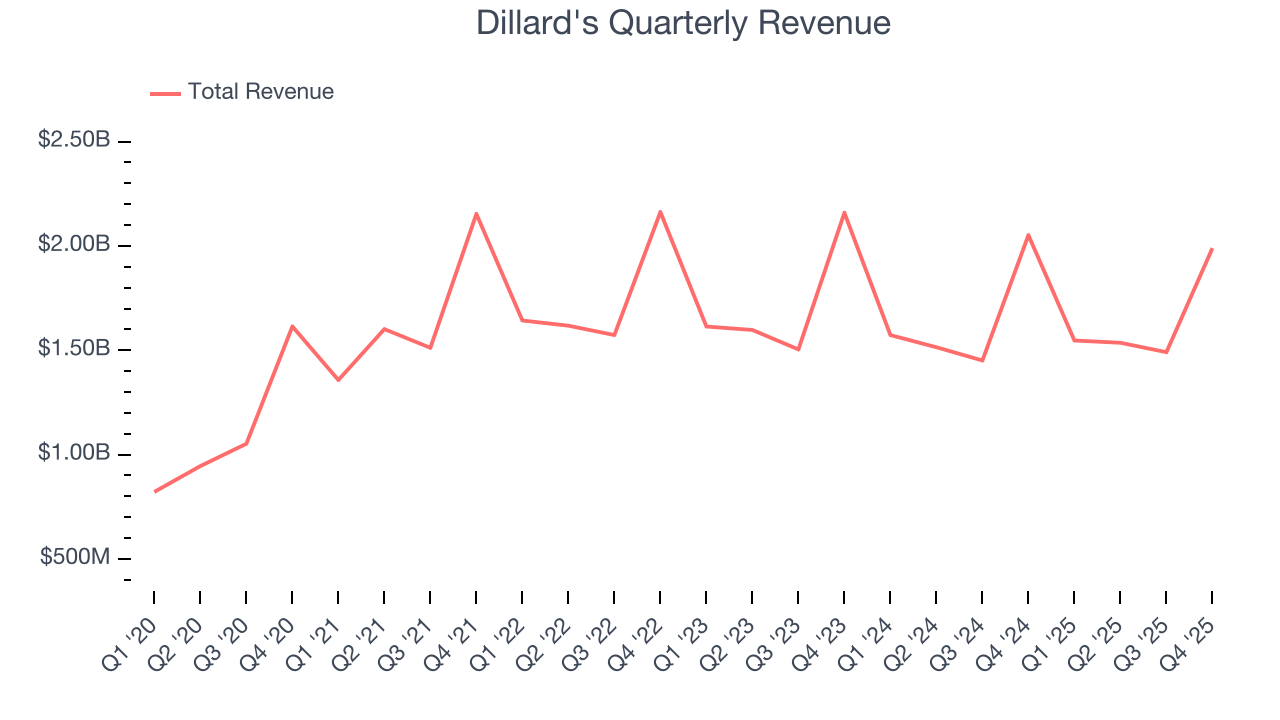
This quarter, Dillard's missed Wall Street’s estimates and reported a rather uninspiring 3% year-on-year revenue decline, generating $1.99 billion of revenue.
Looking ahead, sell-side analysts expect revenue to grow 1.6% over the next 12 months. While this projection suggests its newer products will catalyze better top-line performance, it is still below average for the sector.
6. Store Performance
Number of Stores
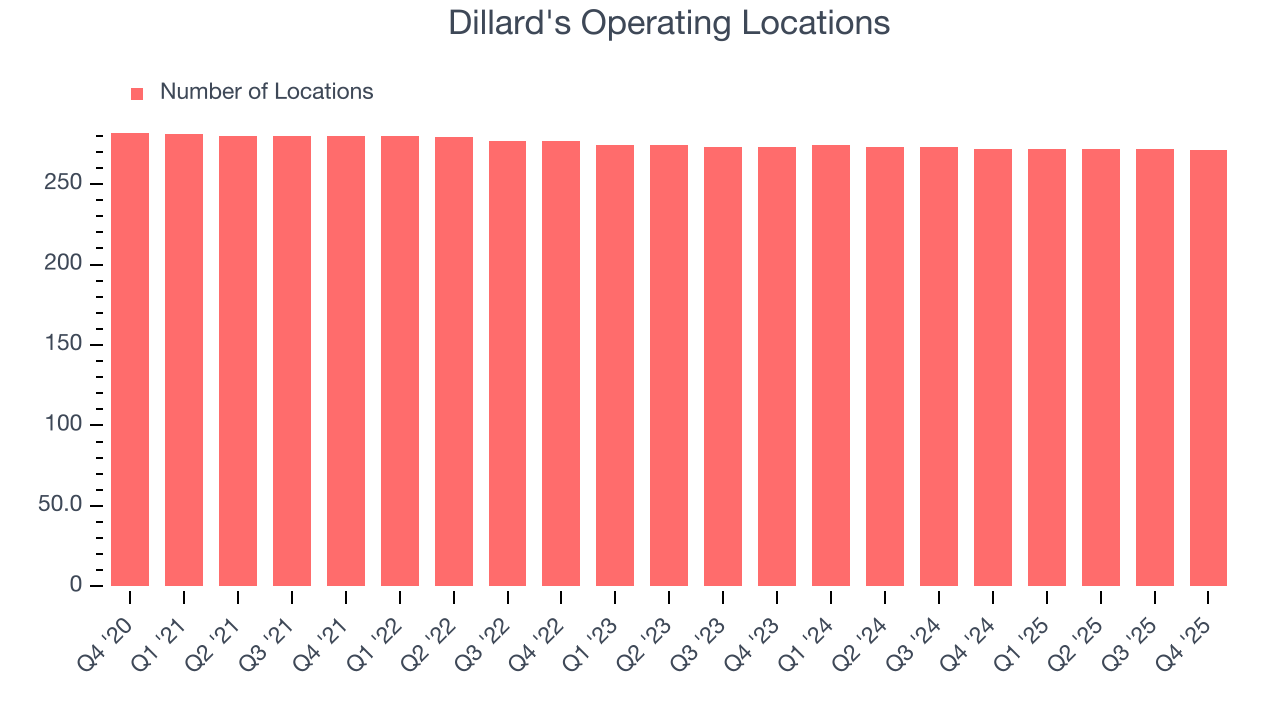
The number of stores a retailer operates is a critical driver of how quickly company-level sales can grow.
Dillard's operated 271 locations in the latest quarter, and over the last two years, has kept its store count flat while other consumer retail businesses have opted for growth.
When a retailer keeps its store footprint steady, it usually means demand is stable and it’s focusing on operational efficiency to increase profitability.
Same-Store Sales
A company's store base only paints one part of the picture. When demand is high, it makes sense to open more. But when demand is low, it’s prudent to close some locations and use the money in other ways. Same-store sales is an industry measure of whether revenue is growing at those existing stores and is driven by customer visits (often called traffic) and the average spending per customer (ticket).
Dillard’s demand has been shrinking over the last two years as its same-store sales have averaged 1.3% annual declines. This performance isn’t ideal, and we’d be concerned if Dillard's starts opening new stores to artificially boost revenue growth.
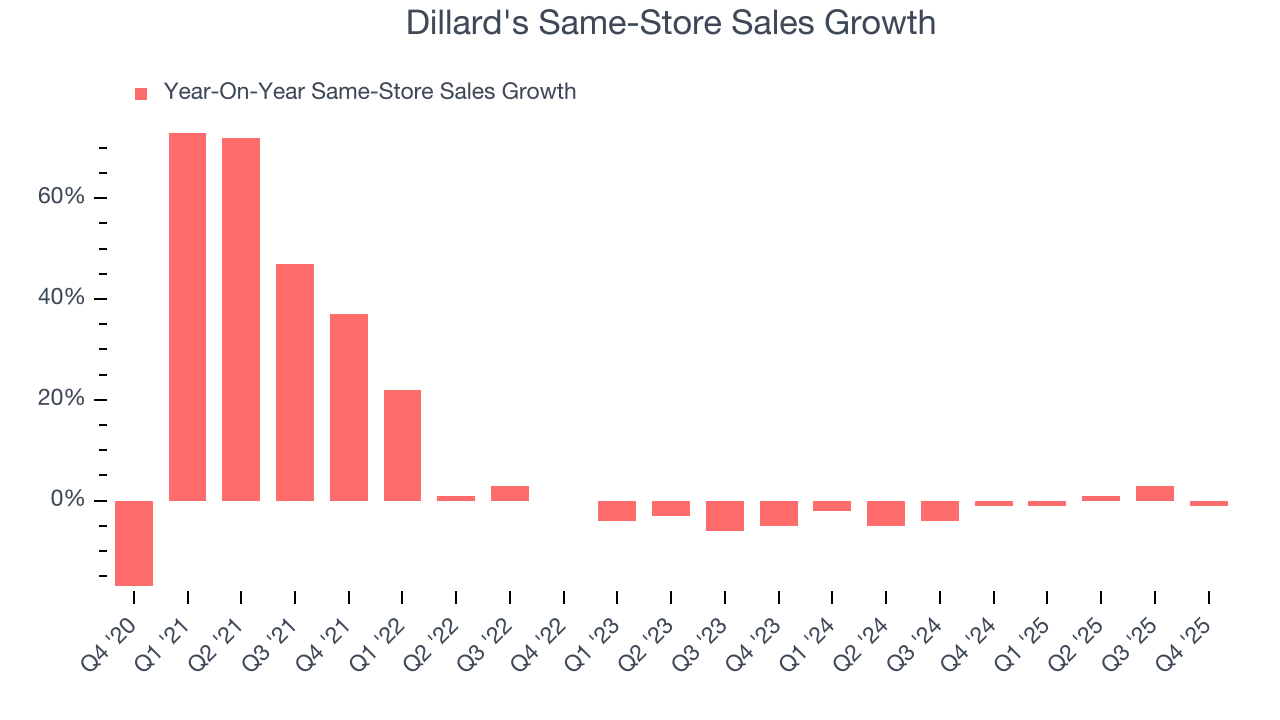
In the latest quarter, Dillard’s same-store sales fell by 1% year on year. This performance was more or less in line with its historical levels.
7. Gross Margin & Pricing Power
Gross profit margins are an important measure of a retailer’s pricing power, product differentiation, and negotiating leverage.
Dillard’s unit economics are higher than the typical retailer, giving it the flexibility to invest in areas such as marketing and talent to reach more consumers. As you can see below, it averaged a decent 40.4% gross margin over the last two years. That means for every $100 in revenue, $59.58 went towards paying for inventory, transportation, and distribution. 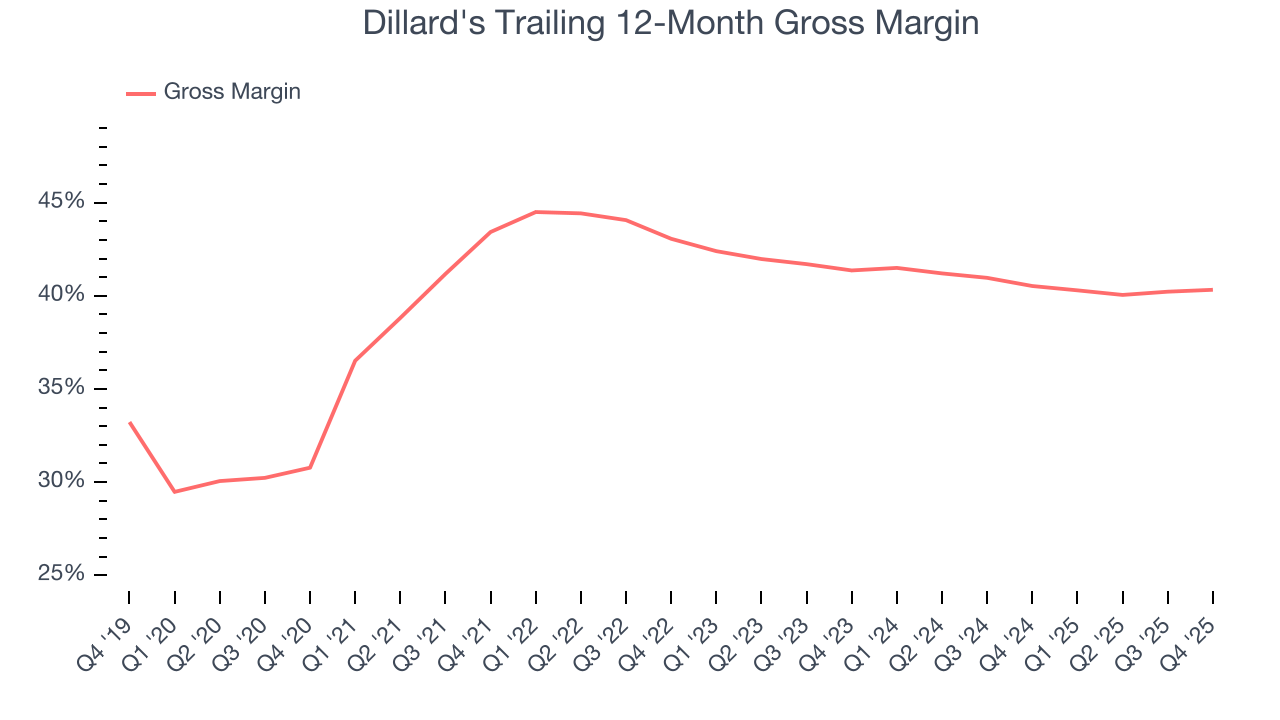
Dillard's produced a 36.3% gross profit margin in Q4, in line with the same quarter last year. Zooming out, the company’s full-year margin has remained steady over the past 12 months, suggesting it strives to keep prices low for customers and has stable input costs (such as labor and freight expenses to transport goods).
8. Operating Margin
Operating margin is an important measure of profitability for retailers as it accounts for all expenses necessary to run a store, including wages, inventory, rent, advertising, and other administrative costs.
Dillard’s operating margin might fluctuated slightly over the last 12 months but has generally stayed the same, averaging 11.3% over the last two years. This profitability was solid for a consumer retail business and shows it’s an efficient company that manages its expenses well.
Looking at the trend in its profitability, Dillard’s operating margin might fluctuated slightly but has generally stayed the same over the last year, highlighting the consistency of its expense base.
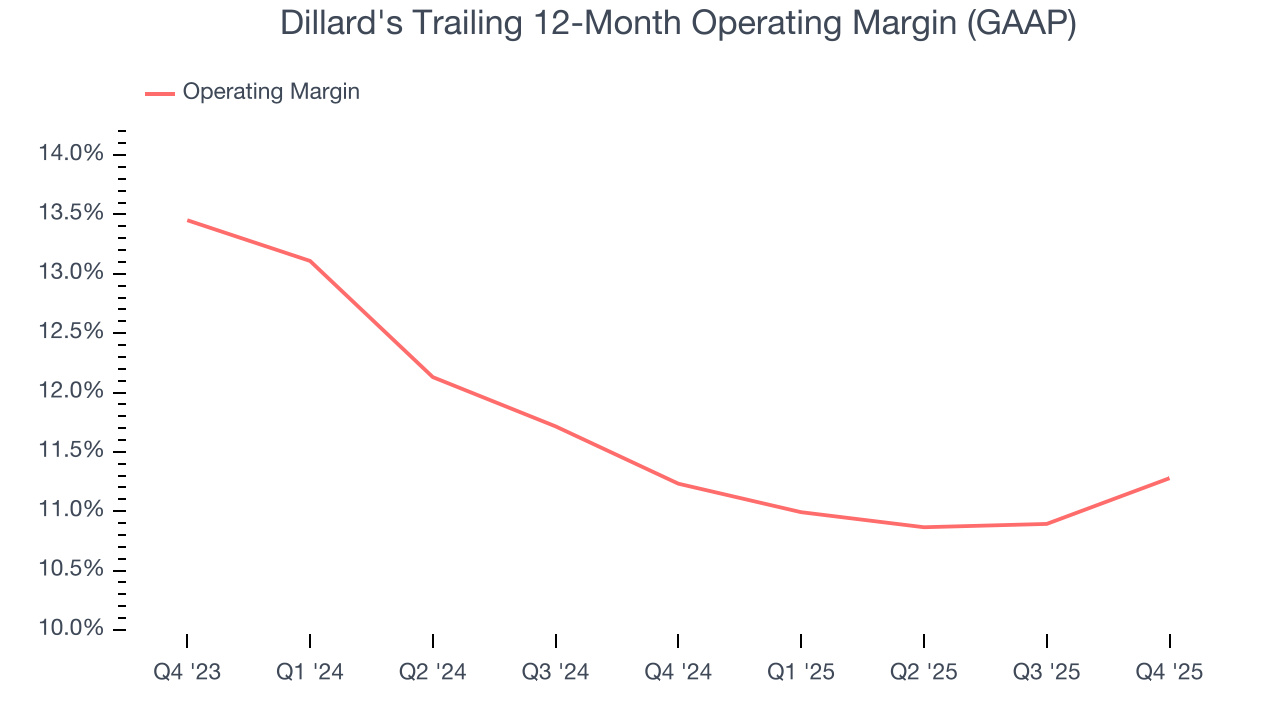
In Q4, Dillard's generated an operating margin profit margin of 13%, up 1.3 percentage points year on year. The increase was encouraging, and because its operating margin rose more than its gross margin, we can infer it was more efficient with expenses such as marketing, and administrative overhead.
9. Earnings Per Share
We track the long-term change in earnings per share (EPS) for the same reason as long-term revenue growth. Compared to revenue, however, EPS highlights whether a company’s growth is profitable.
Sadly for Dillard's, its EPS declined by 10.5% annually over the last three years, more than its revenue. This tells us the company struggled because its fixed cost base made it difficult to adjust to shrinking demand.
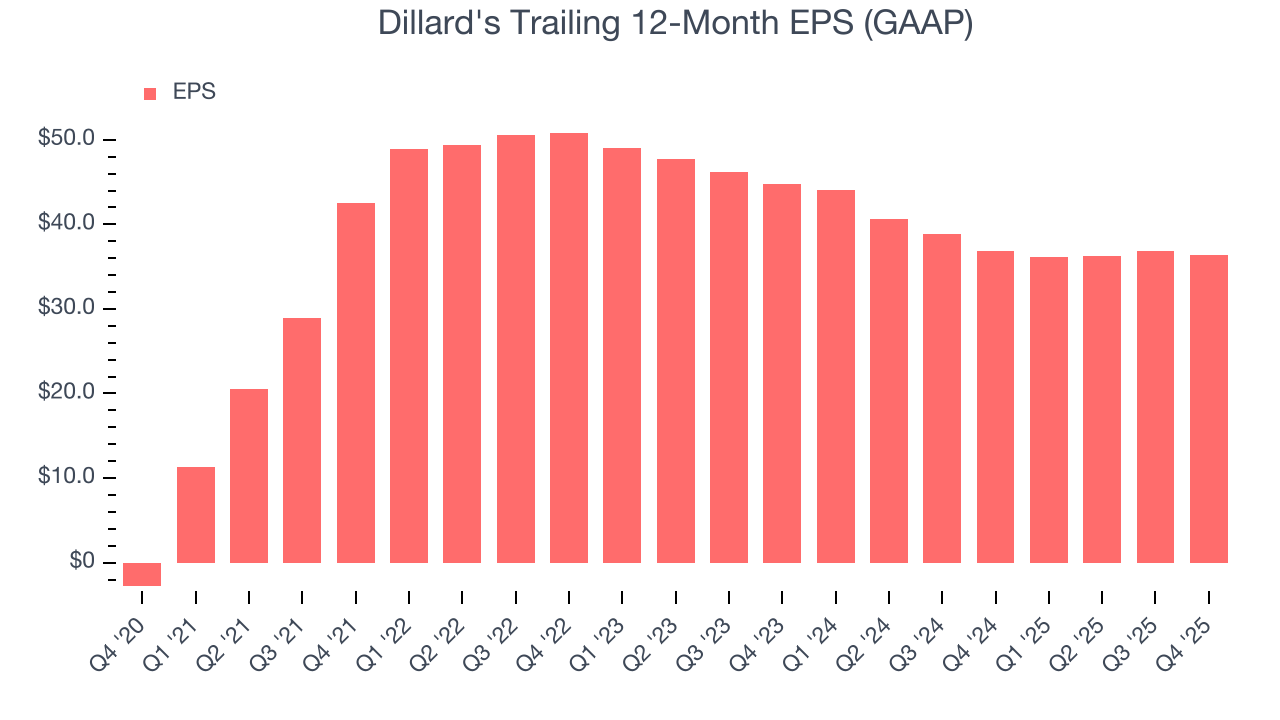
In Q4, Dillard's reported EPS of $13.05, down from $13.48 in the same quarter last year. Despite falling year on year, this print easily cleared analysts’ estimates. Over the next 12 months, Wall Street expects Dillard’s full-year EPS of $36.41 to shrink by 6.2%.
10. Cash Is King
Free cash flow isn't a prominently featured metric in company financials and earnings releases, but we think it's telling because it accounts for all operating and capital expenses, making it tough to manipulate. Cash is king.
Dillard's has shown robust cash profitability, giving it an edge over its competitors and the ability to reinvest or return capital to investors. The company’s free cash flow margin averaged 9.4% over the last two years, quite impressive for a consumer retail business.
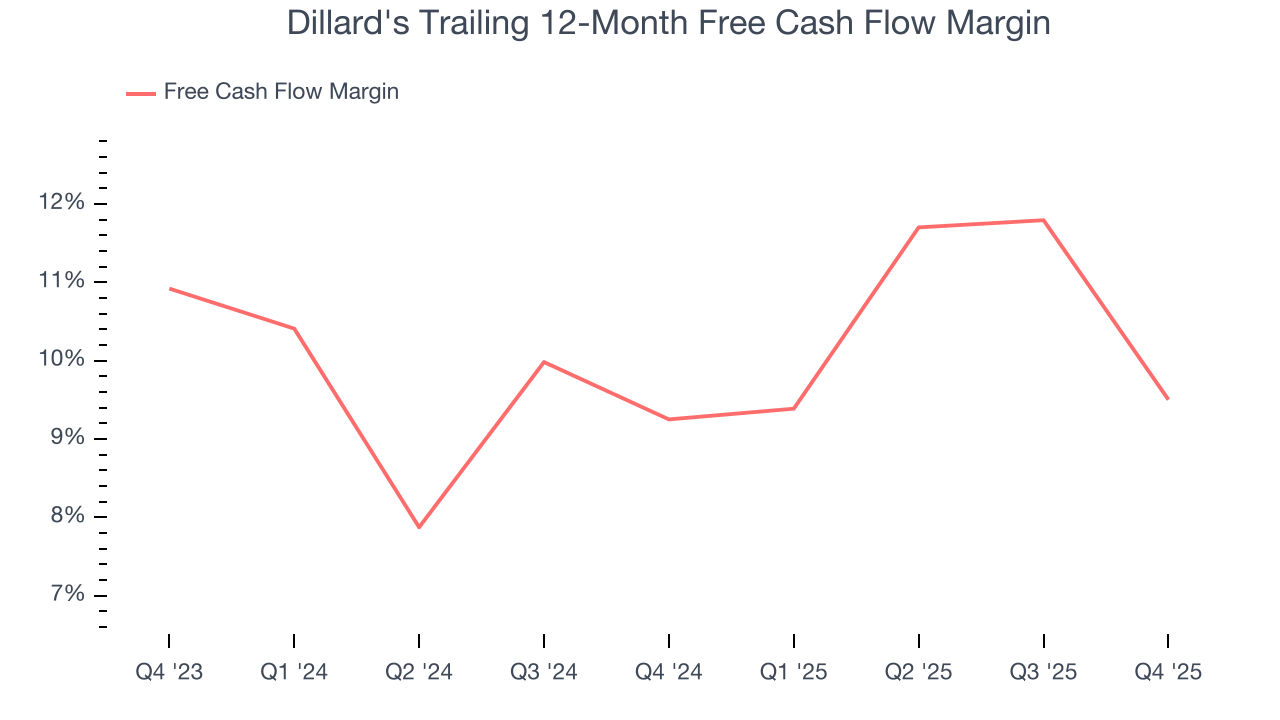
Dillard’s free cash flow clocked in at $191.6 million in Q4, equivalent to a 9.6% margin. The company’s cash profitability regressed as it was 7.4 percentage points lower than in the same quarter last year, prompting us to pay closer attention. Short-term fluctuations typically aren’t a big deal because investment needs can be seasonal, but we’ll be watching to see if the trend extrapolates into future quarters.
11. Return on Invested Capital (ROIC)
EPS and free cash flow tell us whether a company was profitable while growing its revenue. But was it capital-efficient? A company’s ROIC explains this by showing how much operating profit it makes compared to the money it has raised (debt and equity).
Although Dillard's hasn’t been the highest-quality company lately because of its poor revenue and EPS performance, it found a few growth initiatives in the past that worked out wonderfully. Its five-year average ROIC was 54.8%, splendid for a consumer retail business.
12. Balance Sheet Assessment
Companies with more cash than debt have lower bankruptcy risk.
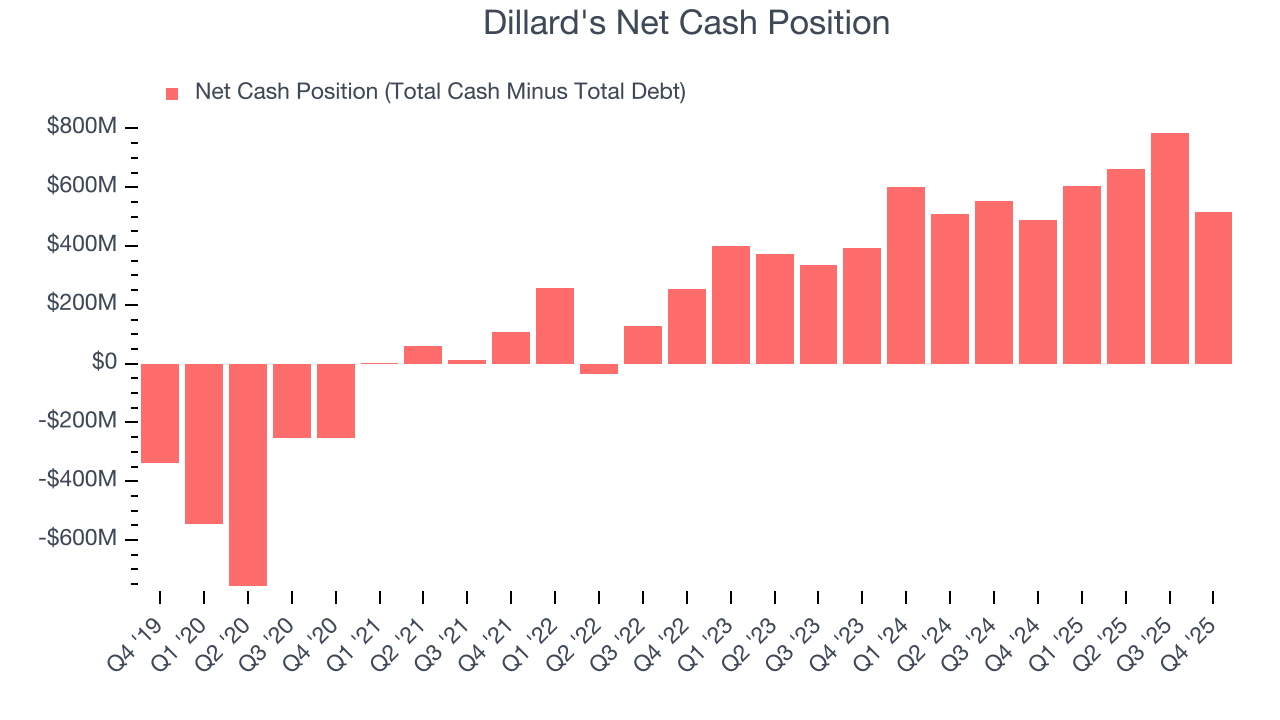
Dillard's is a profitable, well-capitalized company with $1.07 billion of cash and $557.6 million of debt on its balance sheet. This $515.4 million net cash position is 5.1% of its market cap and gives it the freedom to borrow money, return capital to shareholders, or invest in growth initiatives. Leverage is not an issue here.
13. Key Takeaways from Dillard’s Q4 Results
We were impressed by how significantly Dillard's blew past analysts’ EBITDA expectations this quarter. We were also glad its gross margin outperformed Wall Street’s estimates. On the other hand, its revenue missed. Overall, we think this was a mixed quarter. The stock remained flat at $643.94 immediately after reporting.
14. Is Now The Time To Buy Dillard's?
Updated: March 12, 2026 at 10:37 PM EDT
Are you wondering whether to buy Dillard's or pass? We urge investors to not only consider the latest earnings results but also longer-term business quality and valuation as well.
Dillard's isn’t a terrible business, but it doesn’t pass our bar. For starters, its revenue has declined over the last three years. While its stellar ROIC suggests it has been a well-run company historically, the downside is its shrinking same-store sales tell us it will need to change its strategy to succeed. On top of that, its declining EPS over the last three years makes it a less attractive asset to the public markets.
Dillard’s P/E ratio based on the next 12 months is 18.8x. Beauty is in the eye of the beholder, but our analysis shows the upside isn’t great compared to the potential downside. We're pretty confident there are superior stocks to buy right now.
Wall Street analysts have a consensus one-year price target of $519.67 on the company (compared to the current share price of $577.31), implying they don’t see much short-term potential in Dillard's.