Dell (DELL)
We’re firm believers in Dell. Its superior and growing returns on capital suggest its competitive advantages are expanding.― StockStory Analyst Team
1. News


2. Summary
Why We Like Dell
Founded by Michael Dell in his University of Texas dorm room in 1984 with just $1,000, Dell Technologies (NYSE:DELL) provides hardware, software, and services that help organizations build their IT infrastructure, manage cloud environments, and enable digital transformation.
- Earnings per share grew by 20.5% annually over the last two years, massively outpacing its peers
- Massive revenue base of $113.5 billion makes it a well-known name that influences purchasing decisions
- Market share is on track to rise over the next 12 months as its 23.6% projected revenue growth implies demand will accelerate from its two-year trend


We have an affinity for Dell. The price looks fair in light of its quality, so this could be a prudent time to invest in some shares.
Why Is Now The Time To Buy Dell?


Dell is trading at $159.92 per share, or 12.2x forward P/E. This multiple is lower than most business services companies, and we think the stock is a deal when considering its quality characteristics.
Entry price matters far less than business fundamentals if you’re investing for a multi-year period. But if you can get a bargain price it’s certainly icing on the cake.
3. Dell (DELL) Research Report: Q4 CY2025 Update
Computer hardware and IT solutions company Dell (NYSE:DELL) reported Q4 CY2025 results beating Wall Street’s revenue expectations, with sales up 39.5% year on year to $33.38 billion. On top of that, next quarter’s revenue guidance ($35.2 billion at the midpoint) was surprisingly good and 21.4% above what analysts were expecting. Its non-GAAP profit of $3.89 per share was 10.4% above analysts’ consensus estimates.
Dell (DELL) Q4 CY2025 Highlights:
- Revenue: $33.38 billion vs analyst estimates of $31.72 billion (39.5% year-on-year growth, 5.2% beat)
- Adjusted EPS: $3.89 vs analyst estimates of $3.52 (10.4% beat)
- Revenue Guidance for Q1 CY2026 is $35.2 billion at the midpoint, above analyst estimates of $28.99 billion
- Adjusted EPS guidance for the upcoming financial year 2027 is $11.52 at the midpoint, in line with analyst estimates
- Operating Margin: 9.3%, in line with the same quarter last year
- Free Cash Flow was $3.95 billion, up from -$117 million in the same quarter last year
- Market Capitalization: $81.83 billion
Company Overview
Founded by Michael Dell in his University of Texas dorm room in 1984 with just $1,000, Dell Technologies (NYSE:DELL) provides hardware, software, and services that help organizations build their IT infrastructure, manage cloud environments, and enable digital transformation.
Dell's business spans two main segments: Infrastructure Solutions Group (ISG) and Client Solutions Group (CSG). The ISG division offers enterprise-level products including servers, storage systems, and networking equipment designed for data centers and cloud environments. These solutions help businesses process, store, and manage their data, with recent emphasis on AI-optimized servers for machine learning workloads. The CSG division focuses on personal computing devices like laptops, desktops, and workstations, along with peripherals such as monitors, keyboards, and docking stations.
A healthcare system might use Dell's servers to host patient records and run diagnostic applications, while equipping doctors and administrators with Dell laptops for daily operations. A university could deploy Dell storage systems to manage research data while providing students with access to computer labs filled with Dell workstations.
Dell generates revenue through direct hardware sales and increasingly through subscription-based services and "as-a-service" offerings under its APEX portfolio, which allows customers to pay for technology based on consumption rather than through upfront purchases. This shift reflects the broader industry trend toward recurring revenue models.
Dell Financial Services provides customers with financing options, including leases and loans, making it easier for organizations to acquire technology without large capital expenditures. The company maintains a global presence with operations in over 170 countries, supported by both a direct sales force and a network of channel partners including value-added resellers, system integrators, and retailers.
4. Hardware & Infrastructure
The Hardware & Infrastructure sector will be buoyed by demand related to AI adoption, cloud computing expansion, and the need for more efficient data storage and processing solutions. Companies with tech offerings such as servers, switches, and storage solutions are well-positioned in our new hybrid working and IT world. On the other hand, headwinds include ongoing supply chain disruptions, rising component costs, and intensifying competition from cloud-native and hyperscale providers reducing reliance on traditional hardware. Additionally, regulatory scrutiny over data sovereignty, cybersecurity standards, and environmental sustainability in hardware manufacturing could increase compliance costs.
Dell Technologies competes with HP Inc. (NYSE:HPQ) and Lenovo Group (OTC:LNVGY) in the personal computing market, while facing competition from Hewlett Packard Enterprise (NYSE:HPE), Cisco Systems (NASDAQ:CSCO), and IBM (NYSE:IBM) in enterprise infrastructure. In cloud and as-a-service offerings, Dell also competes with hyperscalers like Amazon Web Services (NASDAQ:AMZN) and Microsoft Azure (NASDAQ:MSFT).
5. Revenue Growth
A company’s long-term performance is an indicator of its overall quality. Any business can experience short-term success, but top-performing ones enjoy sustained growth for years.
With $113.5 billion in revenue over the past 12 months, Dell is a behemoth in the business services sector and benefits from economies of scale, giving it an edge in distribution. This also enables it to gain more leverage on its fixed costs than smaller competitors and the flexibility to offer lower prices.
As you can see below, Dell’s 5.5% annualized revenue growth over the last five years was decent. This shows its offerings generated slightly more demand than the average business services company, a useful starting point for our analysis.
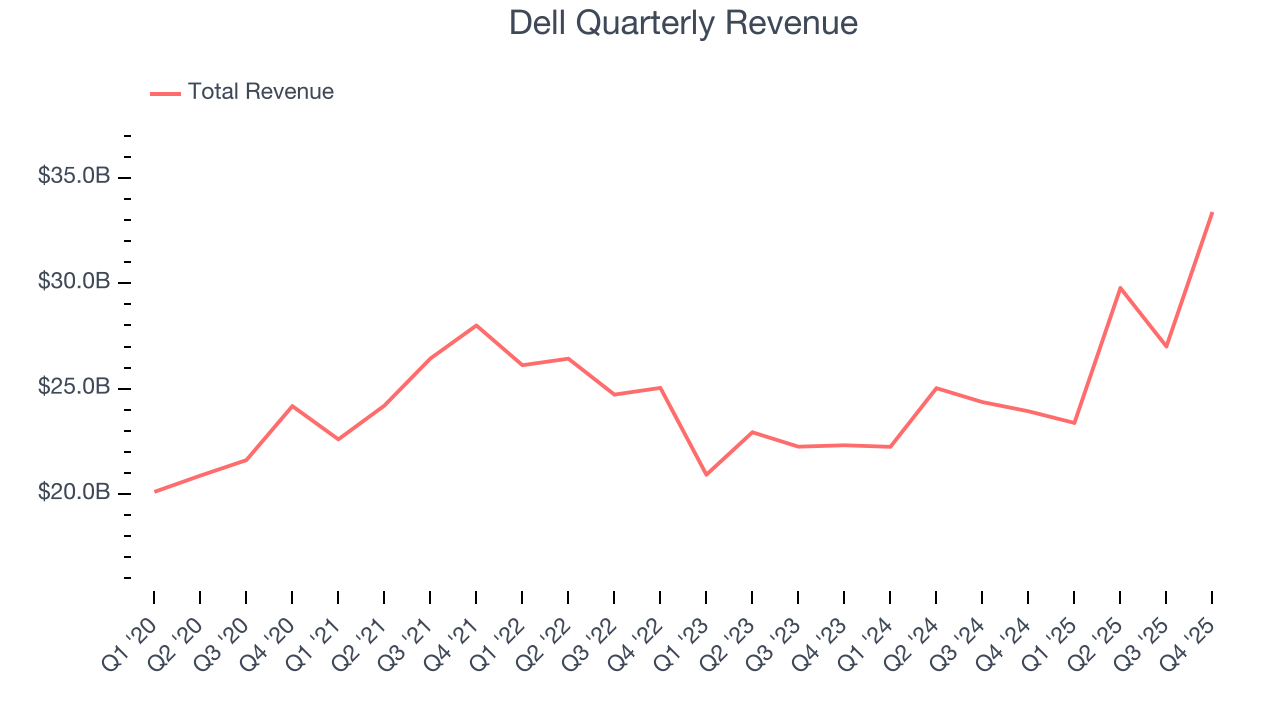
We at StockStory place the most emphasis on long-term growth, but within business services, a half-decade historical view may miss recent innovations or disruptive industry trends. Dell’s annualized revenue growth of 13.3% over the last two years is above its five-year trend, suggesting its demand recently accelerated. 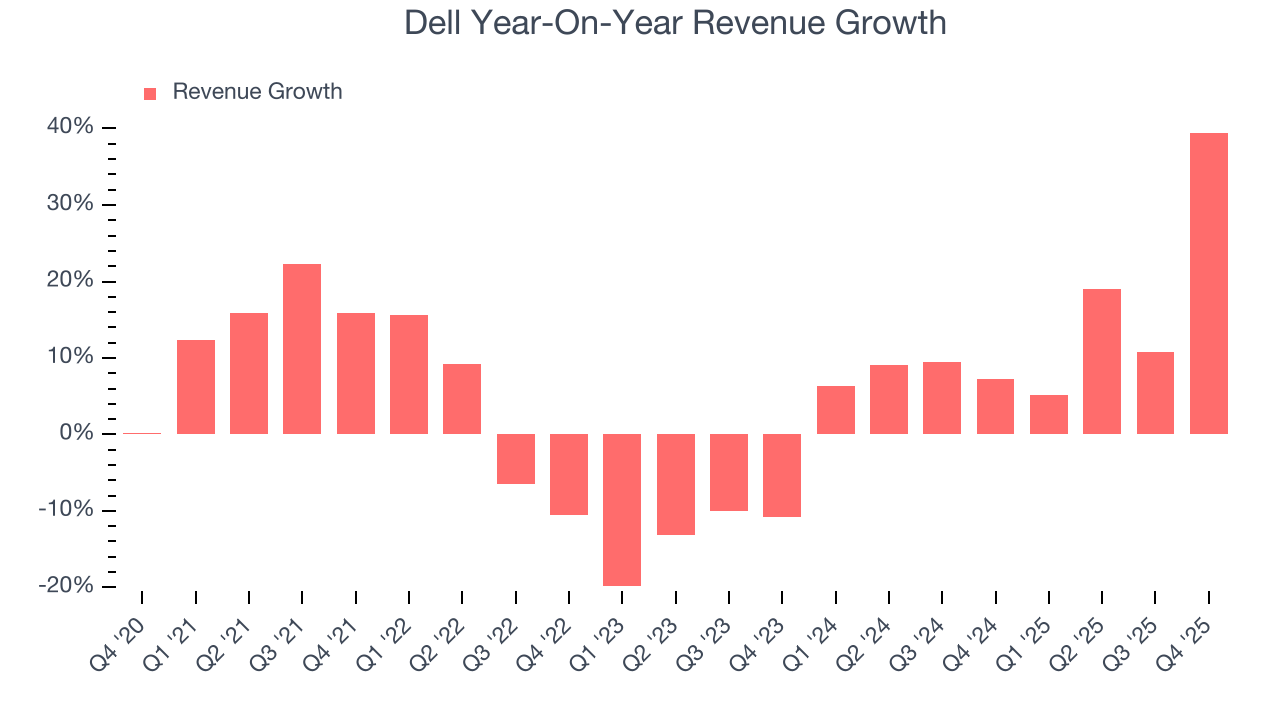
We can dig further into the company’s revenue dynamics by analyzing its most important segments, Infrastructure Solutions and Client Solutions, which are 58.7% and 40.4% of revenue. Over the last two years, Dell’s Infrastructure Solutions revenue (servers and storage) averaged 32.3% year-on-year growth while its Client Solutions revenue (PCs, monitors, displays) averaged 5.5% growth. 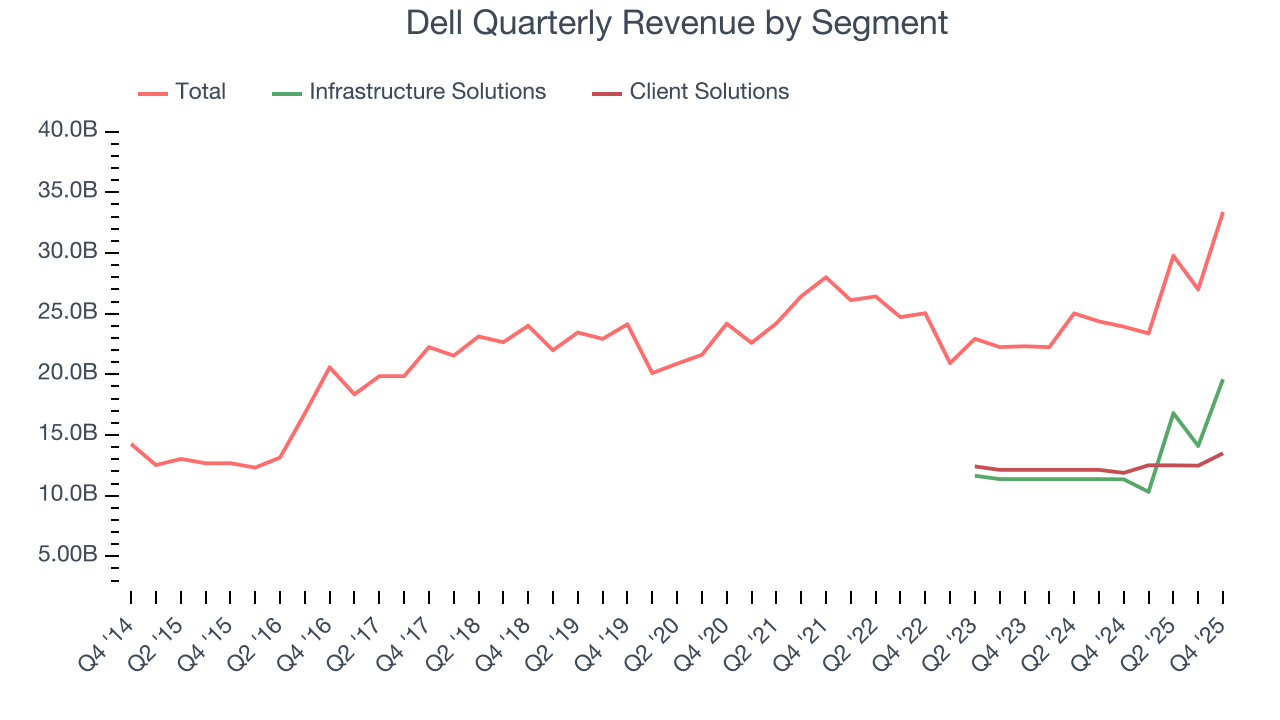
This quarter, Dell reported wonderful year-on-year revenue growth of 39.5%, and its $33.38 billion of revenue exceeded Wall Street’s estimates by 5.2%. Company management is currently guiding for a 50.6% year-on-year increase in sales next quarter.
Looking further ahead, sell-side analysts expect revenue to grow 9.9% over the next 12 months, a deceleration versus the last two years. We still think its growth trajectory is attractive given its scale and indicates the market sees success for its products and services.
6. Operating Margin
Operating margin is one of the best measures of profitability because it tells us how much money a company takes home after subtracting all core expenses, like marketing and R&D.
Dell was profitable over the last five years but held back by its large cost base. Its average operating margin of 6% was weak for a business services business.
On the plus side, Dell’s operating margin rose by 2.6 percentage points over the last five years, as its sales growth gave it operating leverage.
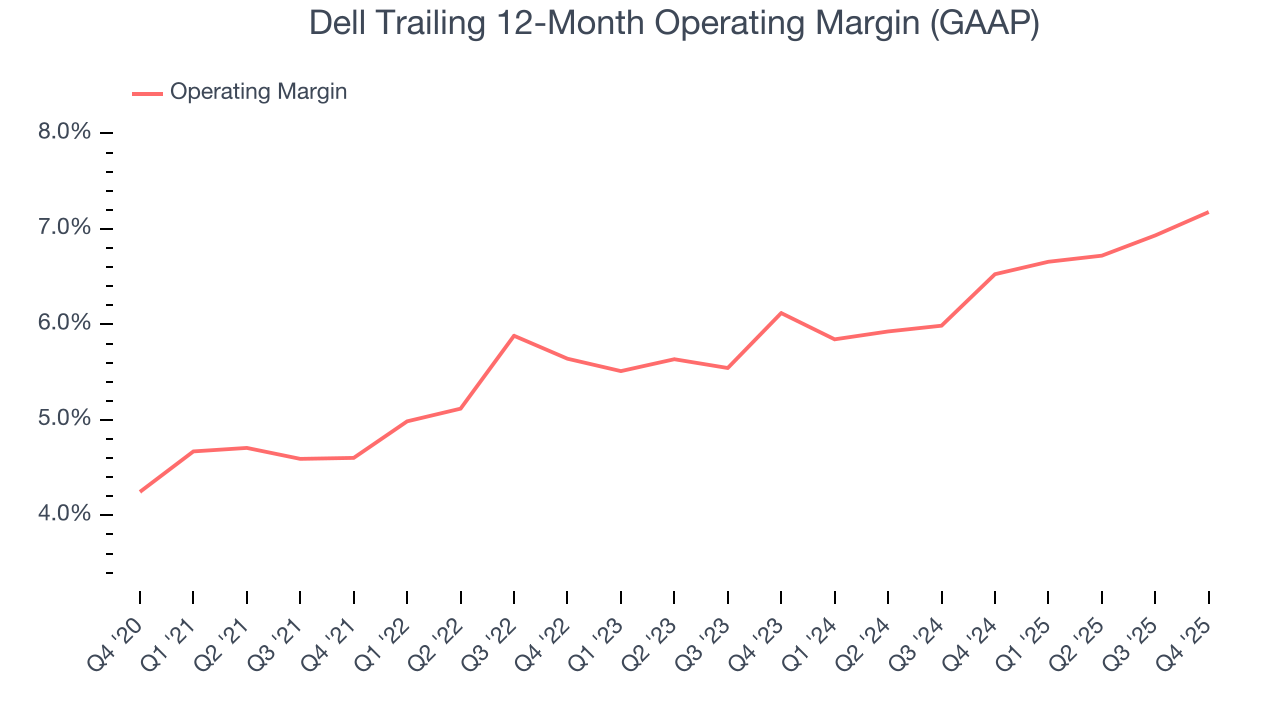
This quarter, Dell generated an operating margin profit margin of 9.3%, in line with the same quarter last year. This indicates the company’s overall cost structure has been relatively stable.
7. Earnings Per Share
Revenue trends explain a company’s historical growth, but the long-term change in earnings per share (EPS) points to the profitability of that growth – for example, a company could inflate its sales through excessive spending on advertising and promotions.
Dell’s unimpressive 5.3% annual EPS growth over the last five years aligns with its revenue performance. On the bright side, this tells us its incremental sales were profitable.
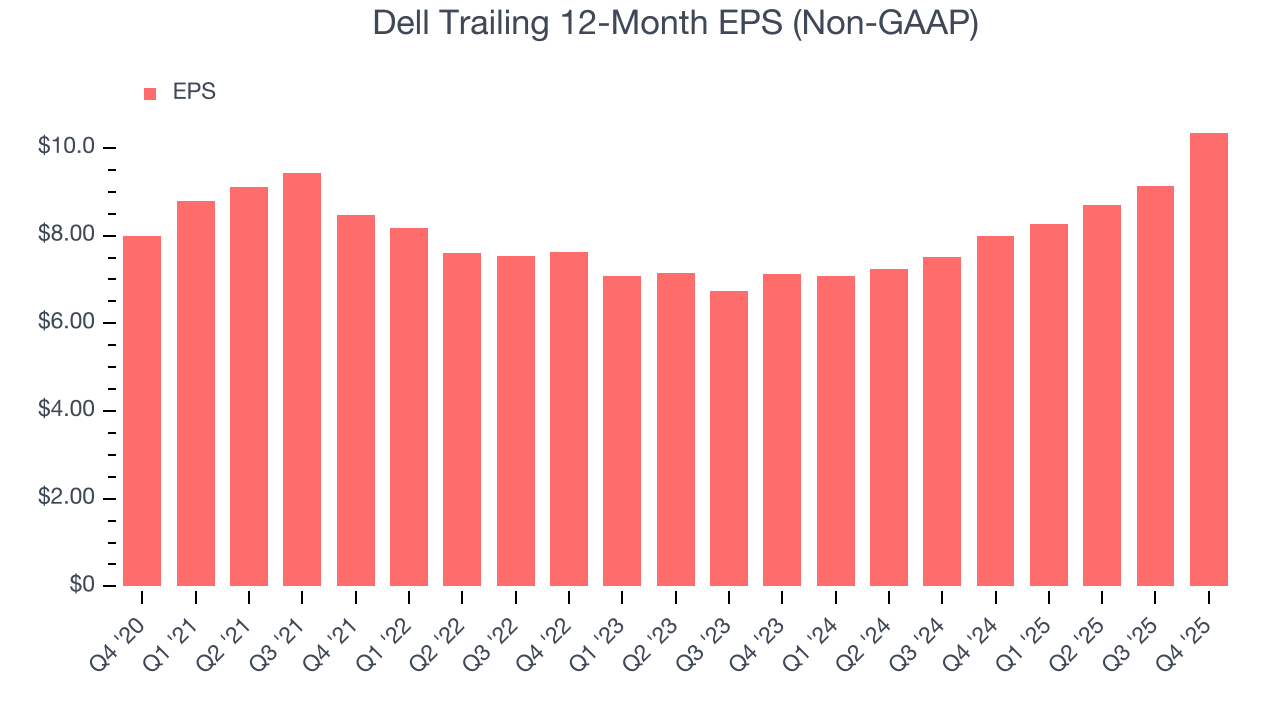
Like with revenue, we analyze EPS over a shorter period to see if we are missing a change in the business.
Dell’s two-year annual EPS growth of 20.5% was fantastic and topped its 13.3% two-year revenue growth.
Diving into Dell’s quality of earnings can give us a better understanding of its performance. While we mentioned earlier that Dell’s operating margin was flat this quarter, a two-year view shows its margin has expanded. This was the most relevant factor (aside from the revenue impact) behind its higher earnings; interest expenses and taxes can also affect EPS but don’t tell us as much about a company’s fundamentals.
In Q4, Dell reported adjusted EPS of $3.89, up from $2.68 in the same quarter last year. This print easily cleared analysts’ estimates, and shareholders should be content with the results. Over the next 12 months, Wall Street expects Dell’s full-year EPS of $10.35 to grow 10.6%.
8. Cash Is King
Although earnings are undoubtedly valuable for assessing company performance, we believe cash is king because you can’t use accounting profits to pay the bills.
Dell has shown mediocre cash profitability over the last five years, giving the company limited opportunities to return capital to shareholders. Its free cash flow margin averaged 4.9%, subpar for a business services business.
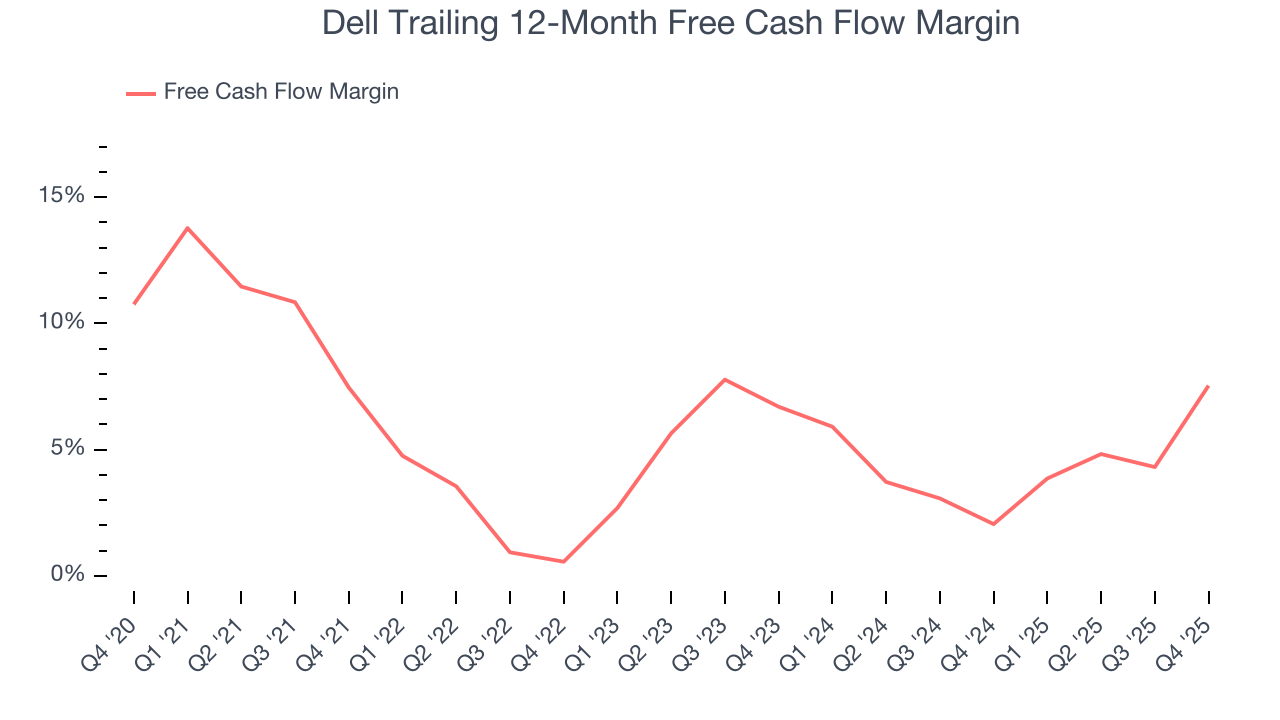
Dell’s free cash flow clocked in at $3.95 billion in Q4, equivalent to a 11.8% margin. This result was good as its margin was 12.3 percentage points higher than in the same quarter last year. Its cash profitability was also above its five-year level, and we hope the company can build on this trend.
9. Return on Invested Capital (ROIC)
EPS and free cash flow tell us whether a company was profitable while growing its revenue. But was it capital-efficient? A company’s ROIC explains this by showing how much operating profit it makes compared to the money it has raised (debt and equity).
Although Dell hasn’t been the highest-quality company lately, it found a few growth initiatives in the past that worked out wonderfully. Its five-year average ROIC was 43.7%, splendid for a business services business.
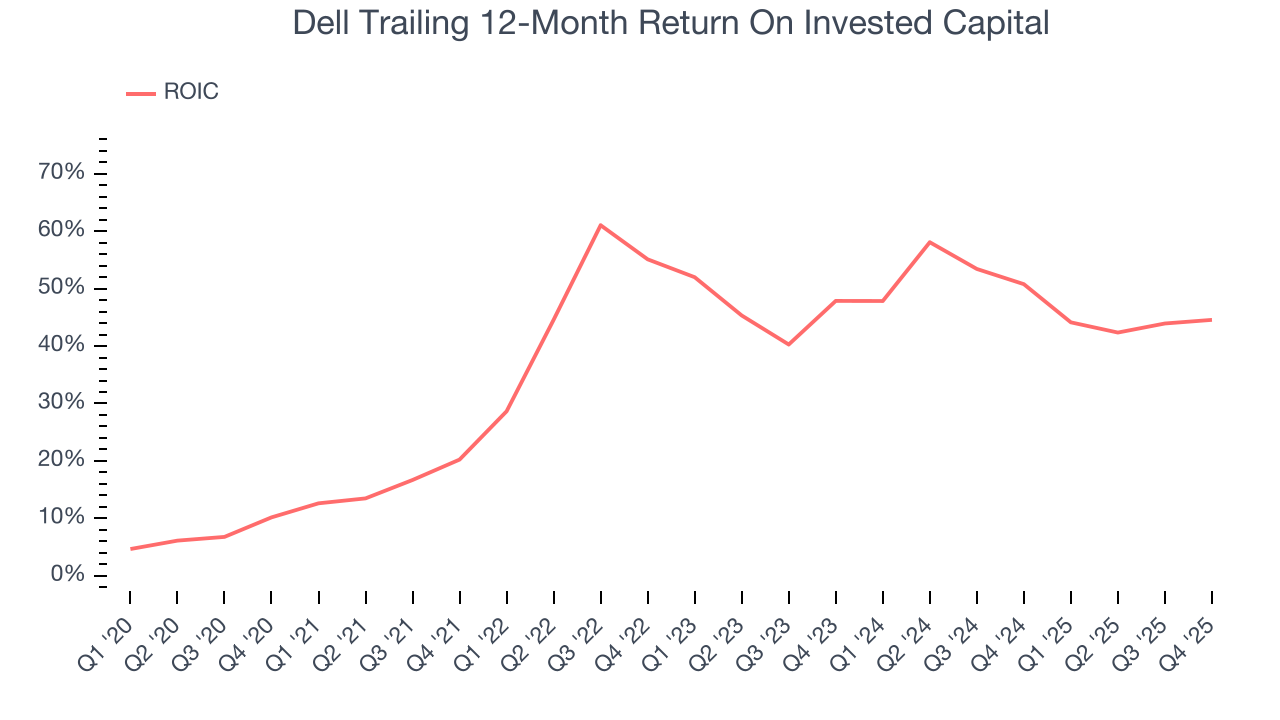
We like to invest in businesses with high returns, but the trend in a company’s ROIC is what often surprises the market and moves the stock price. Over the last few years, Dell’s ROIC has increased. This is a good sign, and if its returns keep rising, there’s a chance it could evolve into an investable business.
10. Balance Sheet Assessment
Dell reported $11.53 billion of cash and $31.5 billion of debt on its balance sheet in the most recent quarter. As investors in high-quality companies, we primarily focus on two things: 1) that a company’s debt level isn’t too high and 2) that its interest payments are not excessively burdening the business.
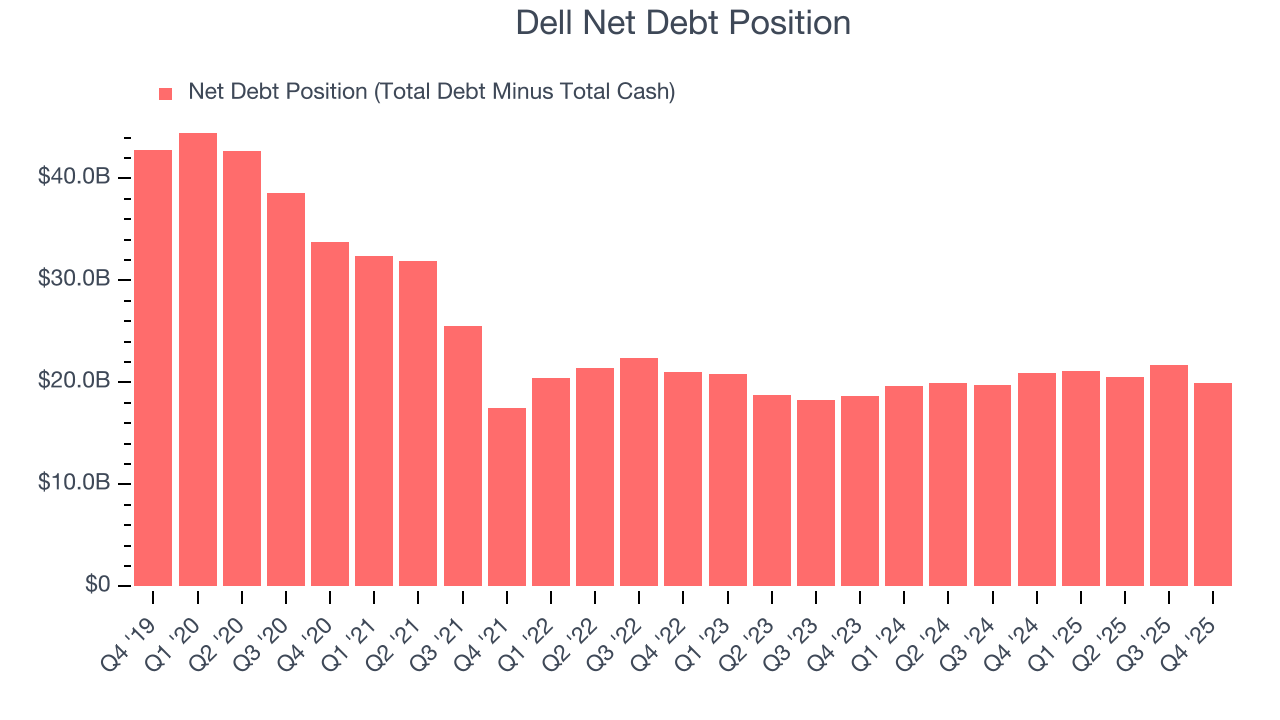
With $12.52 billion of EBITDA over the last 12 months, we view Dell’s 1.6× net-debt-to-EBITDA ratio as safe. We also see its $886 million of annual interest expenses as appropriate. The company’s profits give it plenty of breathing room, allowing it to continue investing in growth initiatives.
11. Key Takeaways from Dell’s Q4 Results
We were impressed by how significantly Dell blew past analysts’ EPS guidance for next quarter expectations this quarter. We were also excited its revenue outperformed Wall Street’s estimates by a wide margin. Zooming out, we think this was a good print with some key areas of upside. The stock traded up 9.9% to $134.16 immediately following the results.
12. Is Now The Time To Buy Dell?
Updated: March 21, 2026 at 12:18 AM EDT
We think that the latest earnings result is only one piece of the bigger puzzle. If you’re deciding whether to own Dell, you should also grasp the company’s longer-term business quality and valuation.
Dell is a rock-solid business worth owning. For starters, its revenue growth was decent over the last five years and is expected to accelerate over the next 12 months. On top of that, its scale makes it a trusted partner with negotiating leverage, and its projected EPS for the next year implies the company’s fundamentals will improve.
Dell’s P/E ratio based on the next 12 months is 12.2x. Scanning the business services space today, Dell’s fundamentals really stand out, and we like it at this price.
Wall Street analysts have a consensus one-year price target of $167.87 on the company (compared to the current share price of $159.92), implying they see 5% upside in buying Dell in the short term.