HP (HPQ)
HP is up against the odds. Its flat sales show demand is soft and its weak profitability limits how much it can reinvest to ignite growth.― StockStory Analyst Team
1. News


2. Summary
Why We Think HP Will Underperform
Born from the legendary Silicon Valley garage startup founded by Bill Hewlett and Dave Packard in 1939, HP (NYSE:HPQ) designs and sells personal computers, printers, and related technology products and services to consumers, businesses, and enterprises worldwide.
- Products and services are facing end-market challenges during this cycle, as seen in its flat sales over the last five years
- Earnings per share fell by 2.8% annually over the last two years while its revenue grew, showing its incremental sales were much less profitable
- Projected sales are flat for the next 12 months, implying demand will slow from its two-year trend


HP falls short of our expectations. We’re on the lookout for more interesting opportunities.
Why There Are Better Opportunities Than HP


At $19.26 per share, HP trades at 6.3x forward P/E. HP’s valuation may seem like a great deal, but we think there are valid reasons why it’s so cheap.
We’d rather pay up for companies with elite fundamentals than get a bargain on weak ones. Cheap stocks can be value traps, and as their performance deteriorates, they will stay cheap or get even cheaper.
3. HP (HPQ) Research Report: Q3 CY2025 Update
Personal computing and printing company HP (NYSE:HPQ) reported Q3 CY2025 results topping the market’s revenue expectations, with sales up 4.2% year on year to $14.64 billion. Its non-GAAP profit of $0.93 per share was in line with analysts’ consensus estimates.
HP (HPQ) Q3 CY2025 Highlights:
- Revenue: $14.64 billion vs analyst estimates of $14.54 billion (4.2% year-on-year growth, 0.7% beat)
- Adjusted EPS: $0.93 vs analyst estimates of $0.92 (in line)
- Adjusted EBITDA: $1.26 billion vs analyst estimates of $1.44 billion (8.6% margin, 12.9% miss)
- Adjusted EPS guidance for the upcoming financial year 2026 is $3.05 at the midpoint, missing analyst estimates by 8.4%
- Operating Margin: 6.6%, in line with the same quarter last year
- Free Cash Flow Margin: 9.7%, similar to the same quarter last year
- Market Capitalization: $22.79 billion
Company Overview
Born from the legendary Silicon Valley garage startup founded by Bill Hewlett and Dave Packard in 1939, HP (NYSE:HPQ) designs and sells personal computers, printers, and related technology products and services to consumers, businesses, and enterprises worldwide.
HP operates through three main segments: Personal Systems, Printing, and Corporate Investments. The Personal Systems division offers a wide range of computing devices including desktops, notebooks, workstations, and AI-enabled PCs under brands like Spectre, Envy, Omen, and Elite. These products serve both consumer and commercial markets, with specialized offerings for gamers, professionals, and enterprise customers.
The Printing segment encompasses both hardware and supplies, with solutions for home, office, and commercial environments. Beyond traditional printers, HP has expanded into graphics printing for businesses and 3D printing technologies that enable industrial manufacturing applications. The company generates significant recurring revenue through its printer supplies business, which includes ink and toner cartridges.
HP's business model combines direct sales with an extensive partner network of retailers, resellers, and distributors. A customer might purchase an HP laptop from a retail store like Best Buy, order directly from HP's website, or acquire equipment through a corporate purchasing agreement. For enterprise clients, HP often provides comprehensive solutions that include hardware, software, and services.
Manufacturing is primarily handled through outsourced partners, though HP maintains control over design and quality. This approach gives the company flexibility in its supply chain while allowing it to focus on innovation and customer relationships.
HP has invested heavily in security features across its product lines, incorporating hardware-level protections in both computers and printers to address growing cybersecurity concerns. The company has also been expanding its subscription-based services, offering options like HP Instant Ink that automatically delivers new cartridges when printers run low.
4. Hardware & Infrastructure
The Hardware & Infrastructure sector will be buoyed by demand related to AI adoption, cloud computing expansion, and the need for more efficient data storage and processing solutions. Companies with tech offerings such as servers, switches, and storage solutions are well-positioned in our new hybrid working and IT world. On the other hand, headwinds include ongoing supply chain disruptions, rising component costs, and intensifying competition from cloud-native and hyperscale providers reducing reliance on traditional hardware. Additionally, regulatory scrutiny over data sovereignty, cybersecurity standards, and environmental sustainability in hardware manufacturing could increase compliance costs.
HP's main competitors in personal computing include Dell Technologies (NYSE:DELL), Lenovo Group (OTC:LNVGY), Apple (NASDAQ:AAPL), and Acer. In the printing business, HP competes with Canon (NYSE:CAJ), Xerox (NASDAQ:XRX), Brother Industries (OTC:BRTHY), and Epson (OTC:SEKEY).
5. Revenue Growth
Reviewing a company’s long-term sales performance reveals insights into its quality. Even a bad business can shine for one or two quarters, but a top-tier one grows for years.
With $55.3 billion in revenue over the past 12 months, HP is a behemoth in the business services sector and benefits from economies of scale, giving it an edge in distribution. This also enables it to gain more leverage on its fixed costs than smaller competitors and the flexibility to offer lower prices. However, its scale is a double-edged sword because it’s challenging to maintain high growth rates when you’ve already captured a large portion of the addressable market. For HP to boost its sales, it likely needs to adjust its prices, launch new offerings, or lean into foreign markets.
As you can see below, HP struggled to increase demand as its $55.3 billion of sales for the trailing 12 months was close to its revenue five years ago. This shows demand was soft, a poor baseline for our analysis.
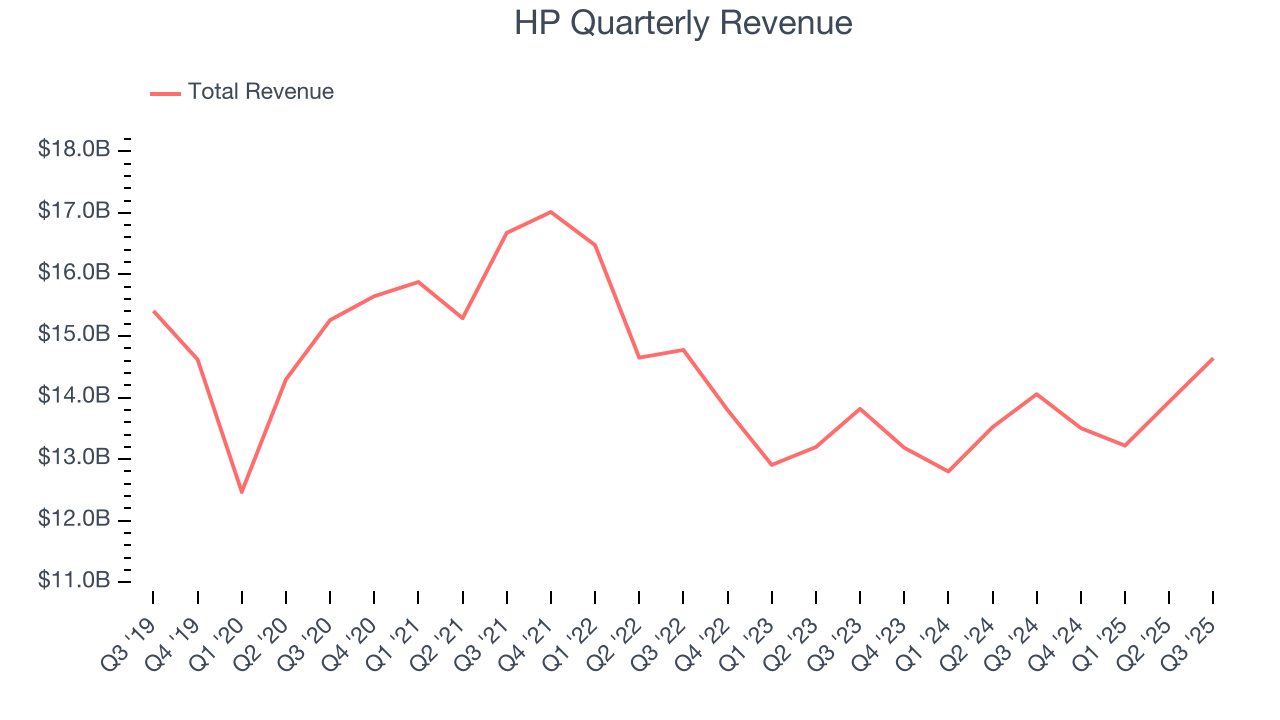
Long-term growth is the most important, but within business services, a half-decade historical view may miss new innovations or demand cycles. HP’s annualized revenue growth of 1.5% over the last two years is above its five-year trend, but we were still disappointed by the results. 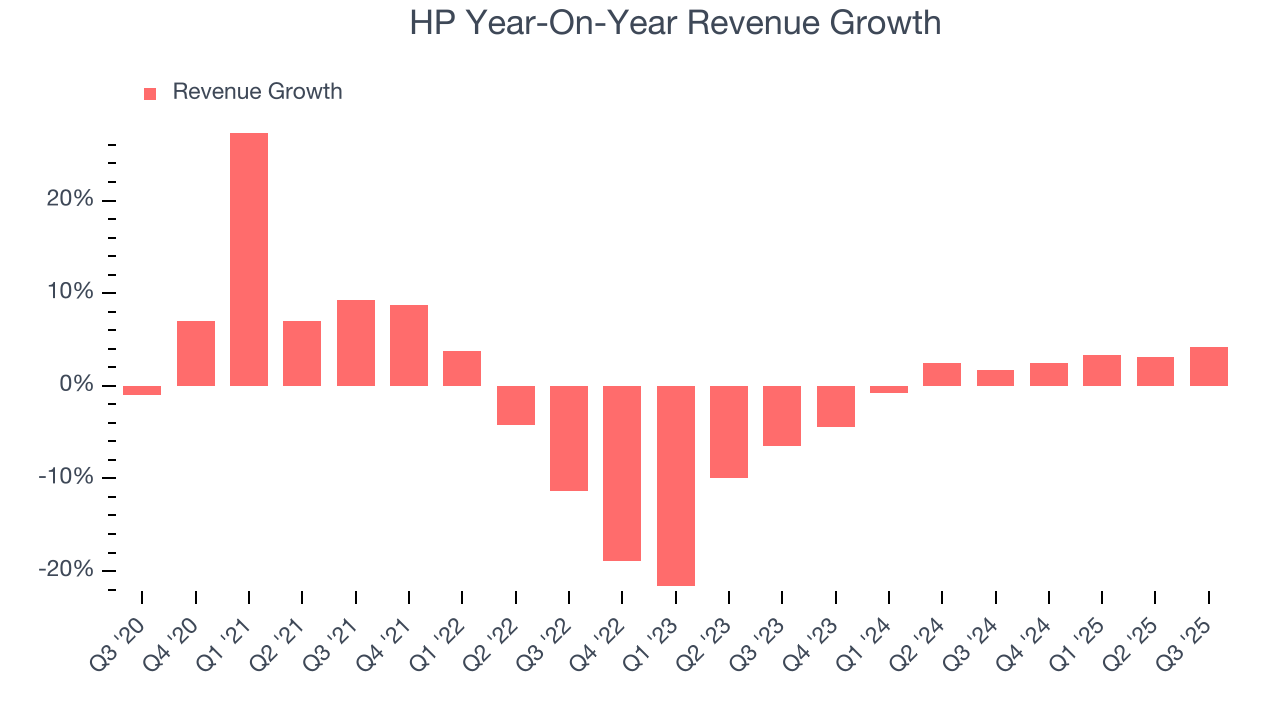
We can better understand the company’s revenue dynamics by analyzing its most important segments, Commercial Personal Systems and Commercial Printing, which are 47.6% and 29.1% of revenue. Over the last two years, HP’s Commercial Personal Systems revenue (desktops, laptops, etc.) averaged 5.5% year-on-year growth. On the other hand, its Commercial Printing revenue (commercial or industrial printers) averaged 3.7% declines. 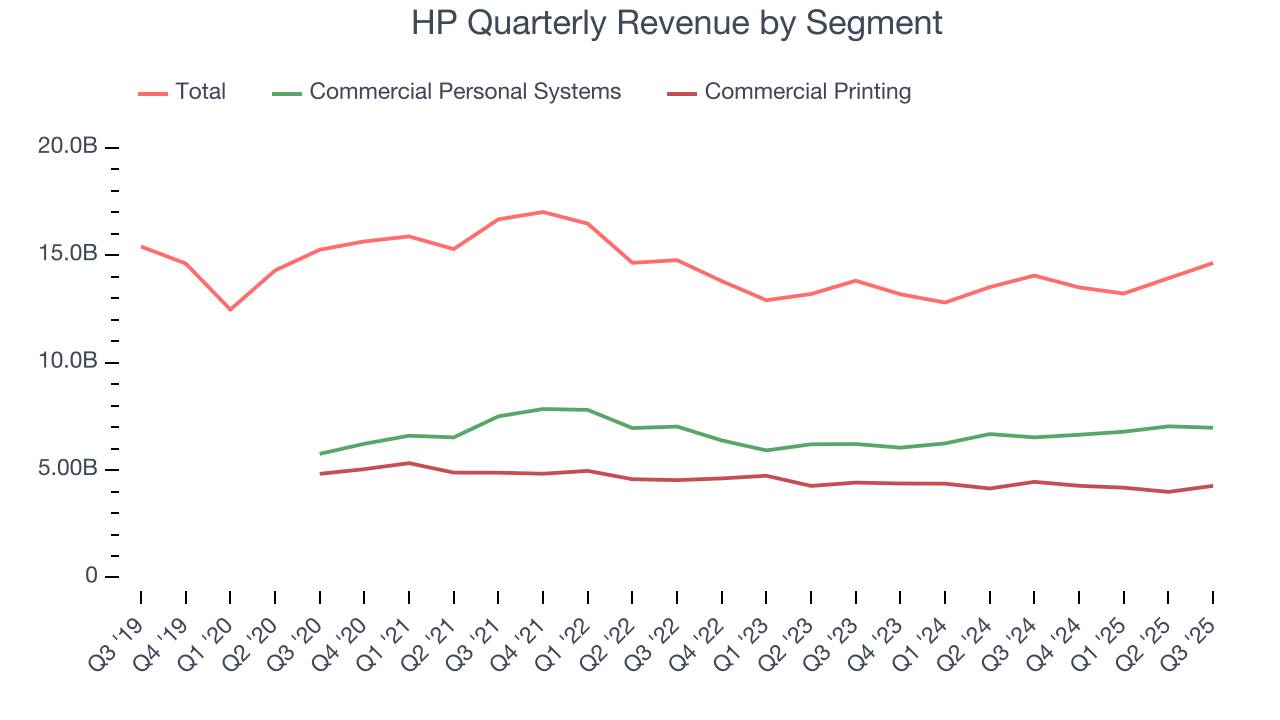
This quarter, HP reported modest year-on-year revenue growth of 4.2% but beat Wall Street’s estimates by 0.7%.
Looking ahead, sell-side analysts expect revenue to grow 1.8% over the next 12 months, similar to its two-year rate. This projection doesn't excite us and indicates its newer products and services will not catalyze better top-line performance yet.
6. Operating Margin
Operating margin is an important measure of profitability as it shows the portion of revenue left after accounting for all core expenses – everything from the cost of goods sold to advertising and wages. It’s also useful for comparing profitability across companies with different levels of debt and tax rates because it excludes interest and taxes.
HP was profitable over the last five years but held back by its large cost base. Its average operating margin of 7% was weak for a business services business.
Analyzing the trend in its profitability, HP’s operating margin decreased by 2.6 percentage points over the last five years. HP’s performance was poor no matter how you look at it - it shows that costs were rising and it couldn’t pass them onto its customers.
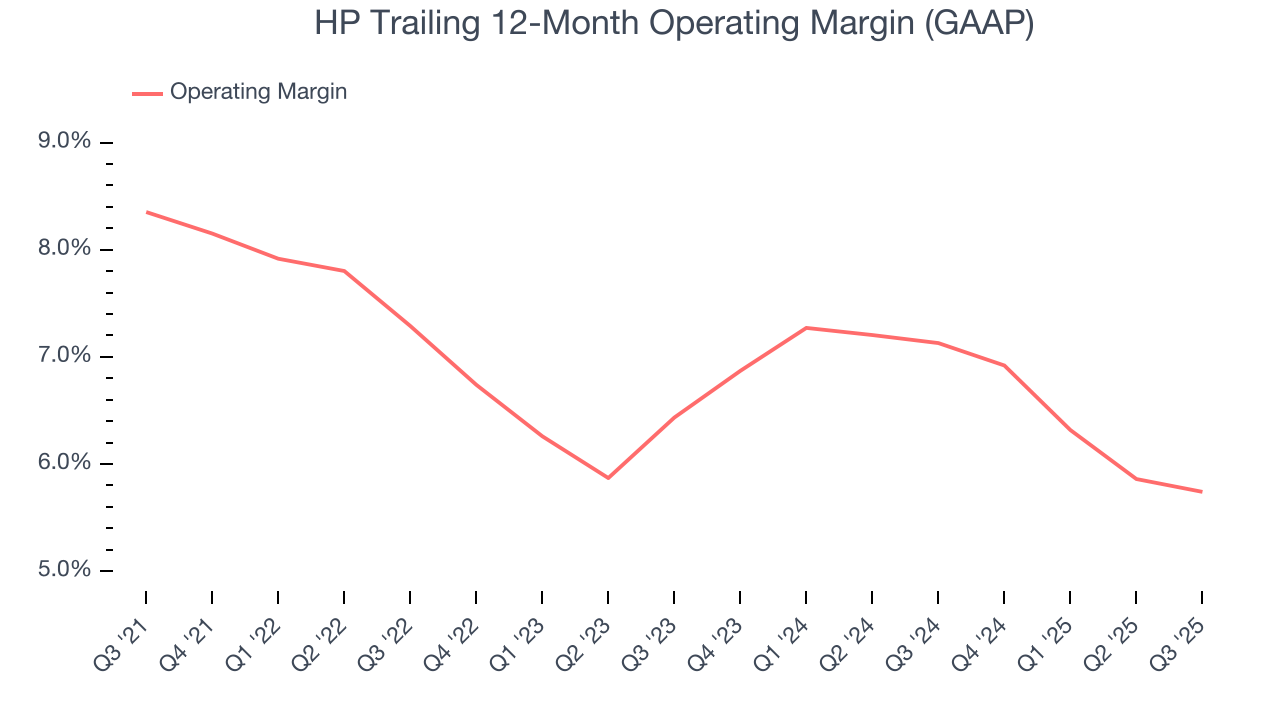
In Q3, HP generated an operating margin profit margin of 6.6%, in line with the same quarter last year. This indicates the company’s overall cost structure has been relatively stable.
7. Earnings Per Share
Revenue trends explain a company’s historical growth, but the long-term change in earnings per share (EPS) points to the profitability of that growth – for example, a company could inflate its sales through excessive spending on advertising and promotions.
HP’s EPS grew at an unimpressive 6.6% compounded annual growth rate over the last five years. This performance was better than its flat revenue but doesn’t tell us much about its business quality because its operating margin didn’t improve.
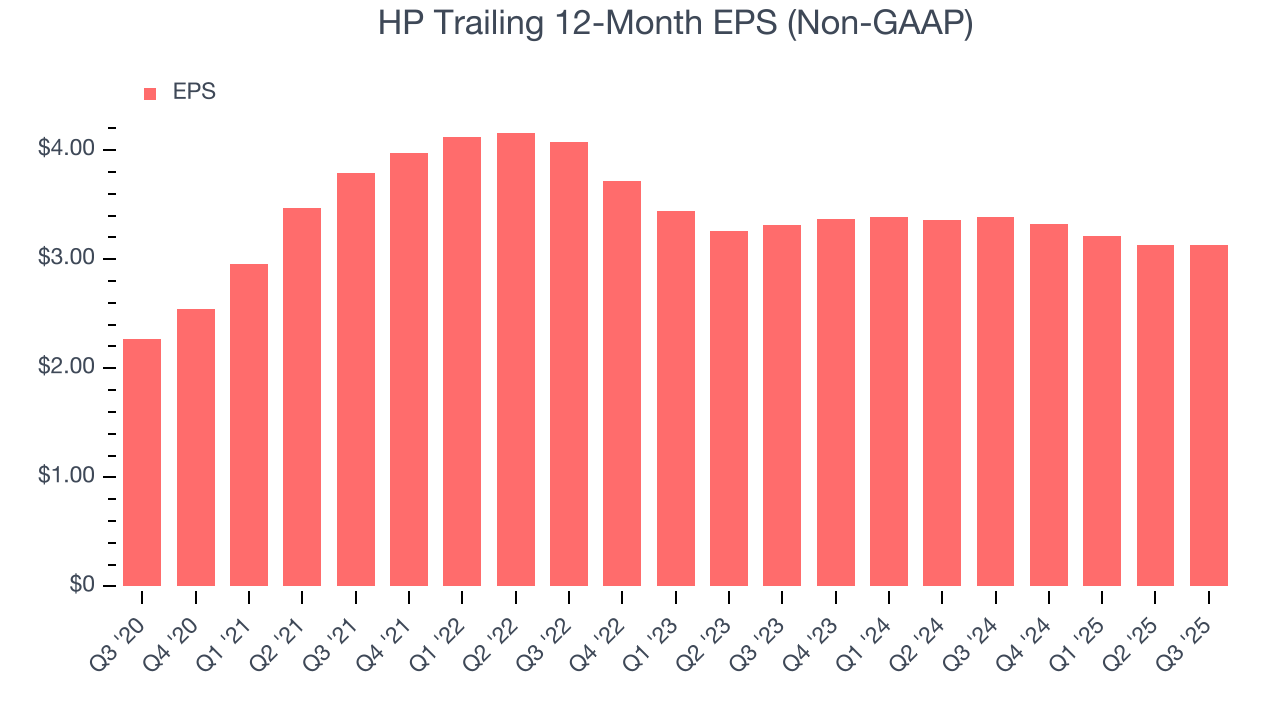
We can take a deeper look into HP’s earnings to better understand the drivers of its performance. A five-year view shows that HP has repurchased its stock, shrinking its share count by 30.1%. This tells us its EPS outperformed its revenue not because of increased operational efficiency but financial engineering, as buybacks boost per share earnings. 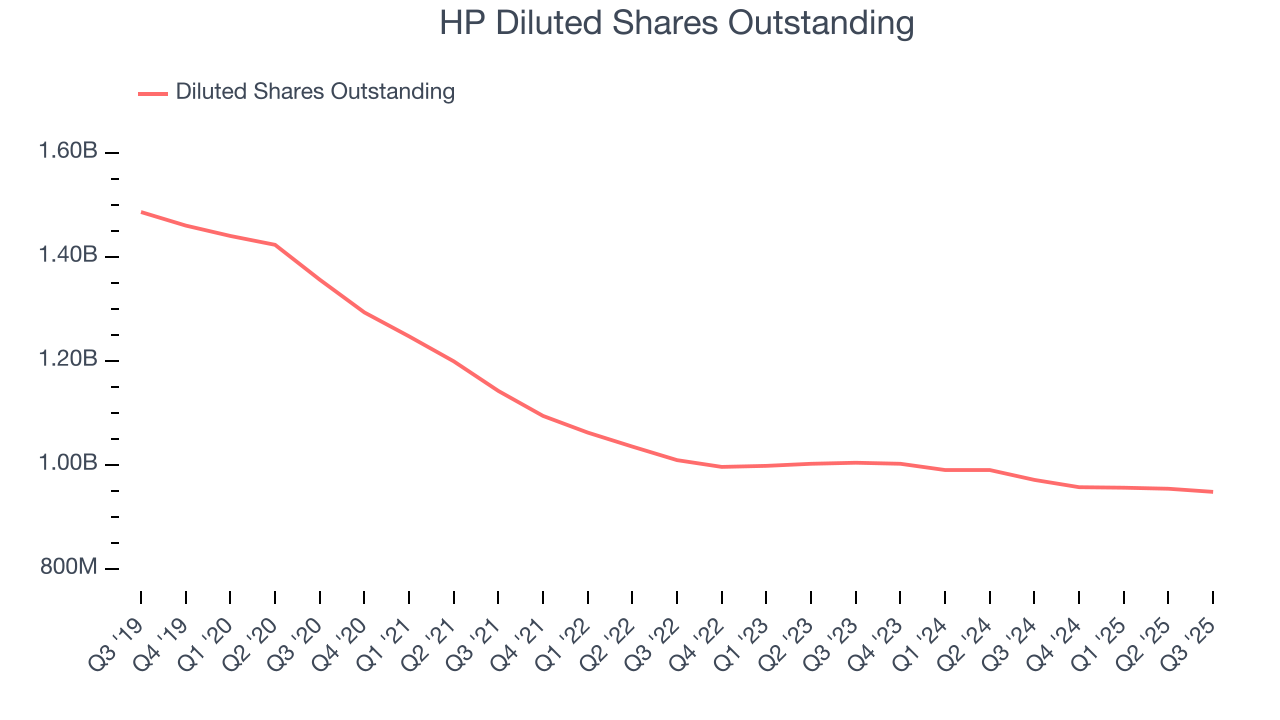
Like with revenue, we analyze EPS over a shorter period to see if we are missing a change in the business.
For HP, its two-year annual EPS declines of 2.8% show it’s continued to underperform. These results were bad no matter how you slice the data.
In Q3, HP reported adjusted EPS of $0.93, in line with the same quarter last year. This print was close to analysts’ estimates. Over the next 12 months, Wall Street expects HP’s full-year EPS of $3.13 to grow 5.2%.
8. Cash Is King
Although earnings are undoubtedly valuable for assessing company performance, we believe cash is king because you can’t use accounting profits to pay the bills.
HP has shown decent cash profitability, giving it some flexibility to reinvest or return capital to investors. The company’s free cash flow margin averaged 6.4% over the last five years, slightly better than the broader business services sector.
Taking a step back, we can see that HP’s margin dropped by 4.1 percentage points during that time. If its declines continue, it could signal increasing investment needs and capital intensity.
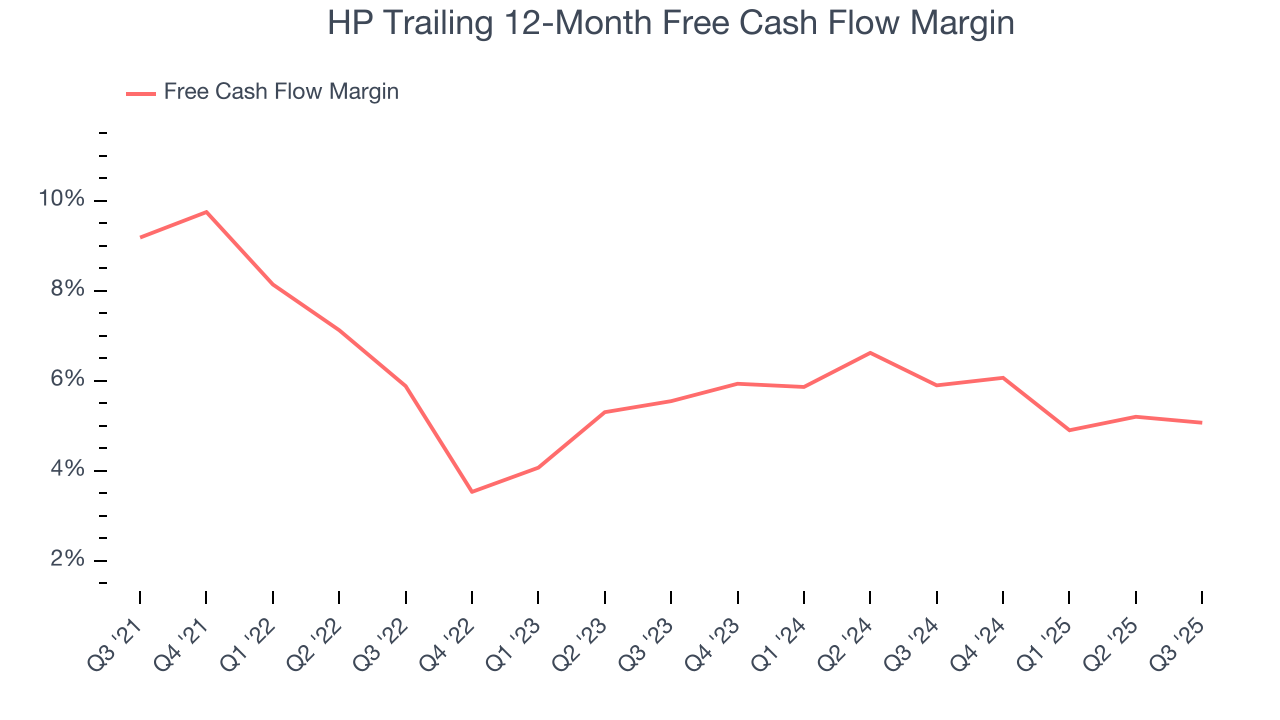
HP’s free cash flow clocked in at $1.43 billion in Q3, equivalent to a 9.7% margin. This cash profitability was in line with the comparable period last year and above its five-year average.
9. Balance Sheet Assessment
HP reported $3.71 billion of cash and $9.67 billion of debt on its balance sheet in the most recent quarter. As investors in high-quality companies, we primarily focus on two things: 1) that a company’s debt level isn’t too high and 2) that its interest payments are not excessively burdening the business.
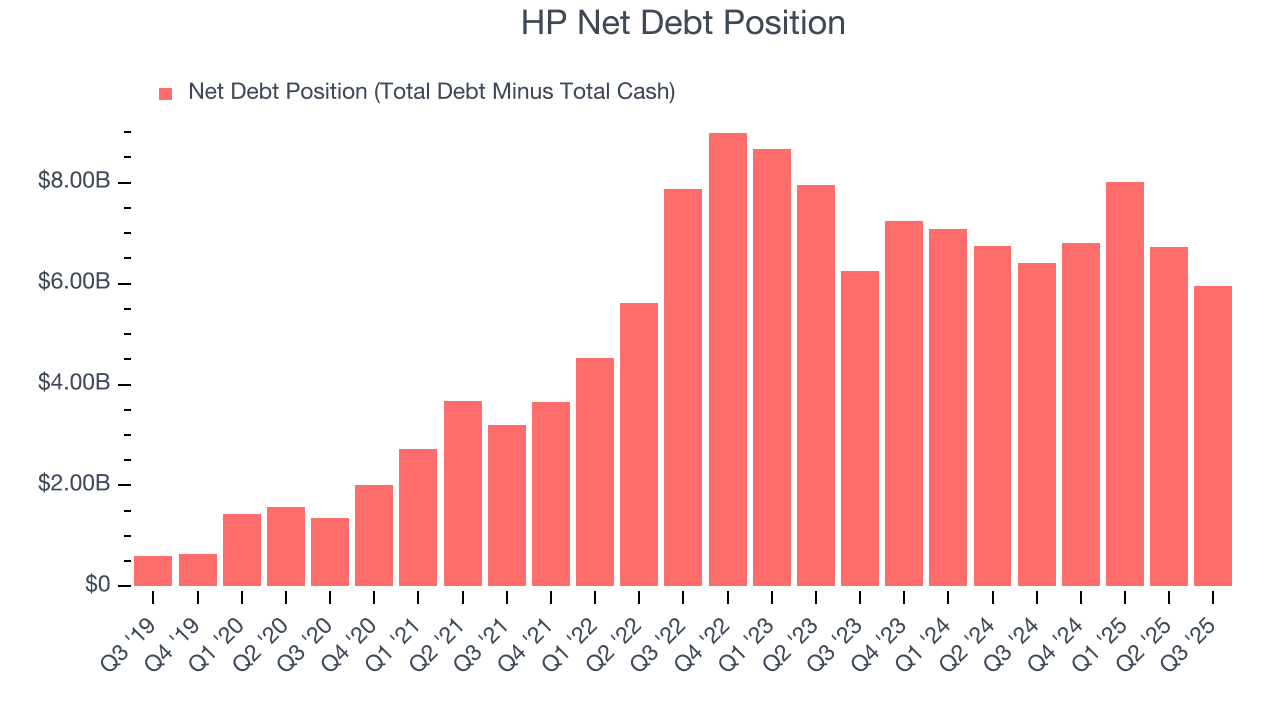
With $4.62 billion of EBITDA over the last 12 months, we view HP’s 1.3× net-debt-to-EBITDA ratio as safe. We also see its $454 million of annual interest expenses as appropriate. The company’s profits give it plenty of breathing room, allowing it to continue investing in growth initiatives.
10. Key Takeaways from HP’s Q3 Results
It was good to see HP narrowly top analysts’ revenue expectations this quarter. On the other hand, its full-year EPS guidance missed and its EPS guidance for next quarter fell slightly short of Wall Street’s estimates. Overall, this quarter could have been better. The stock traded down 5.8% to $22.92 immediately following the results.
11. Is Now The Time To Buy HP?
Updated: February 14, 2026 at 11:24 PM EST
Before making an investment decision, investors should account for HP’s business fundamentals and valuation in addition to what happened in the latest quarter.
We cheer for all companies making their customers lives easier, but in the case of HP, we’ll be cheering from the sidelines. First off, its revenue growth was weak over the last five years. While its scale makes it a trusted partner with negotiating leverage, the downside is its projected EPS for the next year is lacking. On top of that, its cash profitability fell over the last five years.
HP’s P/E ratio based on the next 12 months is 6.3x. While this valuation is optically cheap, the potential downside is huge given its shaky fundamentals. There are better investments elsewhere.
Wall Street analysts have a consensus one-year price target of $24.14 on the company (compared to the current share price of $19.26).
Although the price target is bullish, readers should exercise caution because analysts tend to be overly optimistic. The firms they work for, often big banks, have relationships with companies that extend into fundraising, M&A advisory, and other rewarding business lines. As a result, they typically hesitate to say bad things for fear they will lose out. We at StockStory do not suffer from such conflicts of interest, so we’ll always tell it like it is.