
OPENLANE (KAR)
We’re skeptical of OPENLANE. Its low returns on capital and plummeting sales suggest it struggles to generate demand and profits, a red flag.― StockStory Analyst Team
1. News


2. Summary
Why We Think OPENLANE Will Underperform
Facilitating the sale of approximately 1.3 million used vehicles in 2023, OPENLANE (NYSE:KAR) operates digital marketplaces that connect sellers and buyers of used vehicles across North America and Europe, facilitating wholesale transactions.
- Annual sales declines of 4% for the past five years show its products and services struggled to connect with the market during this cycle
- Below-average returns on capital indicate management struggled to find compelling investment opportunities
- High net-debt-to-EBITDA ratio of 5× could force the company to raise capital at unfavorable terms if market conditions deteriorate


OPENLANE’s quality is inadequate. We believe there are better opportunities elsewhere.
Why There Are Better Opportunities Than OPENLANE


OPENLANE’s stock price of $25.77 implies a valuation ratio of 19.5x forward P/E. This multiple rich for the business quality. Not a great combination.
Paying up for elite businesses with strong earnings potential is better than investing in lower-quality companies with shaky fundamentals. That’s how you avoid big downside over the long term.
3. OPENLANE (KAR) Research Report: Q3 CY2025 Update
Digital vehicle marketplace OPENLANE (NYSE:KAR) reported Q3 CY2025 results exceeding the market’s revenue expectations, with sales up 8.4% year on year to $498.4 million. Its non-GAAP profit of $0.35 per share was 27.6% above analysts’ consensus estimates.
OPENLANE (KAR) Q3 CY2025 Highlights:
- Revenue: $498.4 million vs analyst estimates of $470.5 million (8.4% year-on-year growth, 5.9% beat)
- Adjusted EPS: $0.35 vs analyst estimates of $0.27 (27.6% beat)
- Adjusted EBITDA: $87.1 million vs analyst estimates of $77.64 million (17.5% margin, 12.2% beat)
- Management raised its full-year Adjusted EPS guidance to $1.24 at the midpoint, a 8.3% increase
- EBITDA guidance for the full year is $330.5 million at the midpoint, above analyst estimates of $318.6 million
- Operating Margin: 11%, up from 9.2% in the same quarter last year
- Free Cash Flow Margin: 11.6%, down from 23.6% in the same quarter last year
- Market Capitalization: $2.82 billion
Company Overview
Facilitating the sale of approximately 1.3 million used vehicles in 2023, OPENLANE (NYSE:KAR) operates digital marketplaces that connect sellers and buyers of used vehicles across North America and Europe, facilitating wholesale transactions.
OPENLANE's digital platforms primarily serve two distinct customer groups: commercial sellers (including vehicle manufacturers, financial institutions, fleet operators, and rental companies) and dealer customers (both franchised and independent used vehicle dealers). The company generates revenue through auction fees charged to both sellers and buyers, as well as through a suite of ancillary services.
These value-added services include transportation logistics, where OPENLANE arranges vehicle delivery using both its own fleet and third-party carriers. For example, a dealer in Chicago might purchase a vehicle from a rental car company in Dallas and use OPENLANE's logistics services to transport it to their lot. The company also offers vehicle inspection services, reconditioning, title processing, and administrative support.
An important component of OPENLANE's business model is its Finance segment, operated through its subsidiary AFC. This division provides floorplan financing—short-term loans secured by vehicle inventory—primarily to independent dealers. When a dealer purchases a vehicle through OPENLANE's marketplace, AFC might finance that purchase, collecting origination fees and interest until the loan is repaid, typically when the dealer sells the vehicle to a retail customer.
OPENLANE's technology platform supports more than 40 private-label digital remarketing sites for commercial customers and offers multiple sale formats for dealers. The company maintains vehicle logistics centers in Canada where physical vehicles can be inspected, while still being sold through digital channels using simulcast technology.
Unlike traditional physical auctions, OPENLANE generally doesn't take ownership of the vehicles sold through its marketplaces, instead facilitating direct transfers between sellers and buyers. This asset-light approach allows the company to operate efficiently across geographic boundaries, serving customers throughout North America and Europe.
4. Asset Management & Auction Services
Like in other industries, the shift to online platforms can lower transaction costs and improve liquidity for sellers. Increasing digitization, AI-driven pricing analytics, and automation in logistics can enhance efficiency for operators who invest in technology and software. On the other hand, challenges include potential regulatory scrutiny on auction transparency, data privacy concerns with AI-driven valuation models, and shifting environmental policies that could impact the resale market for internal combustion vehicles. Additionally, supply chain volatility in new car production may create unpredictable swings in used vehicle supply, impacting auction volumes.
OPENLANE's primary competitors in the North American wholesale used vehicle marketplace include Manheim (owned by Cox Automotive), Carvana's ADESA auction business, ACV Auctions (NASDAQ: ACVA), and America's Auto Auction. In the floorplan financing segment, AFC competes primarily with NextGear Capital, also owned by Cox Automotive.
5. Revenue Growth
A company’s long-term sales performance can indicate its overall quality. Any business can put up a good quarter or two, but the best consistently grow over the long haul.
With $1.9 billion in revenue over the past 12 months, OPENLANE is a mid-sized business services company, which sometimes brings disadvantages compared to larger competitors benefiting from better economies of scale.
As you can see below, OPENLANE’s demand was weak over the last five years. Its sales fell by 4% annually, a rough starting point for our analysis.
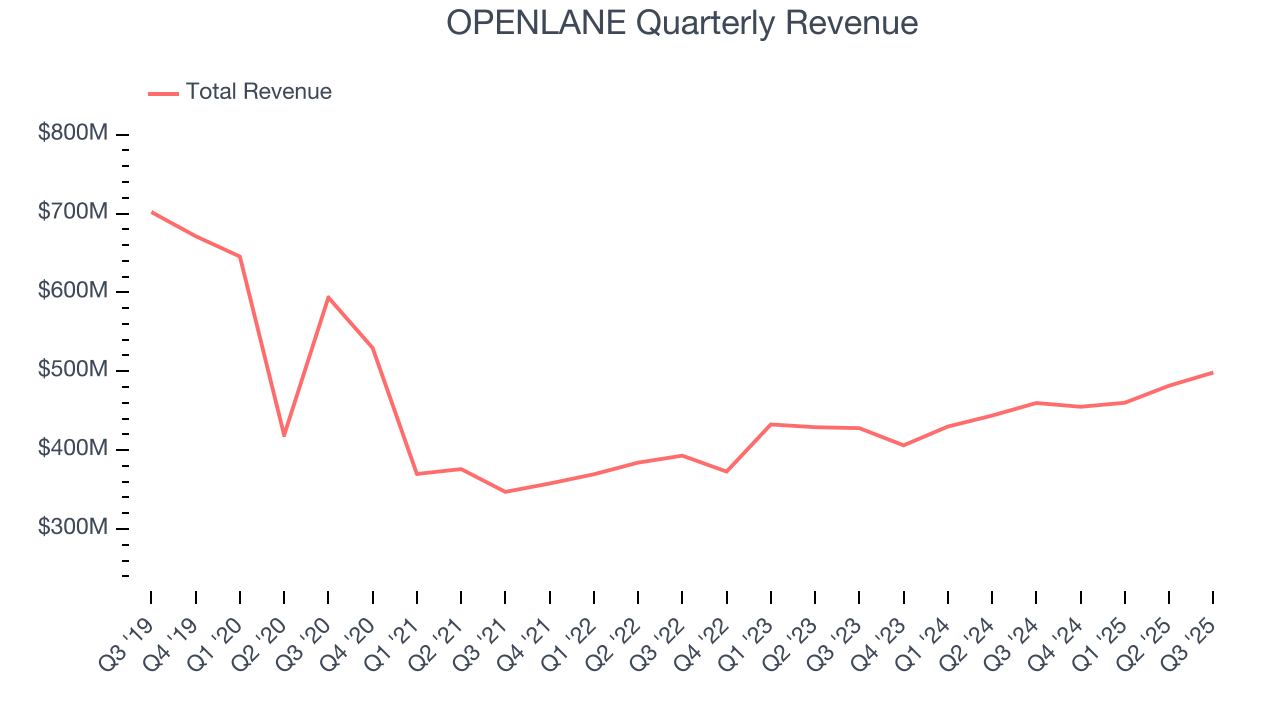
We at StockStory place the most emphasis on long-term growth, but within business services, a half-decade historical view may miss recent innovations or disruptive industry trends. OPENLANE’s annualized revenue growth of 6.8% over the last two years is above its five-year trend, suggesting some bright spots. 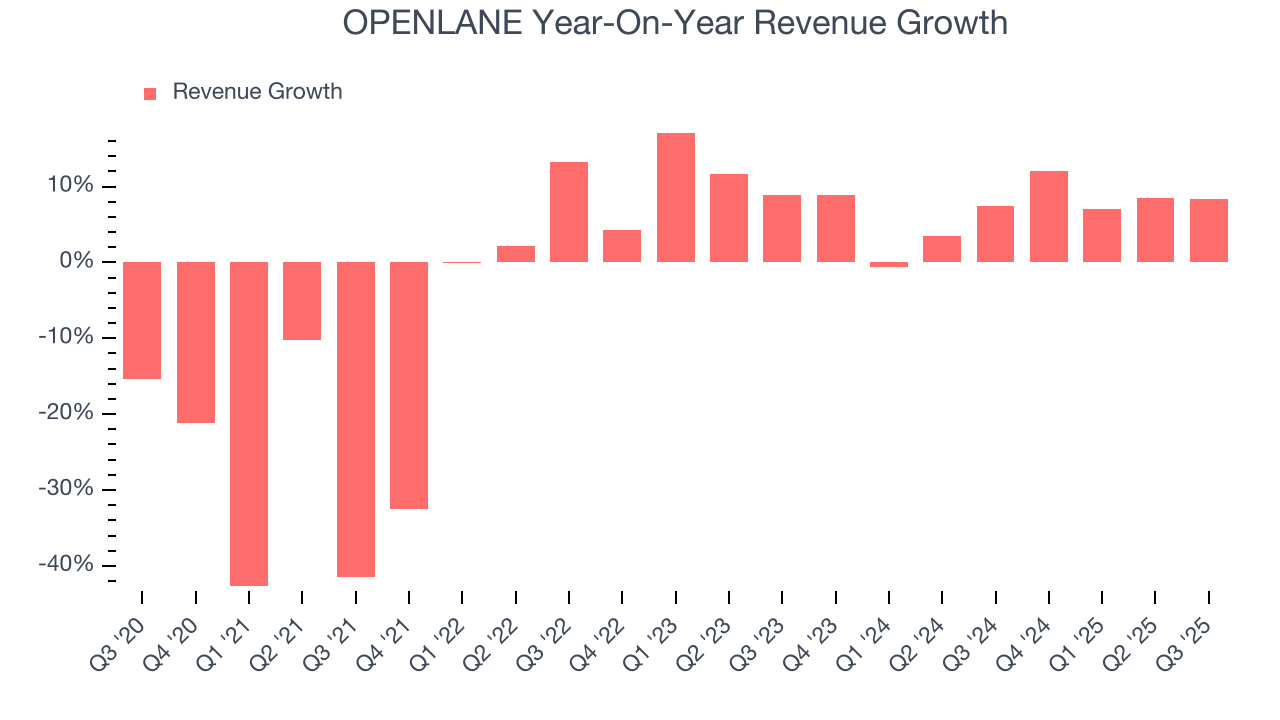
This quarter, OPENLANE reported year-on-year revenue growth of 8.4%, and its $498.4 million of revenue exceeded Wall Street’s estimates by 5.9%.
Looking ahead, sell-side analysts expect revenue to remain flat over the next 12 months, a deceleration versus the last two years. This projection is underwhelming and suggests its products and services will face some demand challenges.
6. Operating Margin
Operating margin is a key measure of profitability. Think of it as net income - the bottom line - excluding the impact of taxes and interest on debt, which are less connected to business fundamentals.
OPENLANE was profitable over the last five years but held back by its large cost base. Its average operating margin of 7.3% was weak for a business services business.
On the plus side, OPENLANE’s operating margin rose by 5.6 percentage points over the last five years.
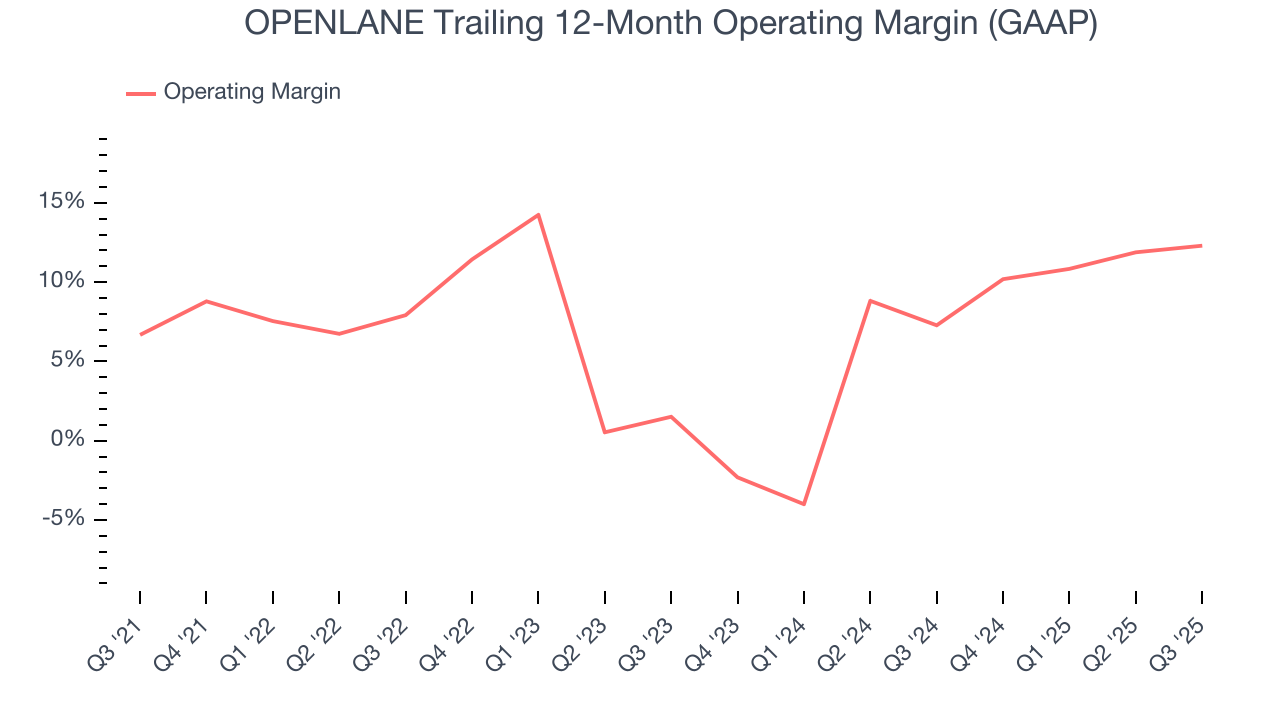
In Q3, OPENLANE generated an operating margin profit margin of 11%, up 1.8 percentage points year on year. This increase was a welcome development and shows it was more efficient.
7. Earnings Per Share
We track the long-term change in earnings per share (EPS) for the same reason as long-term revenue growth. Compared to revenue, however, EPS highlights whether a company’s growth is profitable.
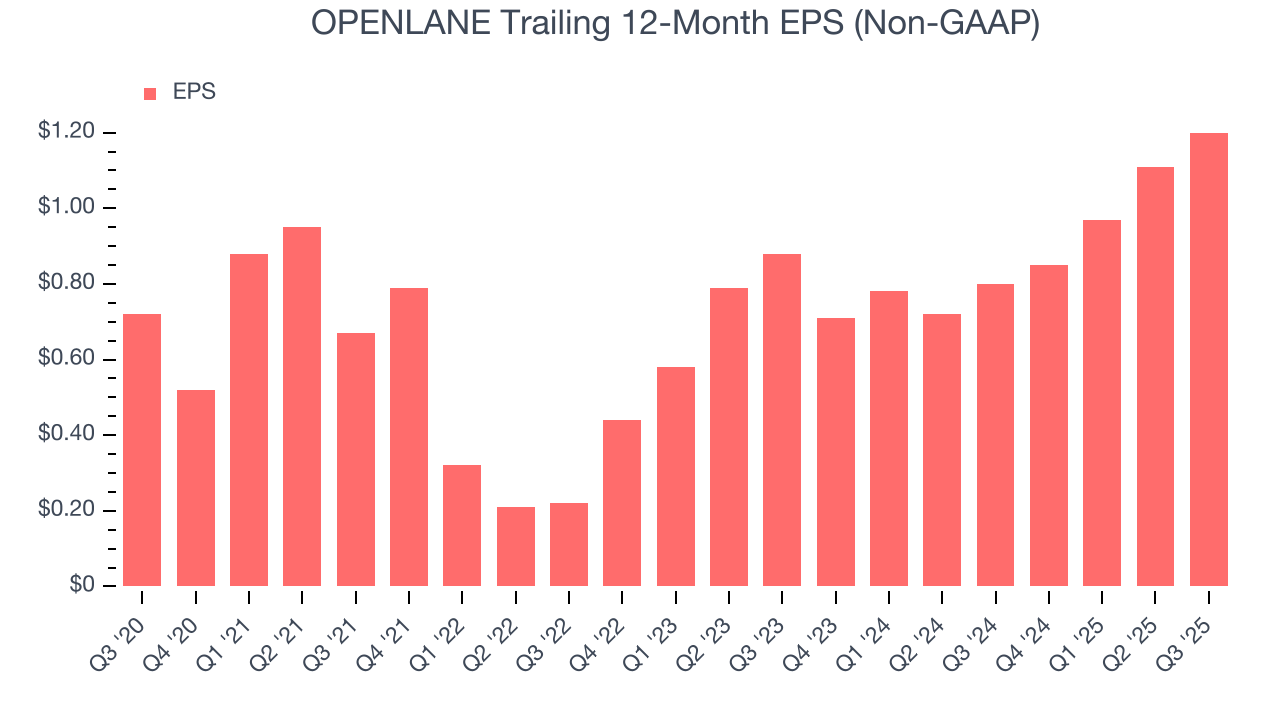
OPENLANE’s EPS grew at a remarkable 10.8% compounded annual growth rate over the last five years, higher than its 4% annualized revenue declines. This tells us management adapted its cost structure in response to a challenging demand environment.
We can take a deeper look into OPENLANE’s earnings to better understand the drivers of its performance. As we mentioned earlier, OPENLANE’s operating margin expanded by 5.6 percentage points over the last five years. This was the most relevant factor (aside from the revenue impact) behind its higher earnings; interest expenses and taxes can also affect EPS but don’t tell us as much about a company’s fundamentals.
Like with revenue, we analyze EPS over a shorter period to see if we are missing a change in the business.
For OPENLANE, its two-year annual EPS growth of 16.8% was higher than its five-year trend. We love it when earnings growth accelerates, especially when it accelerates off an already high base.
In Q3, OPENLANE reported adjusted EPS of $0.35, up from $0.26 in the same quarter last year. This print easily cleared analysts’ estimates, and shareholders should be content with the results. Over the next 12 months, Wall Street expects OPENLANE’s full-year EPS of $1.20 to grow 3.1%.
8. Cash Is King
Free cash flow isn't a prominently featured metric in company financials and earnings releases, but we think it's telling because it accounts for all operating and capital expenses, making it tough to manipulate. Cash is king.
OPENLANE has shown mediocre cash profitability over the last five years, giving the company limited opportunities to return capital to shareholders. Its free cash flow margin averaged 4.8%, subpar for a business services business.
Taking a step back, we can see that OPENLANE’s margin dropped by 1.4 percentage points during that time. This along with its unexciting margin put the company in a tough spot, and shareholders are likely hoping it can reverse course. If the trend continues, it could signal it’s becoming a more capital-intensive business.
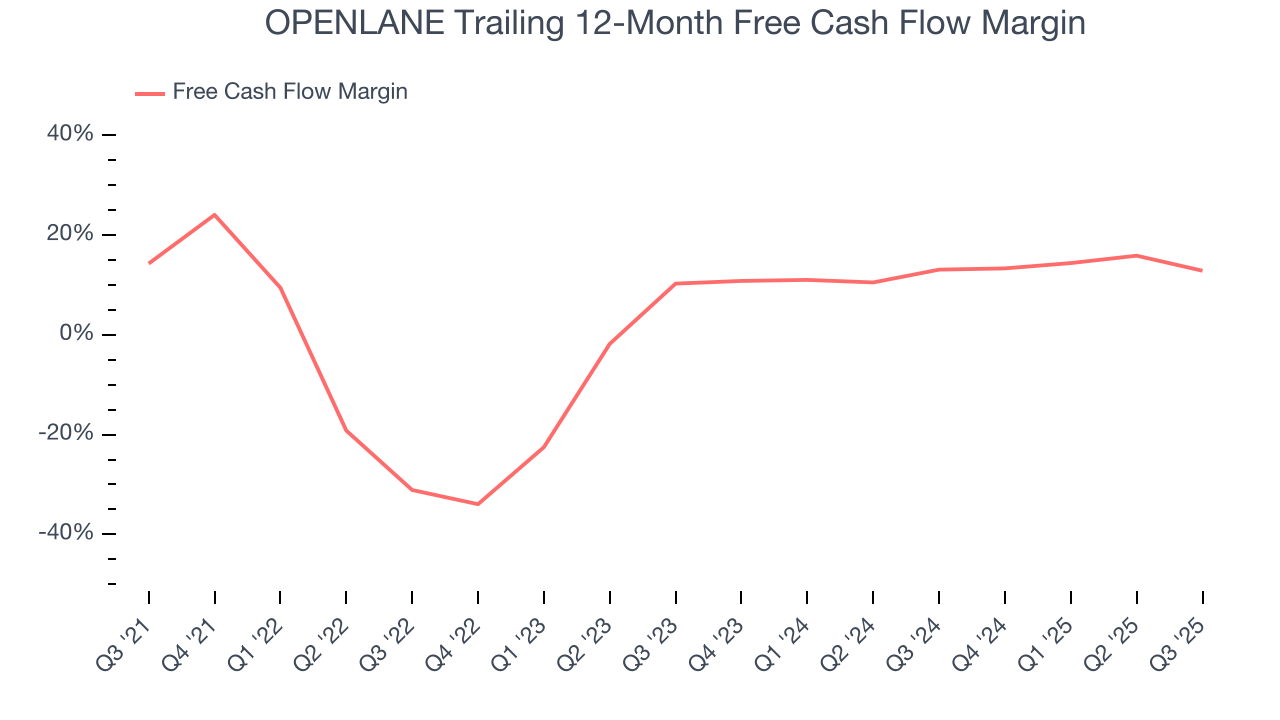
OPENLANE’s free cash flow clocked in at $57.6 million in Q3, equivalent to a 11.6% margin. The company’s cash profitability regressed as it was 12.1 percentage points lower than in the same quarter last year, but it’s still above its five-year average. We wouldn’t read too much into this quarter’s decline because investment needs can be seasonal, leading to short-term swings. Long-term trends are more important.
9. Return on Invested Capital (ROIC)
EPS and free cash flow tell us whether a company was profitable while growing its revenue. But was it capital-efficient? Enter ROIC, a metric showing how much operating profit a company generates relative to the money it has raised (debt and equity).
OPENLANE historically did a mediocre job investing in profitable growth initiatives. Its five-year average ROIC was 2.6%, lower than the typical cost of capital (how much it costs to raise money) for business services companies.

We like to invest in businesses with high returns, but the trend in a company’s ROIC is what often surprises the market and moves the stock price. Fortunately, OPENLANE’s ROIC averaged 1.4 percentage point increases over the last few years. This is a good sign, and we hope the company can continue improving.
10. Balance Sheet Risk
Debt is a tool that can boost company returns but presents risks if used irresponsibly. As long-term investors, we aim to avoid companies taking excessive advantage of this instrument because it could lead to insolvency.
OPENLANE’s $1.89 billion of debt exceeds the $146.4 million of cash on its balance sheet. Furthermore, its 5× net-debt-to-EBITDA ratio (based on its EBITDA of $329.3 million over the last 12 months) shows the company is overleveraged.
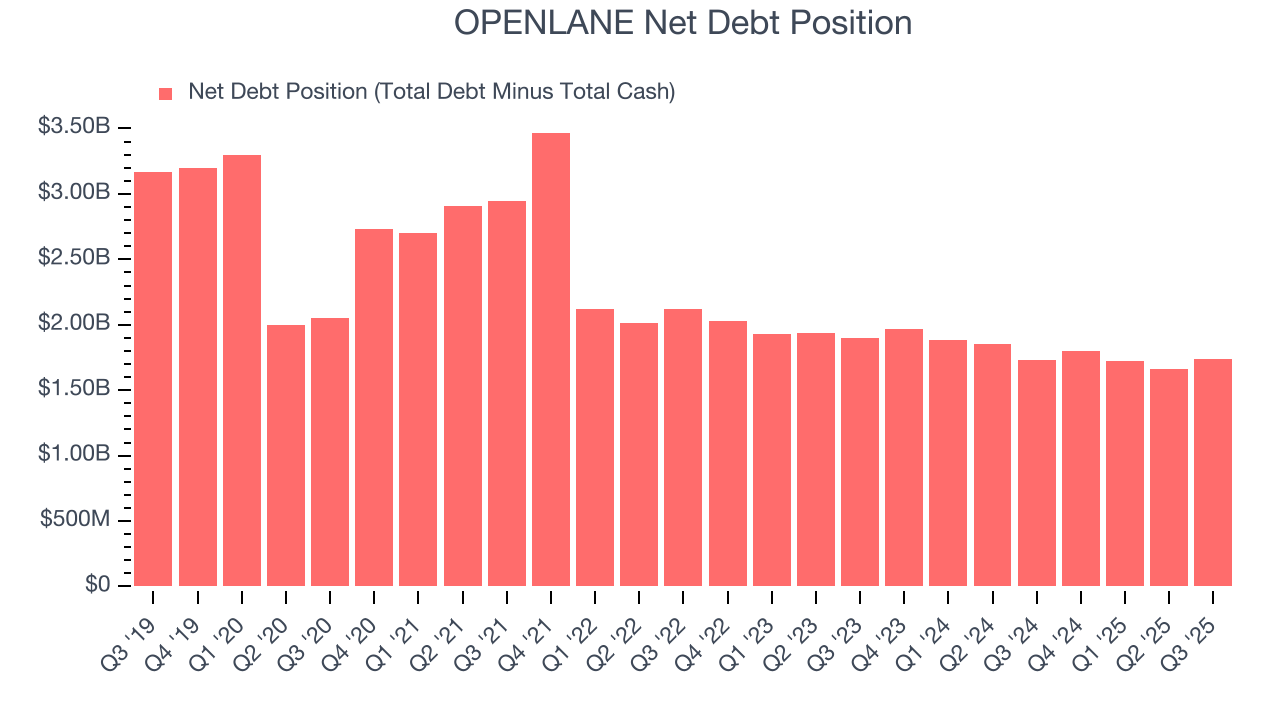
At this level of debt, incremental borrowing becomes increasingly expensive and credit agencies could downgrade the company’s rating if profitability falls. OPENLANE could also be backed into a corner if the market turns unexpectedly – a situation we seek to avoid as investors in high-quality companies.
We hope OPENLANE can improve its balance sheet and remain cautious until it increases its profitability or pays down its debt.
11. Key Takeaways from OPENLANE’s Q3 Results
It was good to see OPENLANE beat analysts’ EPS expectations this quarter. We were also excited its revenue outperformed Wall Street’s estimates by a wide margin. Zooming out, we think this was a solid print. The stock remained flat at $26.56 immediately following the results.
12. Is Now The Time To Buy OPENLANE?
Updated: December 4, 2025 at 11:28 PM EST
Are you wondering whether to buy OPENLANE or pass? We urge investors to not only consider the latest earnings results but also longer-term business quality and valuation as well.
OPENLANE isn’t a terrible business, but it doesn’t pass our bar. First off, its revenue has declined over the last five years. And while its expanding adjusted operating margin shows the business has become more efficient, the downside is its relatively low ROIC suggests management has struggled to find compelling investment opportunities. On top of that, its operating margins are low compared to other business services companies.
OPENLANE’s P/E ratio based on the next 12 months is 19.5x. Investors with a higher risk tolerance might like the company, but we don’t really see a big opportunity at the moment. We're fairly confident there are better stocks to buy right now.
Wall Street analysts have a consensus one-year price target of $31.81 on the company (compared to the current share price of $25.77).
Although the price target is bullish, readers should exercise caution because analysts tend to be overly optimistic. The firms they work for, often big banks, have relationships with companies that extend into fundraising, M&A advisory, and other rewarding business lines. As a result, they typically hesitate to say bad things for fear they will lose out. We at StockStory do not suffer from such conflicts of interest, so we’ll always tell it like it is.