
Oxford Industries (OXM)
Oxford Industries is up against the odds. Its sales have underperformed and its low returns on capital show it has few growth opportunities.― StockStory Analyst Team
1. News

2. Summary
Why We Think Oxford Industries Will Underperform
The parent company of Tommy Bahama, Oxford Industries (NYSE:OXM) is a lifestyle fashion conglomerate with brands that embody outdoor happiness.
- Lackluster 14.6% annual revenue growth over the last five years indicates the company is losing ground to competitors
- Operating margin falls short of the industry average, and the smaller profit dollars make it harder to react to unexpected market developments
- 5× net-debt-to-EBITDA ratio shows it’s overleveraged and increases the probability of shareholder dilution if things turn unexpectedly


Oxford Industries’s quality is insufficient. We’d search for superior opportunities elsewhere.
Why There Are Better Opportunities Than Oxford Industries


Oxford Industries is trading at $31.92 per share, or 11.3x forward P/E. Oxford Industries’s valuation may seem like a bargain, especially when stacked up against other consumer discretionary companies. We remind you that you often get what you pay for, though.
Cheap stocks can look like great bargains at first glance, but you often get what you pay for. These mediocre businesses often have less earnings power, meaning there is more reliance on a re-rating to generate good returns - an unlikely scenario for low-quality companies.
3. Oxford Industries (OXM) Research Report: Q4 CY2025 Update
Fashion conglomerate Oxford Industries (NYSE:OXM) reported Q4 CY2025 results exceeding the market’s revenue expectations, but sales fell by 4.1% year on year to $374.5 million. On the other hand, next quarter’s revenue guidance of $390 million was less impressive, coming in 0.6% below analysts’ estimates. Its non-GAAP loss of $0.09 per share was significantly below analysts’ consensus estimates.
Oxford Industries (OXM) Q4 CY2025 Highlights:
- Revenue: $374.5 million vs analyst estimates of $371.8 million (4.1% year-on-year decline, 0.7% beat)
- Adjusted EPS: -$0.09 vs analyst estimates of $0.03 (significant miss)
- Adjusted EBITDA: $8.1 million vs analyst estimates of $17.6 million (2.2% margin, 54% miss)
- Revenue Guidance for Q1 CY2026 is $390 million at the midpoint, below analyst estimates of $392.5 million
- Adjusted EPS guidance for the upcoming financial year 2026 is $2.40 at the midpoint, missing analyst estimates by 8.9%
- Operating Margin: -2.1%, down from 5.2% in the same quarter last year
- Free Cash Flow Margin: 9.2%, down from 12.4% in the same quarter last year
- Market Capitalization: $490.5 million
Company Overview
The parent company of Tommy Bahama, Oxford Industries (NYSE:OXM) is a lifestyle fashion conglomerate with brands that embody outdoor happiness.
Over the decades, Oxford Industries has established itself with its wide range of premium lifestyle brands including Lilly Pulitzer, Southern Tide, The Beaufort Bonnet Company, Johnny Was, and Duck Head.
Tommy Bahama, Oxford Industries's largest brand, embodies the laid-back luxury lifestyle, offering men's and women's sportswear, swimwear, accessories, and home furnishings. Lilly Pulitzer sports a similar style as it's known for its vibrant, colorful designs and resort wear while Southern Tide brings Southern charm to classic American sportswear.
Oxford Industries grew its portfolio of brands through acquisitions, selectively buying companies with loyal customer bases. The company's distribution strategy leverages a mix of wholesale and direct-to-consumer channels, including branded retail stores, e-commerce platforms, and department store partnerships. This multi-channel approach allows Oxford to reach a wide audience, adapting to the shifting retail landscape and consumer buying habits.
4. Consumer Discretionary - Apparel and Accessories
The Consumer Discretionary sector, by definition, is made up of companies selling non-essential goods and services. When economic conditions deteriorate or tastes shift, consumers can easily cut back or eliminate these purchases. For long-term investors with five-year holding periods, this creates a structural challenge: the sector is inherently hit-driven, with low switching costs and fickle customers. As a result, only a handful of companies can reliably grow demand and compound earnings over long periods, which is why our bar is high and High Quality ratings are rare.
Apparel and accessories companies design, brand, and distribute clothing, handbags, jewelry, and related lifestyle products, often spanning multiple price tiers. Tailwinds include premiumization trends (consumers trading up for perceived quality), international expansion into emerging markets, and growing digital commerce penetration. However, these businesses face headwinds from highly cyclical demand, intense promotional environments, and counterfeit competition undermining brand equity. Tariff volatility and sourcing concentration in a handful of countries add risk. Additionally, rapidly changing fashion cycles and the rise of ultra-fast-fashion digital competitors compress product life cycles and make demand forecasting exceptionally difficult.
Oxford Industries's primary competitors include PVH Corp (NYSE: PVH), Ralph Lauren (NYSE: RL), VF Corp (NYSE: VFC), Perry Ellis (NASDAQ: PERY), and Columbia Sportswear (NASDAQ: COLM).
5. Revenue Growth
Reviewing a company’s long-term sales performance reveals insights into its quality. Any business can put up a good quarter or two, but the best consistently grow over the long haul. Over the last five years, Oxford Industries grew its sales at a 14.6% compounded annual growth rate. Though this growth is acceptable on an absolute basis, we need to see more than just topline growth for the consumer discretionary sector, which can display significant earnings volatility. This means our bar for the sector is particularly high, reflecting the non-essential and hit-driven nature of the products and services offered. Additionally, five-year CAGR starts around Covid, when revenue was depressed then rebounded.
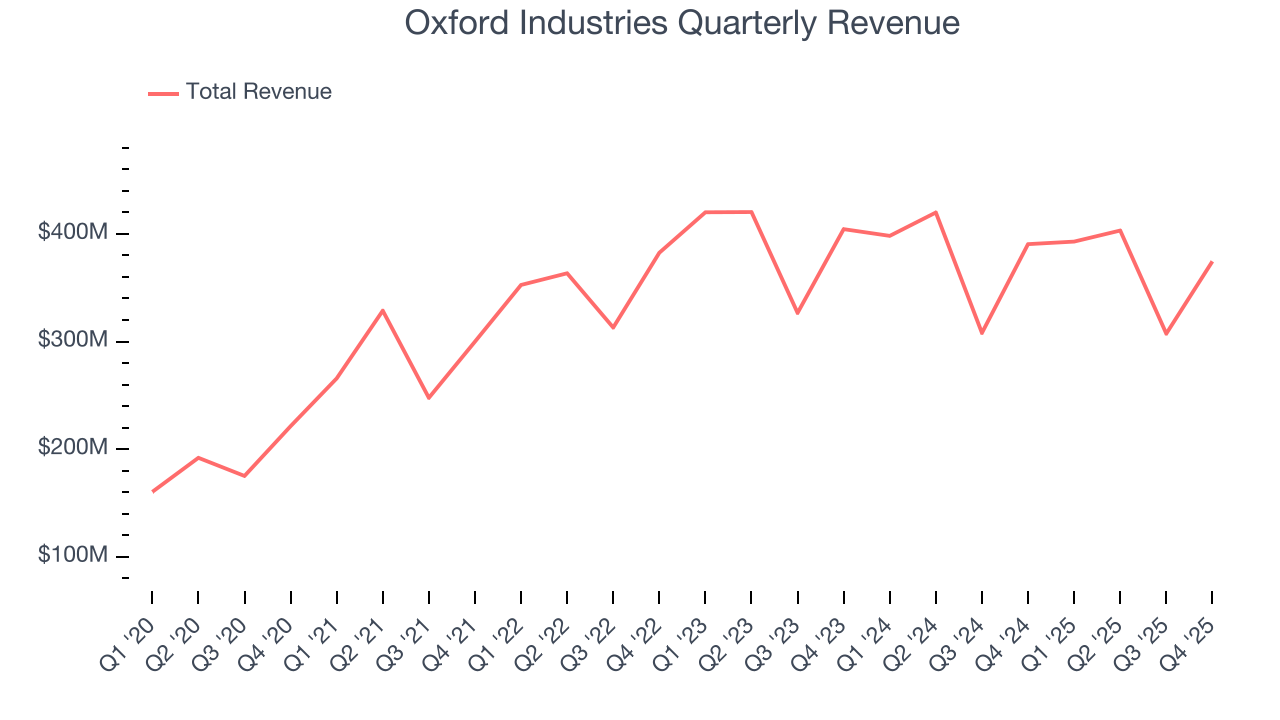
We at StockStory place the most emphasis on long-term growth, but within consumer discretionary, a stretched historical view may miss a company riding a successful new product or trend. Oxford Industries’s performance shows it grew in the past but relinquished its gains over the last two years, as its revenue fell by 3% annually. 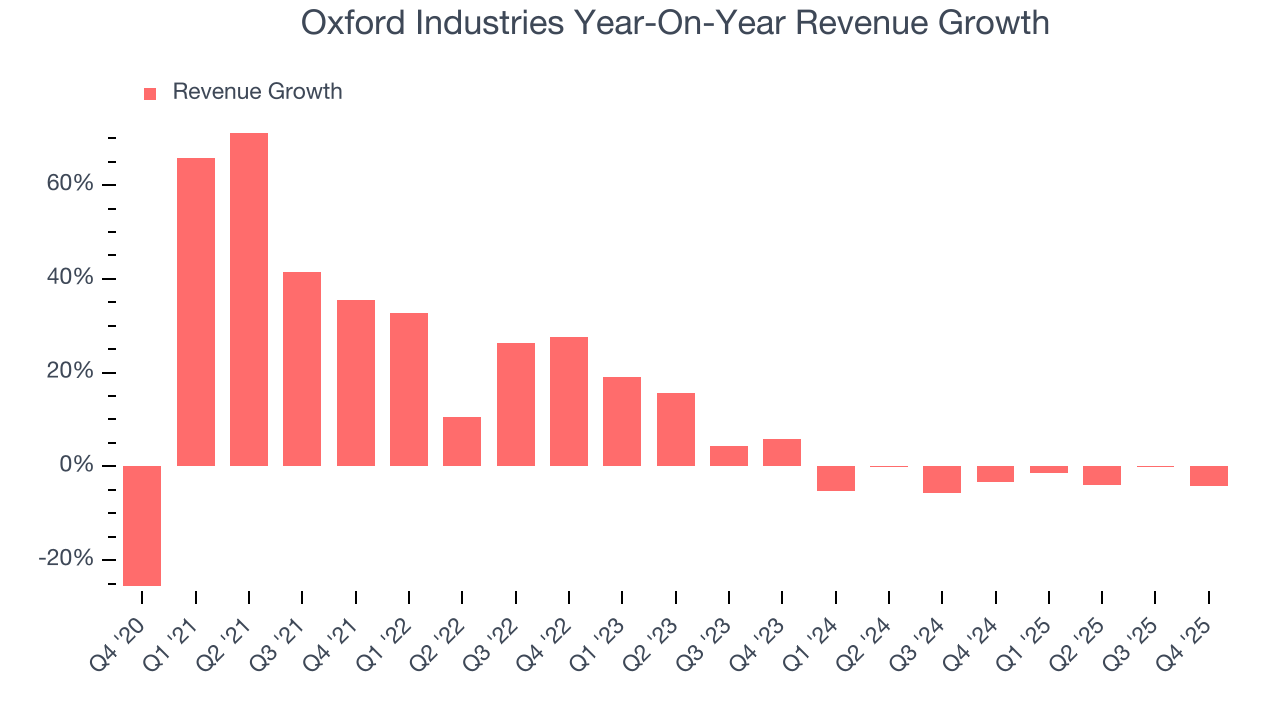
This quarter, Oxford Industries’s revenue fell by 4.1% year on year to $374.5 million but beat Wall Street’s estimates by 0.7%. Company management is currently guiding for flat sales next quarter.
Looking further ahead, sell-side analysts expect revenue to grow 1.5% over the next 12 months. Although this projection indicates its newer products and services will spur better top-line performance, it is still below average for the sector.
6. Operating Margin
Operating margin is a key measure of profitability. Think of it as net income - the bottom line - excluding the impact of taxes and interest on debt, which are less connected to business fundamentals.
Oxford Industries’s operating margin has been trending down over the last 12 months and averaged 2.9% over the last two years. The company’s profitability was mediocre for a consumer discretionary business and shows it couldn’t pass its higher operating expenses onto its customers.
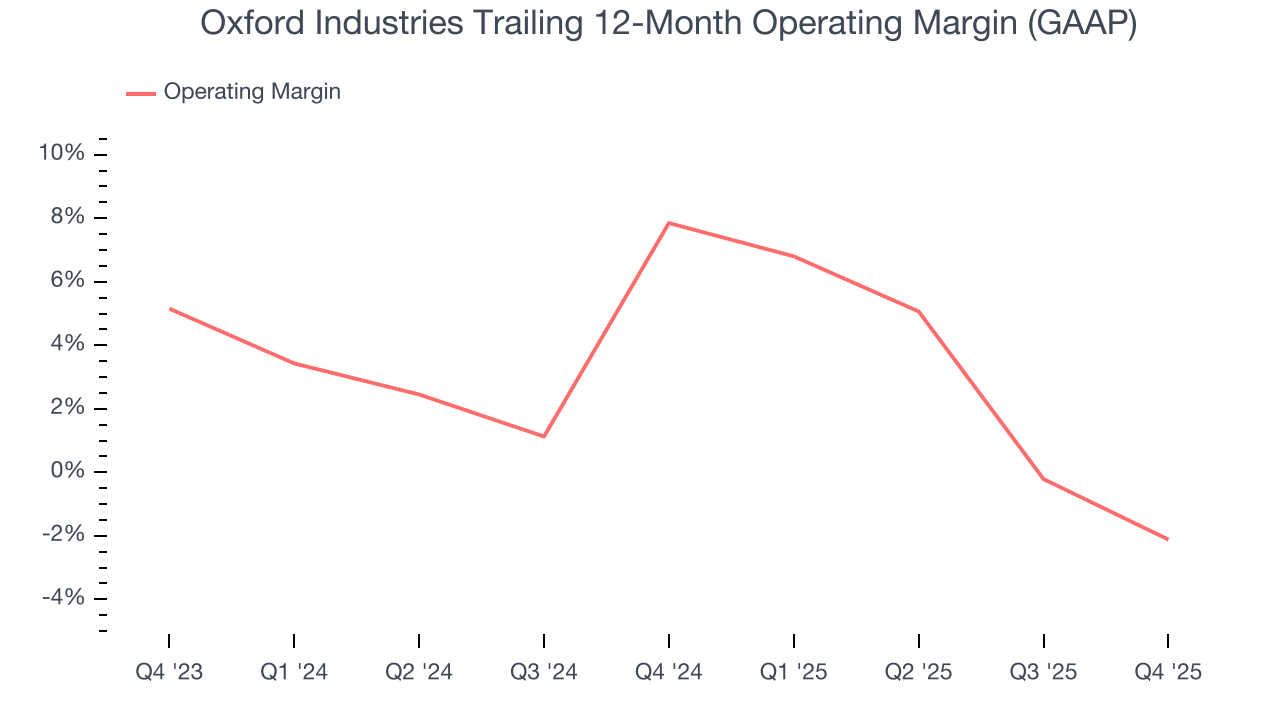
In Q4, Oxford Industries generated an operating margin profit margin of negative 2.1%, down 7.3 percentage points year on year. This contraction shows it was less efficient because its expenses increased relative to its revenue.
7. Earnings Per Share
We track the long-term change in earnings per share (EPS) for the same reason as long-term revenue growth. Compared to revenue, however, EPS highlights whether a company’s growth is profitable.
Oxford Industries’s full-year EPS flipped from negative to positive over the last five years. This is encouraging and shows it’s at a critical moment in its life.
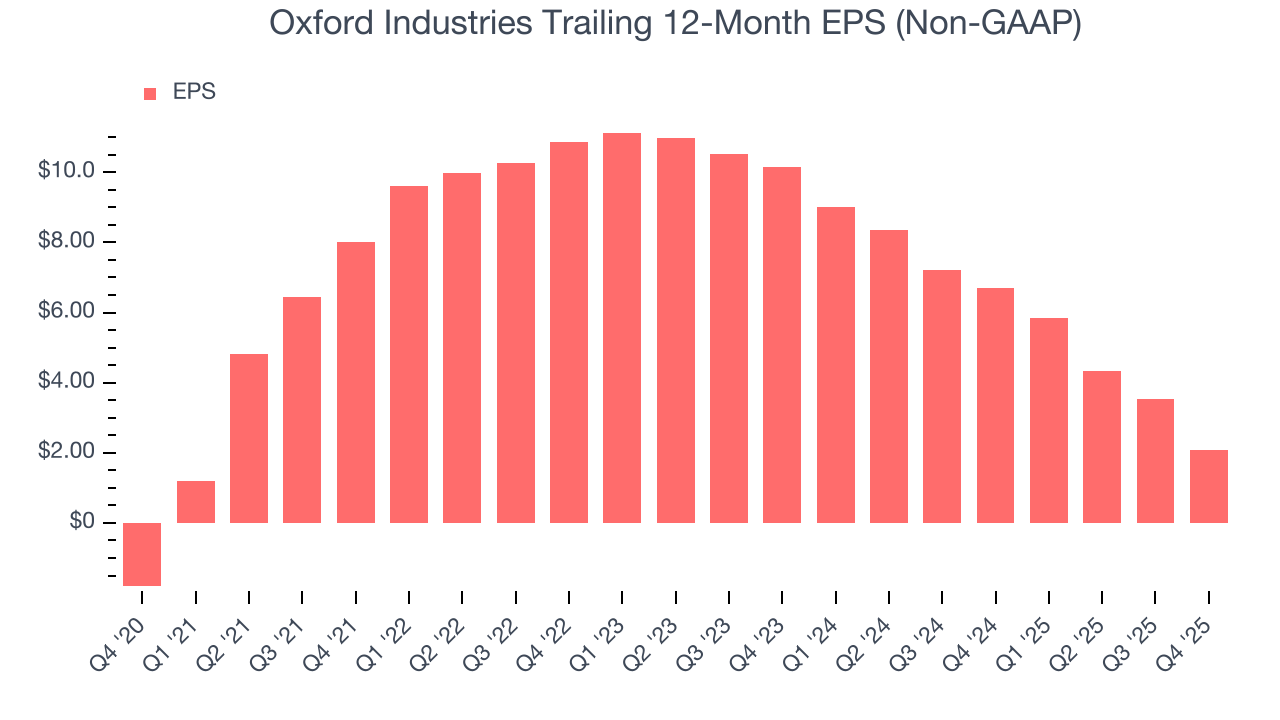
In Q4, Oxford Industries reported adjusted EPS of negative $0.09, down from $1.37 in the same quarter last year. This print missed analysts’ estimates. Over the next 12 months, Wall Street expects Oxford Industries’s full-year EPS of $2.07 to grow 41.3%.
8. Cash Is King
Although earnings are undoubtedly valuable for assessing company performance, we believe cash is king because you can’t use accounting profits to pay the bills.
Oxford Industries has shown poor cash profitability relative to peers over the last two years, giving the company fewer opportunities to return capital to shareholders. Its free cash flow margin averaged 2.4%, below what we’d expect for a consumer discretionary business.
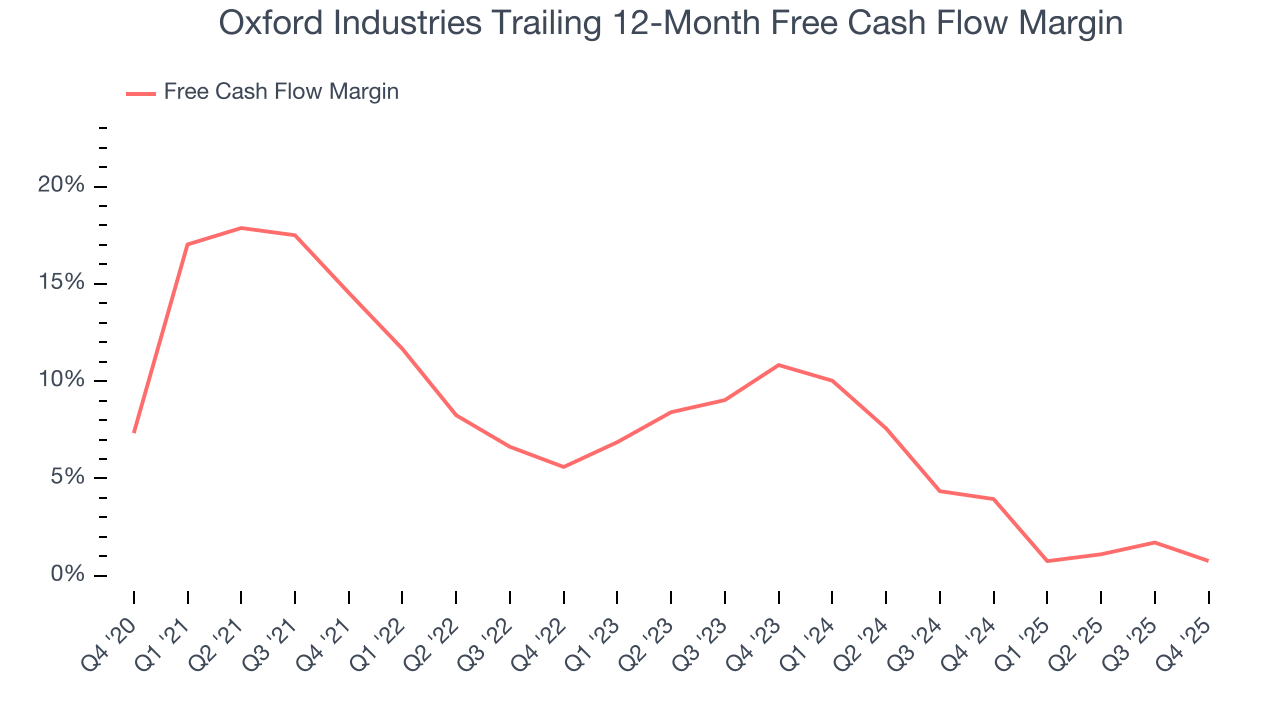
Oxford Industries’s free cash flow clocked in at $34.28 million in Q4, equivalent to a 9.2% margin. The company’s cash profitability regressed as it was 3.3 percentage points lower than in the same quarter last year, but it’s still above its two-year average. We wouldn’t put too much weight on this quarter’s decline because investment needs can be seasonal, causing short-term swings. Long-term trends carry greater meaning.
9. Return on Invested Capital (ROIC)
EPS and free cash flow tell us whether a company was profitable while growing its revenue. But was it capital-efficient? Enter ROIC, a metric showing how much operating profit a company generates relative to the money it has raised (debt and equity).
Oxford Industries historically did a mediocre job investing in profitable growth initiatives. Its five-year average ROIC was 14.6%, somewhat low compared to the best consumer discretionary companies that consistently pump out 25%+.
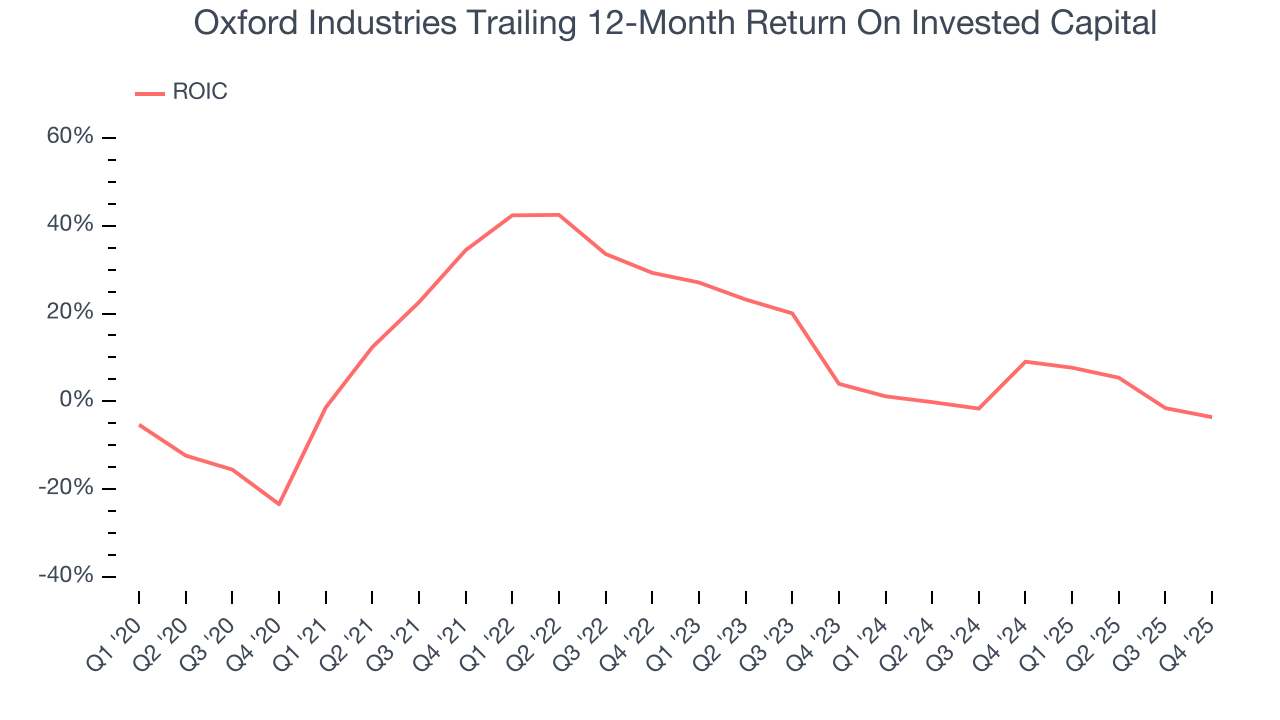
We like to invest in businesses with high returns, but the trend in a company’s ROIC is what often surprises the market and moves the stock price. Over the last few years, Oxford Industries’s ROIC has unfortunately decreased significantly. Paired with its already low returns, these declines suggest its profitable growth opportunities are few and far between.
10. Balance Sheet Risk
As long-term investors, the risk we care about most is the permanent loss of capital, which can happen when a company goes bankrupt or raises money from a disadvantaged position. This is separate from short-term stock price volatility, something we are much less bothered by.
Oxford Industries’s $563.4 million of debt exceeds the $8.13 million of cash on its balance sheet. Furthermore, its 5× net-debt-to-EBITDA ratio (based on its EBITDA of $105.8 million over the last 12 months) shows the company is overleveraged.
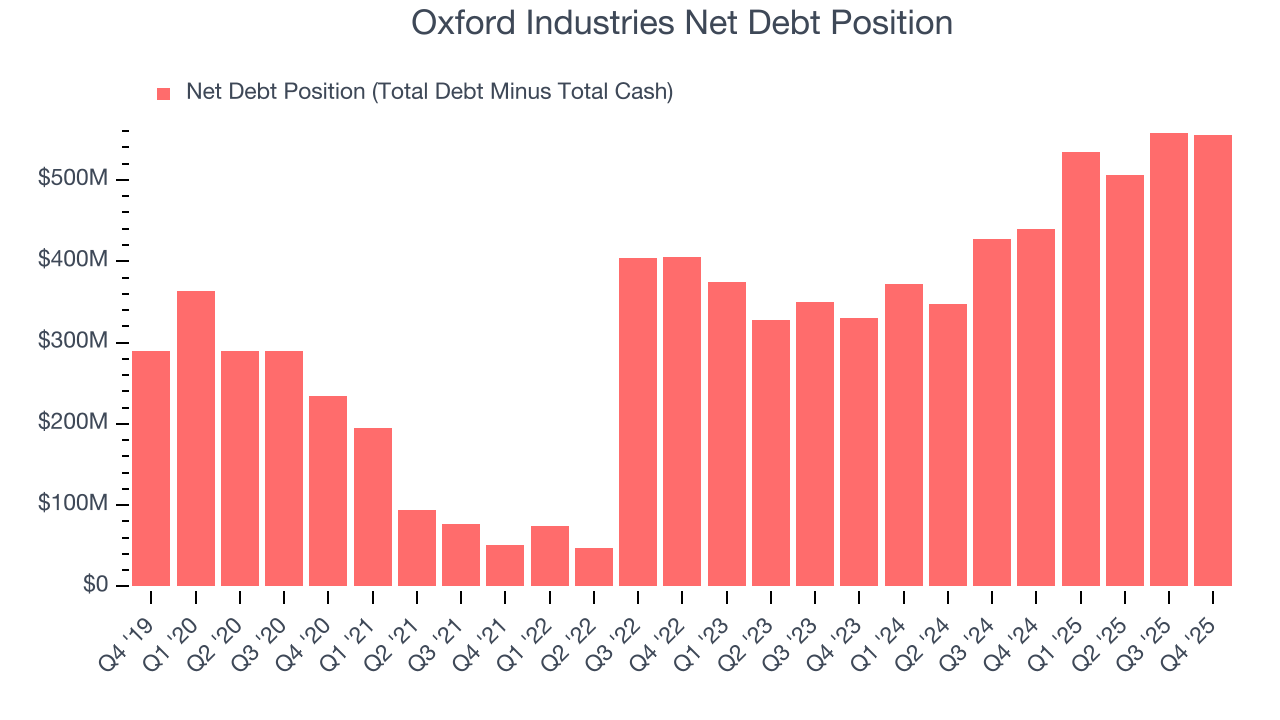
At this level of debt, incremental borrowing becomes increasingly expensive and credit agencies could downgrade the company’s rating if profitability falls. Oxford Industries could also be backed into a corner if the market turns unexpectedly – a situation we seek to avoid as investors in high-quality companies.
We hope Oxford Industries can improve its balance sheet and remain cautious until it increases its profitability or pays down its debt.
11. Key Takeaways from Oxford Industries’s Q4 Results
We struggled to find many positives in these results. Its EBITDA missed and its EPS fell short of Wall Street’s estimates. Overall, this was a weaker quarter. The stock traded down 2.6% to $31.05 immediately after reporting.
12. Is Now The Time To Buy Oxford Industries?
Updated: March 26, 2026 at 10:57 PM EDT
We think that the latest earnings result is only one piece of the bigger puzzle. If you’re deciding whether to own Oxford Industries, you should also grasp the company’s longer-term business quality and valuation.
We cheer for all companies serving everyday consumers, but in the case of Oxford Industries, we’ll be cheering from the sidelines. While its projected EPS for the next year implies the company’s fundamentals will improve, the downside is its relatively low ROIC suggests management has struggled to find compelling investment opportunities. On top of that, its low free cash flow margins give it little breathing room.
Oxford Industries’s P/E ratio based on the next 12 months is 11.3x. While this valuation is fair, the upside isn’t great compared to the potential downside. There are superior stocks to buy right now.
Wall Street analysts have a consensus one-year price target of $36.50 on the company (compared to the current share price of $31.92).