
Proto Labs (PRLB)
Proto Labs keeps us up at night. Its sales have underperformed and its low returns on capital show it has few growth opportunities.― StockStory Analyst Team
1. News


2. Summary
Why We Think Proto Labs Will Underperform
Pioneering the concept of online quoting and manufacturing for custom prototypes and low-volume production parts, Proto Labs (NYSE:PRLB) offers injection molding, 3D printing, and sheet metal fabrication for manufacturers in various industries.
- Earnings per share have contracted by 7% annually over the last five years, a headwind for returns as stock prices often echo long-term EPS performance
- Below-average returns on capital indicate management struggled to find compelling investment opportunities
- Poor expense management has led to an operating margin that is below the industry average


Proto Labs doesn’t satisfy our quality benchmarks. There are better opportunities in the market.
Why There Are Better Opportunities Than Proto Labs


Proto Labs’s stock price of $56.80 implies a valuation ratio of 31.3x forward P/E. Not only is Proto Labs’s multiple richer than most industrials peers, but it’s also expensive for its revenue characteristics.
We’d rather invest in similarly-priced but higher-quality companies with more reliable earnings growth.
3. Proto Labs (PRLB) Research Report: Q4 CY2025 Update
Manufacturing services provider Proto Labs (NYSE:PRLB) reported Q4 CY2025 results beating Wall Street’s revenue expectations, with sales up 12.1% year on year to $136.5 million. Guidance for next quarter’s revenue was better than expected at $134 million at the midpoint, 1.8% above analysts’ estimates. Its non-GAAP profit of $0.44 per share was 27.9% above analysts’ consensus estimates.
Proto Labs (PRLB) Q4 CY2025 Highlights:
- Revenue: $136.5 million vs analyst estimates of $129.5 million (12.1% year-on-year growth, 5.4% beat)
- Adjusted EPS: $0.44 vs analyst estimates of $0.34 (27.9% beat)
- Adjusted EBITDA: $19.94 million vs analyst estimates of $16.99 million (14.6% margin, 17.4% beat)
- Revenue Guidance for Q1 CY2026 is $134 million at the midpoint, above analyst estimates of $131.7 million
- Adjusted EPS guidance for Q1 CY2026 is $0.40 at the midpoint, above analyst estimates of $0.35
- Operating Margin: 5%, up from -1.2% in the same quarter last year
- Free Cash Flow Margin: 6.2%, down from 13.5% in the same quarter last year
- Market Capitalization: $1.24 billion
Company Overview
Pioneering the concept of online quoting and manufacturing for custom prototypes and low-volume production parts, Proto Labs (NYSE:PRLB) offers injection molding, 3D printing, and sheet metal fabrication for manufacturers in various industries.
The company was originally founded as Protomold in 1999 but rebranded to Proto Labs in 2009 after launching a computer numerical control (CNC) machining service, or software that dictates the movement of factory tools and machinery. Under the new company name, it expanded its capabilities to include injection molding, 3D printing, and sheet metal fabrication.
Today, Proto Labs’s product offerings cater to manufacturing services in the automotive, aerospace, healthcare, consumer, and industrial sectors. The company provides rapid prototyping, on-demand production, and custom parts manufacturing. Its services help customers bring new products to market faster by offering quick-turn production of prototypes and low-volume production parts. Proto Labs also offers design feedback to help customers optimize parts for manufacturability, ultimately reducing costs and improving product quality.
The company allows customers to upload designs, receive quotes, and place orders on its digital platform. In terms of revenue generation, it engages in contracts including pricing agreements, volume commitments, and partnerships. Pricing can vary depending on order volumes and frequency, an approach instated to incentivize longer commitments and larger orders.
4. Custom Parts Manufacturing
Onshoring and inventory management–themes that grew in focus after COVID wreaked havoc on global supply chains–are tailwinds for companies that combine economies of scale with reliable service. Many in the space have adopted 3D printing to efficiently address the need for bespoke parts and components, but all companies are still at the whim of economic cycles. For example, consumer spending and interest rates can greatly impact the industrial production that drives demand for these companies’ offerings.
Competitors offering similar products include Cimpress (NASDAQ:CMPR), Stratasys (NASDAQ:SSYS), and Xometry (NASDAQ:XMTR).
5. Revenue Growth
A company’s long-term performance is an indicator of its overall quality. Any business can put up a good quarter or two, but many enduring ones grow for years. Over the last five years, Proto Labs grew its sales at a sluggish 4.2% compounded annual growth rate. This fell short of our benchmark for the industrials sector and is a rough starting point for our analysis.
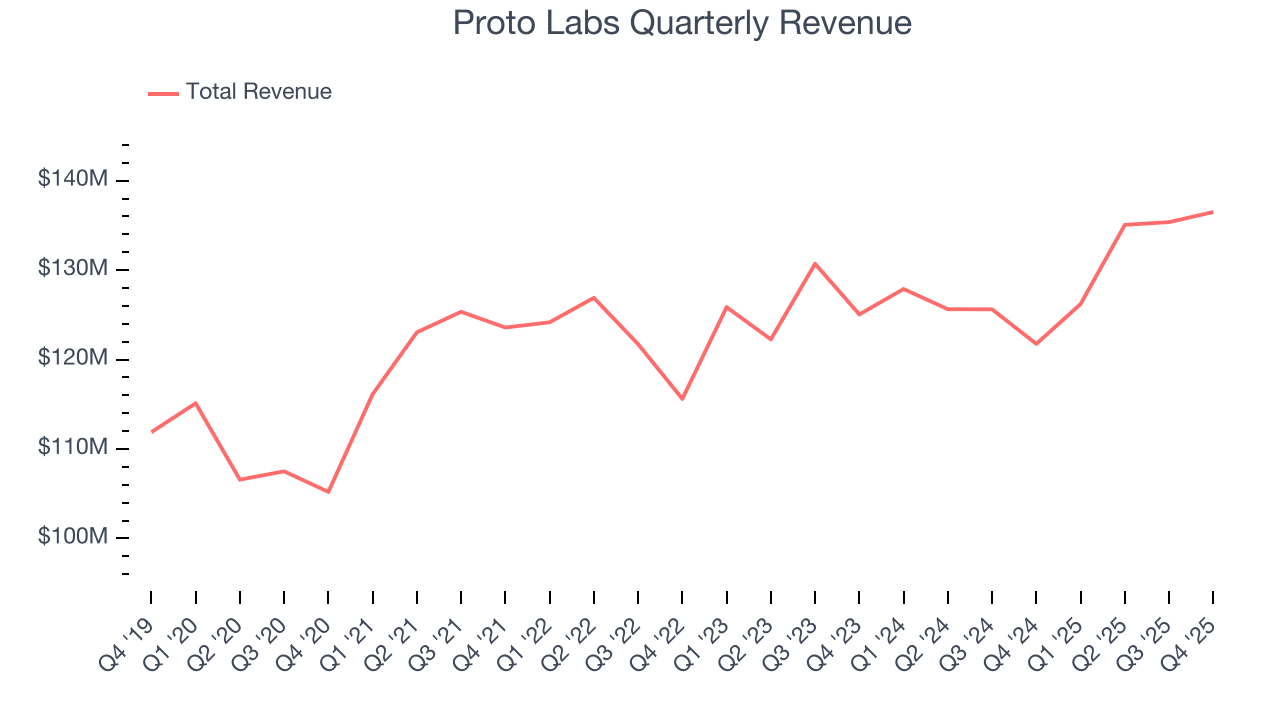
Long-term growth is the most important, but within industrials, a half-decade historical view may miss new industry trends or demand cycles. Proto Labs’s recent performance shows its demand has slowed as its annualized revenue growth of 2.9% over the last two years was below its five-year trend. 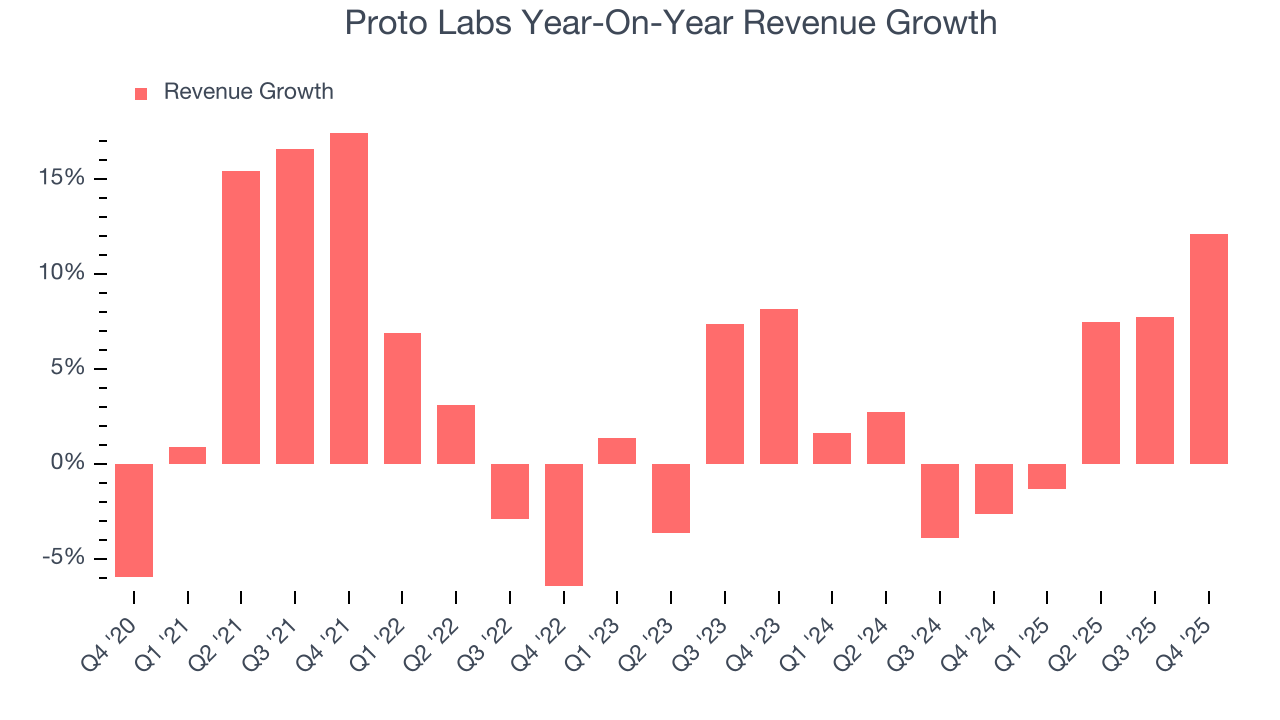
We can dig further into the company’s revenue dynamics by analyzing its three most important segments: Injection Molding , CNC Machining , and 3D Printing, which are 34.9%, 48%, and 13.8% of revenue. Over the last two years, Proto Labs’s CNC Machining revenue (custom CNC-machined parts) averaged 11% year-on-year growth while its Injection Molding (injection molds and parts) and 3D Printing (custom 3D-printed parts) revenues averaged 2.9% and 2.4% declines. 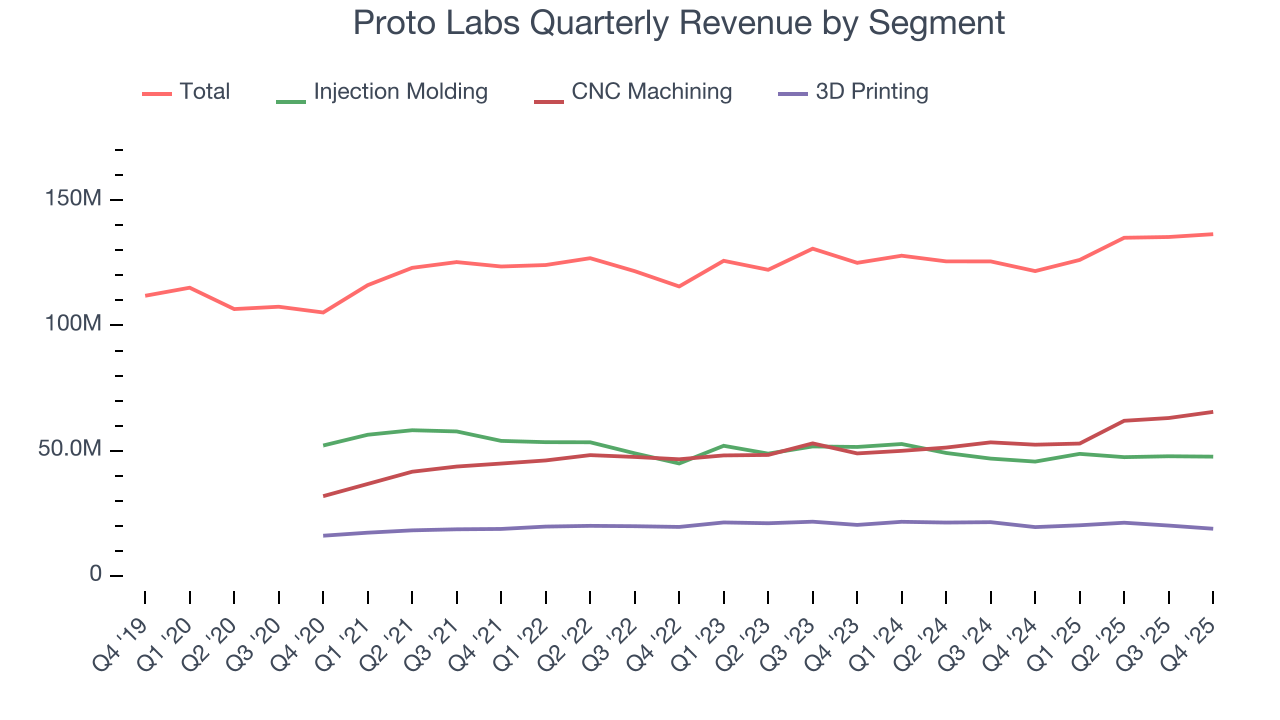
This quarter, Proto Labs reported year-on-year revenue growth of 12.1%, and its $136.5 million of revenue exceeded Wall Street’s estimates by 5.4%. Company management is currently guiding for a 6.2% year-on-year increase in sales next quarter.
Looking further ahead, sell-side analysts expect revenue to grow 3.2% over the next 12 months, similar to its two-year rate. This projection is underwhelming and suggests its newer products and services will not catalyze better top-line performance yet.
6. Gross Margin & Pricing Power
Proto Labs has best-in-class unit economics for an industrials company, enabling it to invest in areas such as research and development. Its margin also signals it sells differentiated products, not commodities. As you can see below, it averaged an elite 44.6% gross margin over the last five years. That means Proto Labs only paid its suppliers $55.44 for every $100 in revenue. 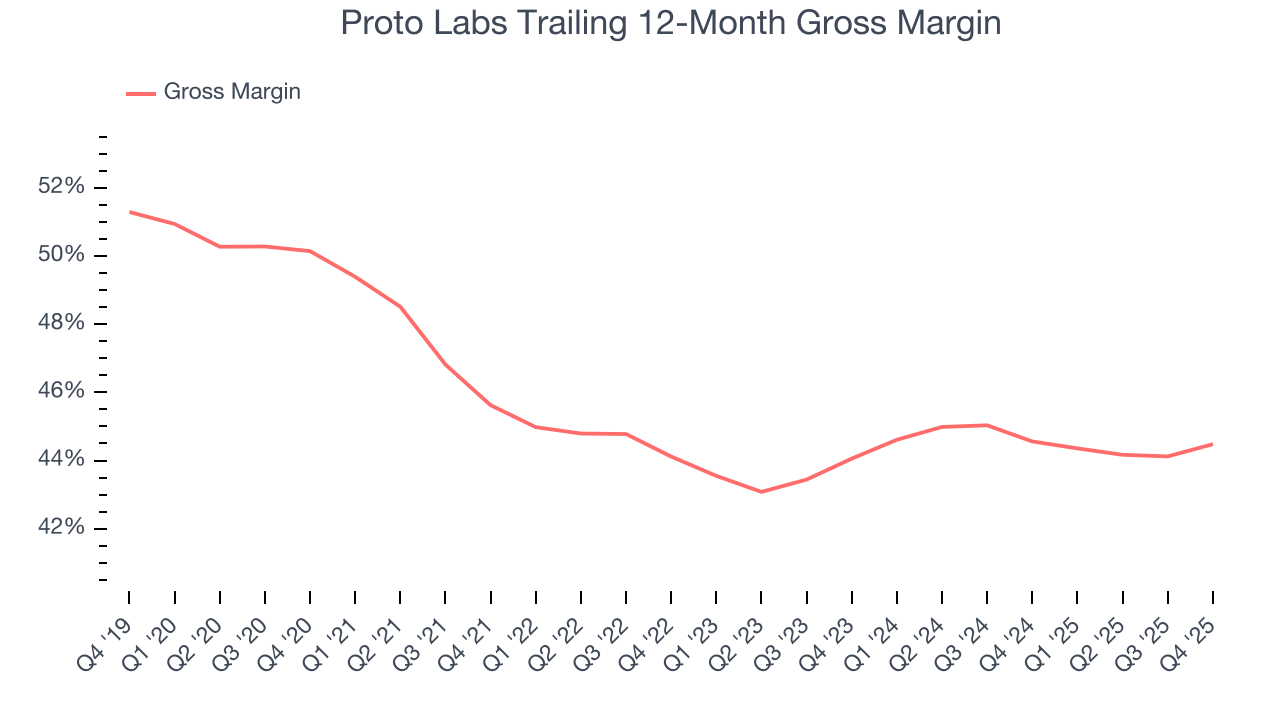
Proto Labs’s gross profit margin came in at 44.2% this quarter, marking a 1.6 percentage point increase from 42.7% in the same quarter last year. On a wider time horizon, the company’s full-year margin has remained steady over the past four quarters, suggesting its input costs (such as raw materials and manufacturing expenses) have been stable and it isn’t under pressure to lower prices.
7. Operating Margin
Proto Labs was roughly breakeven when averaging the last five years of quarterly operating profits, inadequate for an industrials business. This result is surprising given its high gross margin as a starting point.
Looking at the trend in its profitability, Proto Labs’s operating margin decreased by 3.6 percentage points over the last five years. This raises questions about the company’s expense base because its revenue growth should have given it leverage on its fixed costs, resulting in better economies of scale and profitability. Proto Labs’s performance was poor no matter how you look at it - it shows that costs were rising and it couldn’t pass them onto its customers.
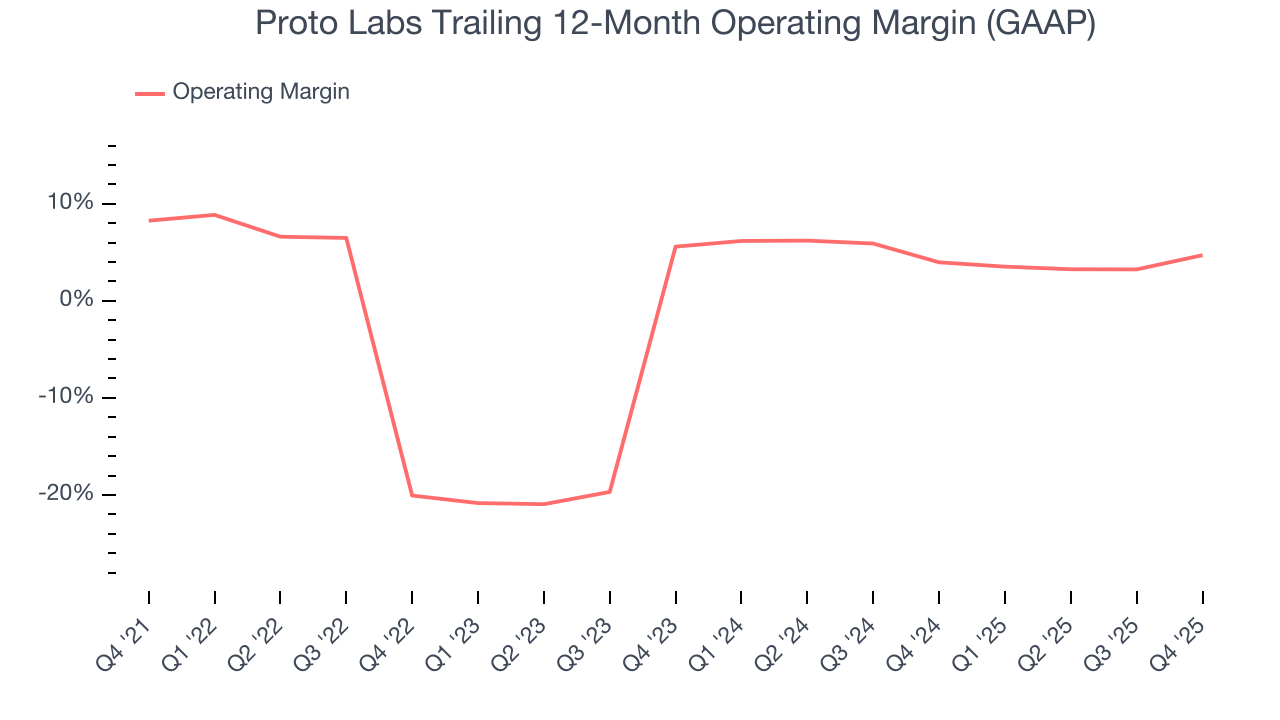
This quarter, Proto Labs generated an operating margin profit margin of 5%, up 6.2 percentage points year on year. The increase was solid, and because its operating margin rose more than its gross margin, we can infer it was more efficient with expenses such as marketing, R&D, and administrative overhead.
8. Earnings Per Share
We track the long-term change in earnings per share (EPS) for the same reason as long-term revenue growth. Compared to revenue, however, EPS highlights whether a company’s growth is profitable.
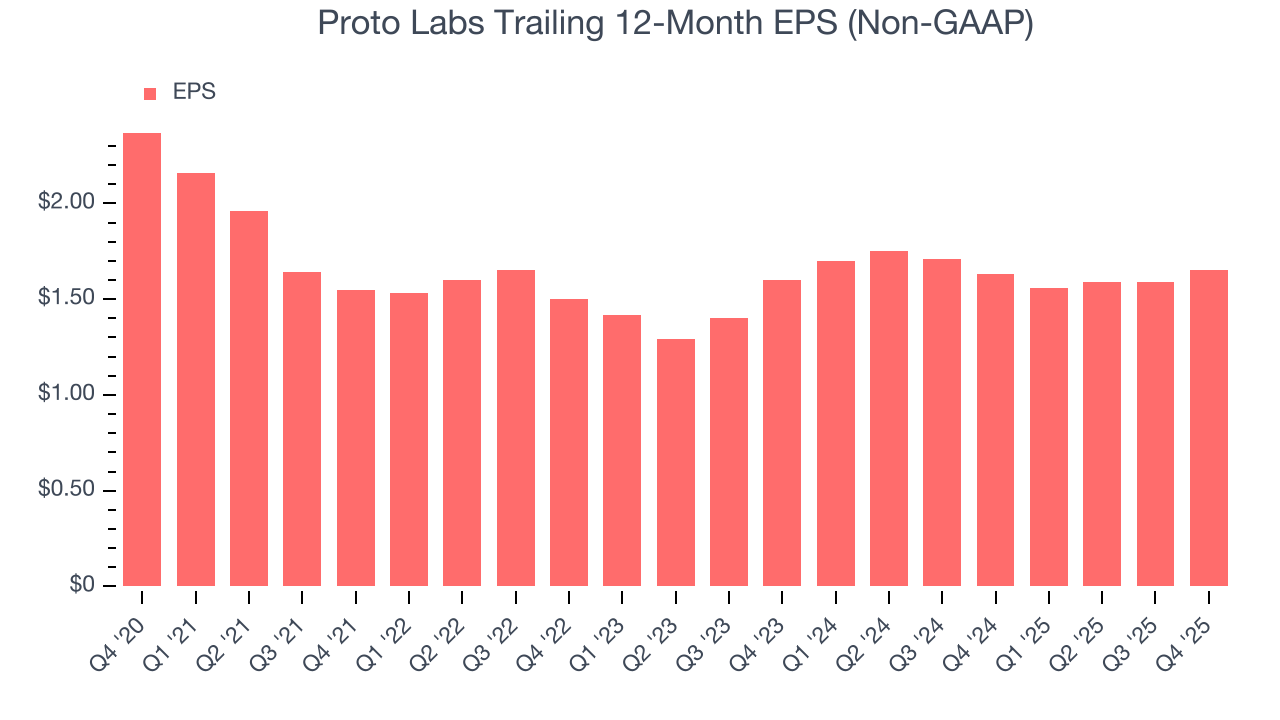
Sadly for Proto Labs, its EPS declined by 7% annually over the last five years while its revenue grew by 4.2%. This tells us the company became less profitable on a per-share basis as it expanded due to non-fundamental factors such as interest expenses and taxes.
Diving into the nuances of Proto Labs’s earnings can give us a better understanding of its performance. As we mentioned earlier, Proto Labs’s operating margin expanded this quarter but declined by 3.6 percentage points over the last five years. This was the most relevant factor (aside from the revenue impact) behind its lower earnings; interest expenses and taxes can also affect EPS but don’t tell us as much about a company’s fundamentals.
Like with revenue, we analyze EPS over a shorter period to see if we are missing a change in the business.
For Proto Labs, its two-year annual EPS growth of 1.6% was higher than its five-year trend. Accelerating earnings growth is almost always an encouraging data point.
In Q4, Proto Labs reported adjusted EPS of $0.44, up from $0.38 in the same quarter last year. This print easily cleared analysts’ estimates, and shareholders should be content with the results. Over the next 12 months, Wall Street expects Proto Labs’s full-year EPS of $1.65 to stay about the same.
9. Cash Is King
Free cash flow isn't a prominently featured metric in company financials and earnings releases, but we think it's telling because it accounts for all operating and capital expenses, making it tough to manipulate. Cash is king.
Proto Labs has shown impressive cash profitability, enabling it to ride out cyclical downturns more easily while maintaining its investments in new and existing offerings. The company’s free cash flow margin averaged 9.3% over the last five years, better than the broader industrials sector. The divergence from its underwhelming operating margin stems from the add-back of non-cash charges like depreciation and stock-based compensation. GAAP operating profit expenses these line items, but free cash flow does not.
Taking a step back, we can see that Proto Labs’s margin expanded by 6.9 percentage points during that time. This is encouraging, and we can see it became a less capital-intensive business because its free cash flow profitability rose while its operating profitability fell.
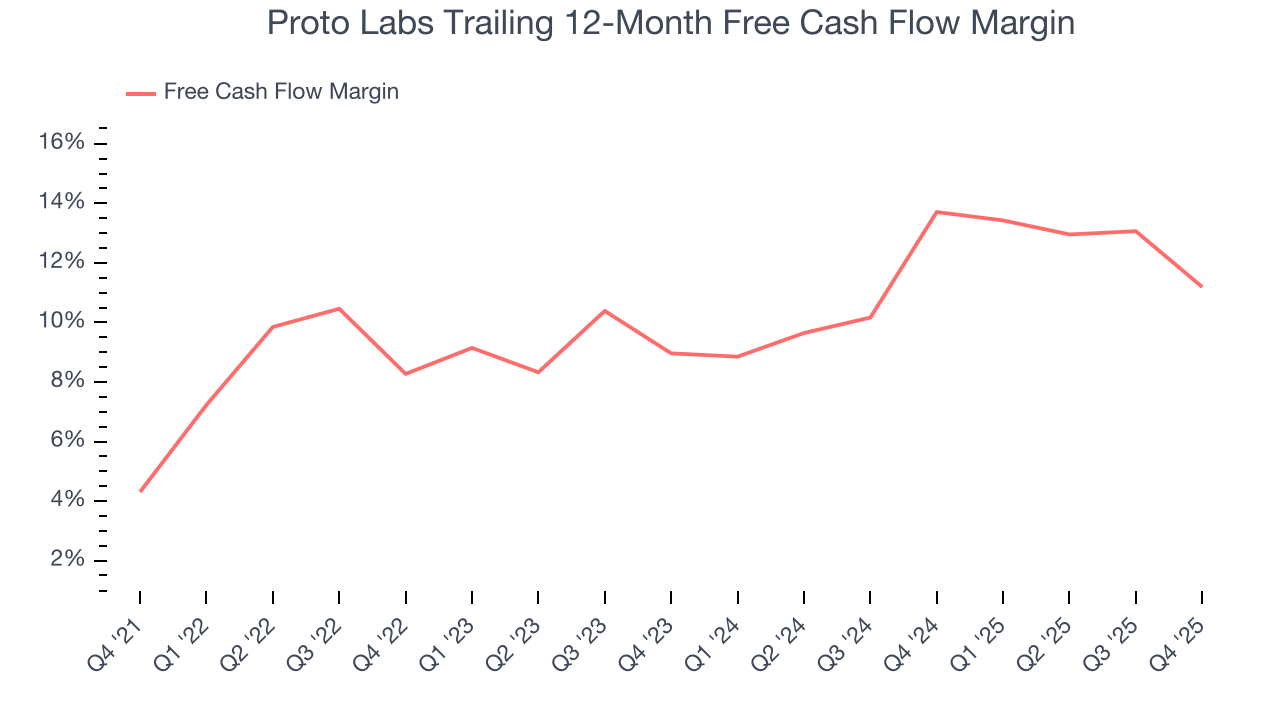
Proto Labs’s free cash flow clocked in at $8.4 million in Q4, equivalent to a 6.2% margin. The company’s cash profitability regressed as it was 7.4 percentage points lower than in the same quarter last year, prompting us to pay closer attention. Short-term fluctuations typically aren’t a big deal because investment needs can be seasonal, but we’ll be watching to see if the trend extrapolates into future quarters.
10. Return on Invested Capital (ROIC)
EPS and free cash flow tell us whether a company was profitable while growing its revenue. But was it capital-efficient? Enter ROIC, a metric showing how much operating profit a company generates relative to the money it has raised (debt and equity).
Proto Labs’s five-year average ROIC was negative 0.9%, meaning management lost money while trying to expand the business. Its returns were among the worst in the industrials sector.
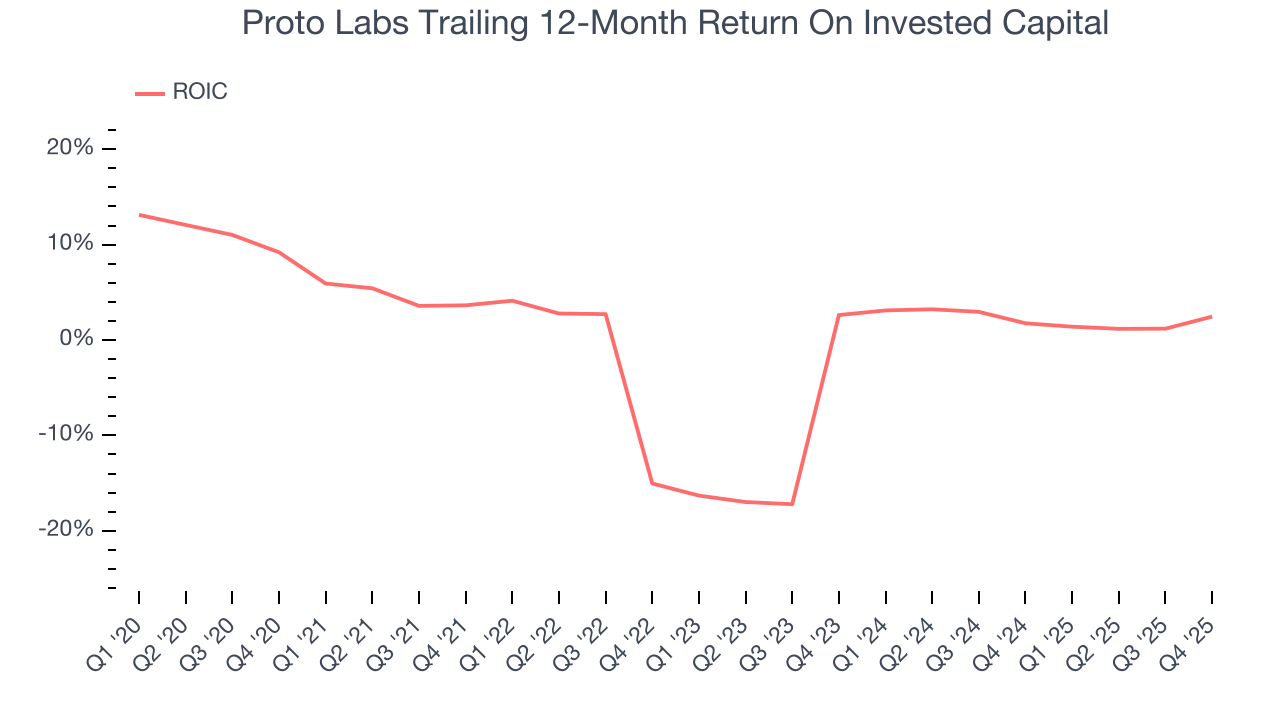
We like to invest in businesses with high returns, but the trend in a company’s ROIC is what often surprises the market and moves the stock price. Over the last few years, Proto Labs’s ROIC has increased. This is a good sign, and we hope the company can continue improving.
11. Balance Sheet Assessment
Businesses that maintain a cash surplus face reduced bankruptcy risk.
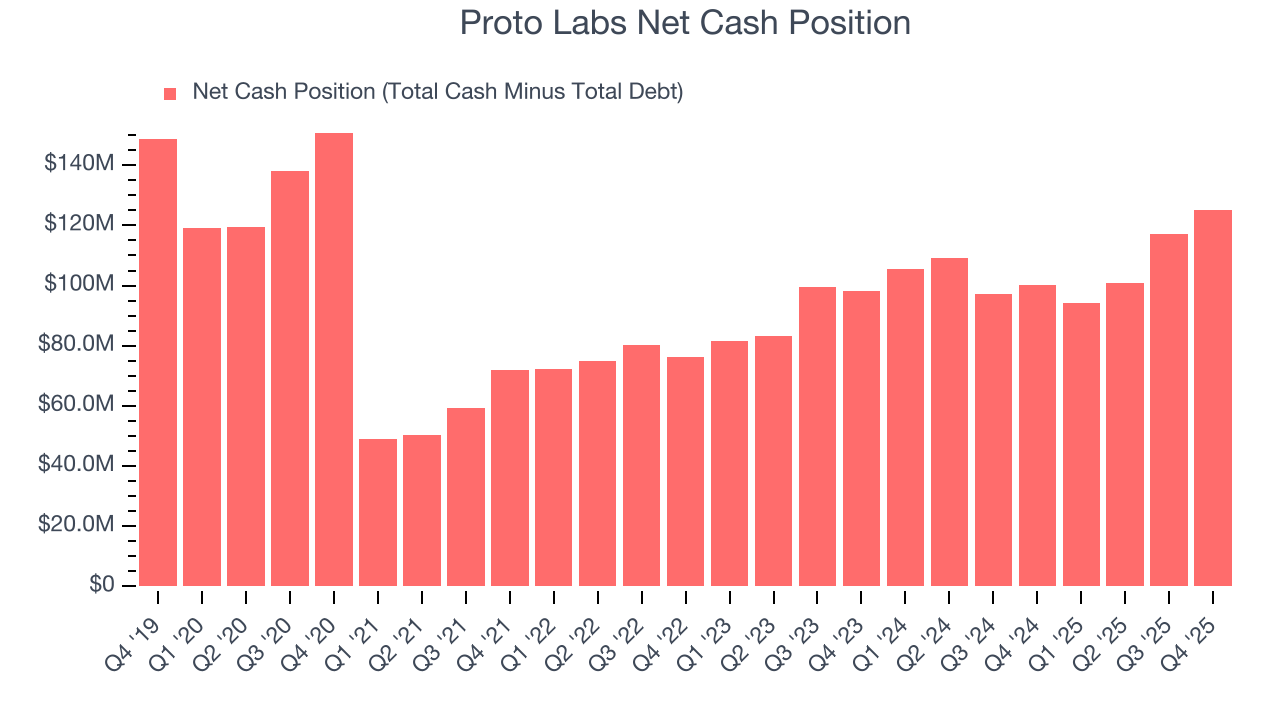
Proto Labs is a profitable, well-capitalized company with $128.1 million of cash and $3.05 million of debt on its balance sheet. This $125.1 million net cash position is 10.1% of its market cap and gives it the freedom to borrow money, return capital to shareholders, or invest in growth initiatives. Leverage is not an issue here.
12. Key Takeaways from Proto Labs’s Q4 Results
We were impressed by Proto Labs’s optimistic revenue and EPS guidance for next quarter, which exceeded analysts’ expectations. We were also glad its revenue and EPS in the quarter outperformed Wall Street’s estimates. Zooming out, we think this was a good print with some key areas of upside. The stock traded up 14.7% to $60.21 immediately after reporting.
13. Is Now The Time To Buy Proto Labs?
Updated: March 19, 2026 at 11:45 PM EDT
A common mistake we notice when investors are deciding whether to buy a stock or not is that they simply look at the latest earnings results. Business quality and valuation matter more, so we urge you to understand these dynamics as well.
Proto Labs falls short of our quality standards. For starters, its revenue growth was uninspiring over the last five years. While its rising cash profitability gives it more optionality, the downside is its relatively low ROIC suggests management has struggled to find compelling investment opportunities. On top of that, its declining EPS over the last five years makes it a less attractive asset to the public markets.
Proto Labs’s P/E ratio based on the next 12 months is 31.3x. This valuation tells us it’s a bit of a market darling with a lot of good news priced in - we think there are better stocks to buy right now.
Wall Street analysts have a consensus one-year price target of $71.67 on the company (compared to the current share price of $56.80).
Although the price target is bullish, readers should exercise caution because analysts tend to be overly optimistic. The firms they work for, often big banks, have relationships with companies that extend into fundraising, M&A advisory, and other rewarding business lines. As a result, they typically hesitate to say bad things for fear they will lose out. We at StockStory do not suffer from such conflicts of interest, so we’ll always tell it like it is.