
LiveRamp (RAMP)
We’re cautious of LiveRamp. Its weak revenue growth and gross margin show it not only lacks demand but also decent unit economics.― StockStory Analyst Team
1. News


2. Summary
Why We Think LiveRamp Will Underperform
Serving as the digital middleman in an increasingly privacy-conscious world, LiveRamp (NYSE:RAMP) provides technology that helps companies securely share and connect their customer data with trusted partners while maintaining privacy compliance.
- Customers were hesitant to make long-term commitments to its software as its 6.8% average ARR growth over the last year was sluggish
- Estimated sales growth of 9.1% for the next 12 months implies demand will slow from its two-year trend
- On the bright side, its fast payback periods on sales and marketing expenses allow the company to invest heavily and onboard many customers concurrently


LiveRamp doesn’t live up to our standards. You should search for better opportunities.
Why There Are Better Opportunities Than LiveRamp


LiveRamp’s stock price of $25.73 implies a valuation ratio of 1.9x forward price-to-sales. LiveRamp’s valuation may seem like a great deal, but we think there are valid reasons why it’s so cheap.
Cheap stocks can look like great bargains at first glance, but you often get what you pay for. These mediocre businesses often have less earnings power, meaning there is more reliance on a re-rating to generate good returns - an unlikely scenario for low-quality companies.
3. LiveRamp (RAMP) Research Report: Q4 CY2025 Update
Data collaboration platform LiveRamp (NYSE:RAMP) met Wall Street’s revenue expectations in Q4 CY2025, with sales up 8.6% year on year to $212.2 million. On the other hand, next quarter’s revenue guidance of $205 million was less impressive, coming in 0.9% below analysts’ estimates. Its non-GAAP profit of $0.76 per share was 12.8% above analysts’ consensus estimates.
LiveRamp (RAMP) Q4 CY2025 Highlights:
- Revenue: $212.2 million vs analyst estimates of $212 million (8.6% year-on-year growth, in line)
- Adjusted EPS: $0.76 vs analyst estimates of $0.67 (12.8% beat)
- Adjusted Operating Income: $62 million vs analyst estimates of $55.9 million (29.2% margin, 10.9% beat)
- Revenue Guidance for Q1 CY2026 is $205 million at the midpoint, below analyst estimates of $206.9 million
- Operating Margin: 18.6%, up from 7.5% in the same quarter last year
- Free Cash Flow Margin: 31.6%, up from 28.5% in the previous quarter
- Customers: 140 customers paying more than $1 million annually
- Net Revenue Retention Rate: 103%, down from 105% in the previous quarter
- Annual Recurring Revenue: $527 million vs analyst estimates of $529.9 million (7.3% year-on-year growth, miss)
- Market Capitalization: $1.45 billion
Company Overview
Serving as the digital middleman in an increasingly privacy-conscious world, LiveRamp (NYSE:RAMP) provides technology that helps companies securely share and connect their customer data with trusted partners while maintaining privacy compliance.
At its core, LiveRamp operates as middleware for the customer experience economy, sitting between a company's data and the applications that use it. The platform offers four main capabilities: identity resolution (connecting fragmented consumer identities across systems), data marketplace access (providing third-party data from over 200 providers), connectivity (enabling data to flow across different platforms), and insights (facilitating collaborative analytics between partners).
LiveRamp's technology replaces directly identifiable customer information with pseudonymized "RampIDs" that allow companies to match and activate their data across digital ecosystems without compromising consumer privacy. For example, a retailer might use LiveRamp to securely match its loyalty program data with a consumer packaged goods company's promotional data to create more personalized marketing campaigns.
The company generates revenue primarily through subscription fees from its enterprise customers, which include approximately 25% of Fortune 500 companies. Additional revenue comes from its Data Marketplace, where LiveRamp takes a cut of transactions between data sellers and buyers, and from professional services. The company maintains a global presence with operations in the United States, Europe, and Asia-Pacific regions, serving industries ranging from financial services and retail to healthcare and telecommunications.
4. Advertising Software
The digital advertising market is large, growing, and becoming more diverse, both in terms of audiences and media. As a result, there is a growing need for software that enables advertisers to use data to automate and optimize ad placements.
LiveRamp's competitors include other customer data platforms and identity resolution providers such as Snowflake (NYSE:SNOW), Salesforce (NYSE:CRM), Adobe (NASDAQ:ADBE), and The Trade Desk (NASDAQ:TTD), as well as private companies like Neustar and Zeotap.
5. Revenue Growth
A company’s long-term performance is an indicator of its overall quality. Any business can have short-term success, but a top-tier one grows for years. Over the last five years, LiveRamp grew its sales at a 13.1% annual rate. Although this growth is acceptable on an absolute basis, it fell short of our standards for the software sector, which enjoys a number of secular tailwinds.
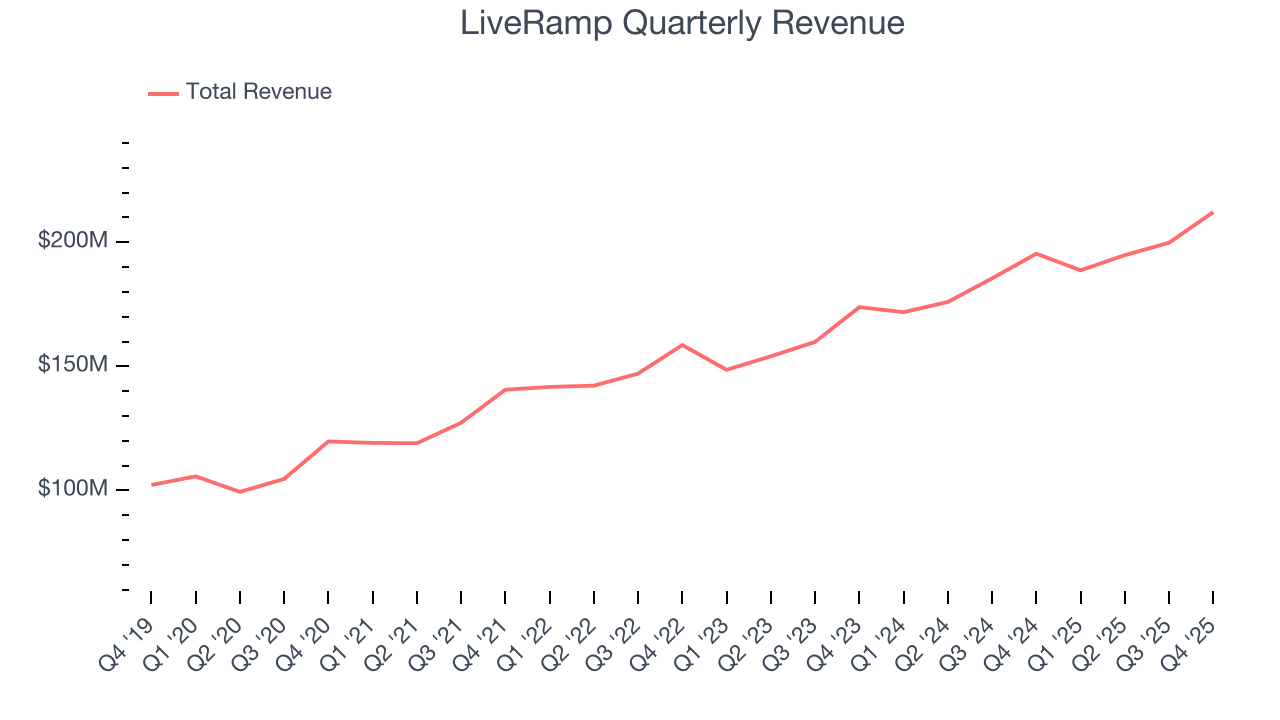
Long-term growth is the most important, but within software, a half-decade historical view may miss new innovations or demand cycles. LiveRamp’s recent performance shows its demand has slowed as its annualized revenue growth of 11.8% over the last two years was below its five-year trend. 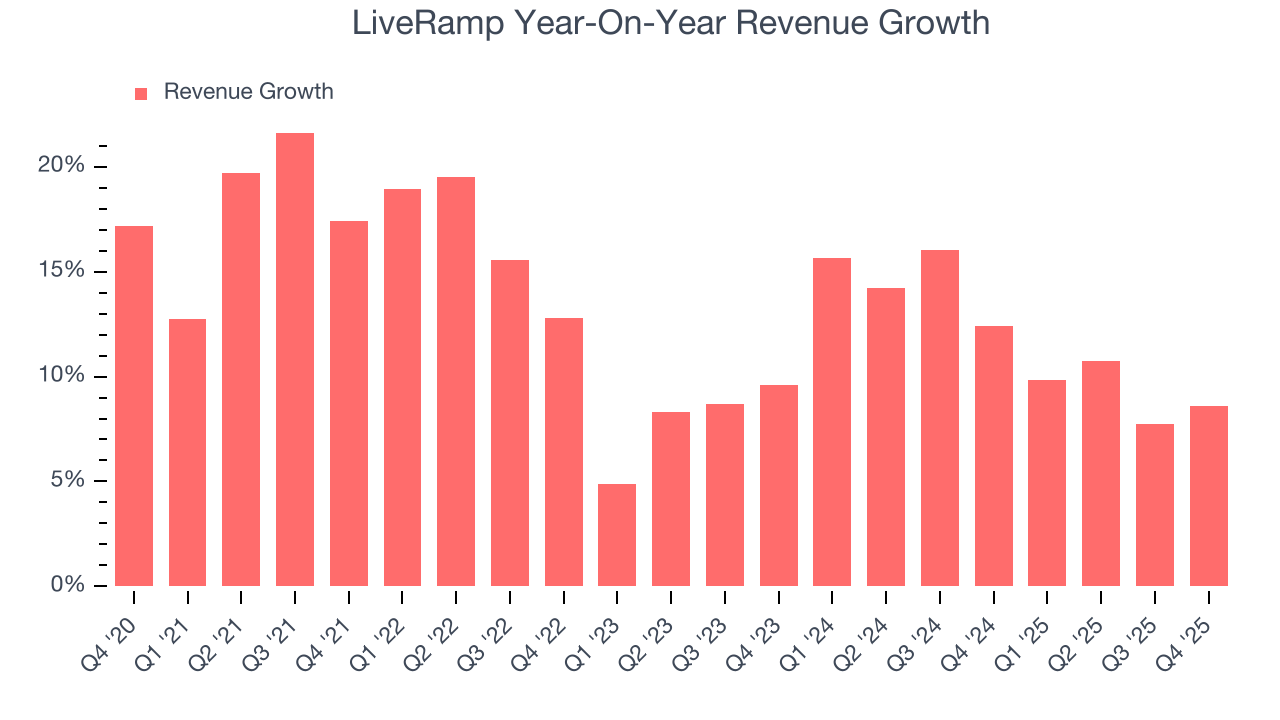
This quarter, LiveRamp grew its revenue by 8.6% year on year, and its $212.2 million of revenue was in line with Wall Street’s estimates. Company management is currently guiding for a 8.6% year-on-year increase in sales next quarter.
Looking further ahead, sell-side analysts expect revenue to grow 8.7% over the next 12 months, a deceleration versus the last two years. This projection doesn't excite us and suggests its products and services will see some demand headwinds.
6. Annual Recurring Revenue
While reported revenue for a software company can include low-margin items like implementation fees, annual recurring revenue (ARR) is a sum of the next 12 months of contracted revenue purely from software subscriptions, or the high-margin, predictable revenue streams that make SaaS businesses so valuable.
LiveRamp’s ARR came in at $527 million in Q4, and over the last four quarters, its growth was underwhelming as it averaged 6.8% year-on-year increases. This alternate topline metric grew slower than total sales, which likely means that the recurring portions of the business are growing slower than less predictable, choppier ones such as implementation fees. If this continues, the quality of its revenue base could decline. 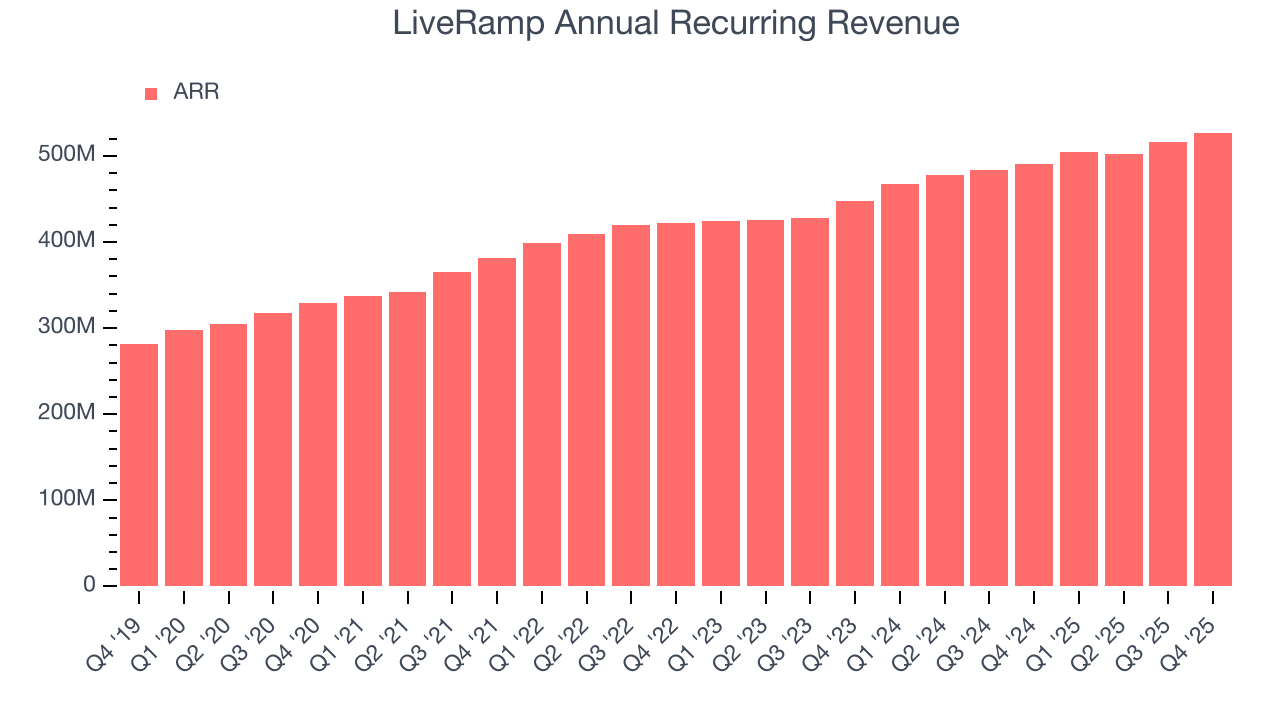
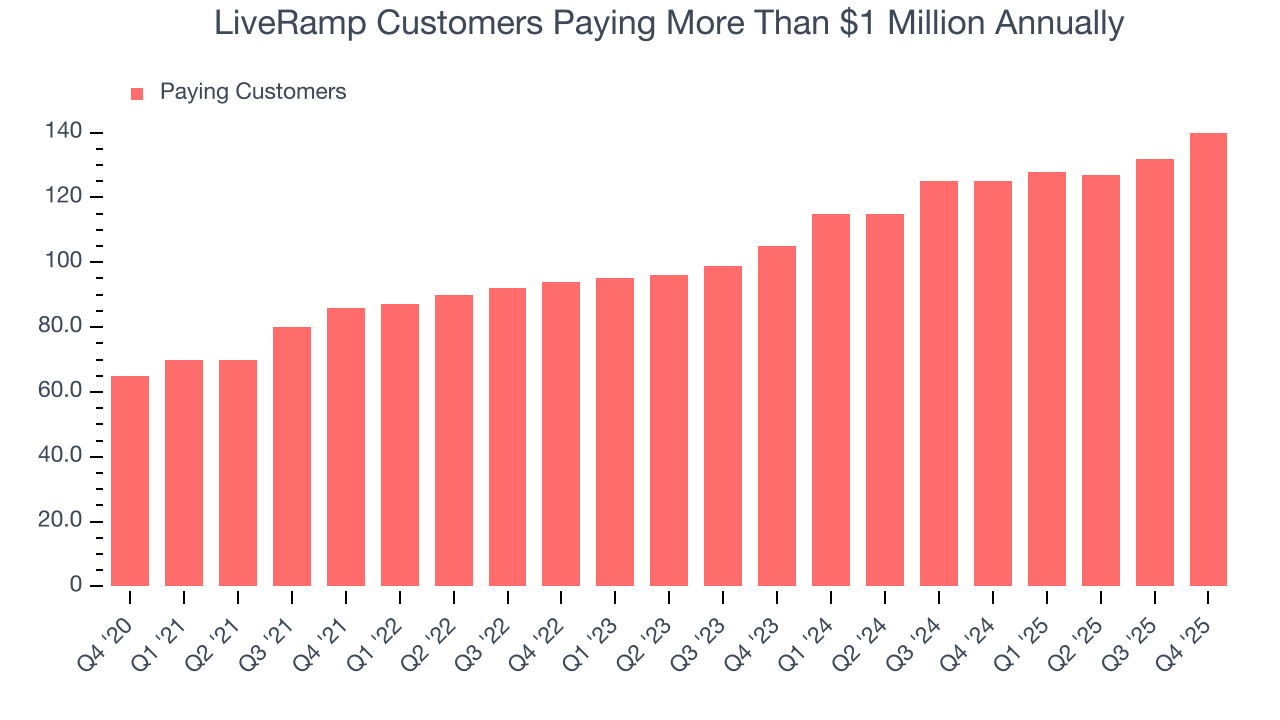
7. Enterprise Customer Base
This quarter, LiveRamp reported 140 enterprise customers paying more than $1 million annually, an increase of 8 from the previous quarter. That’s quite a bit more contract wins than last quarter and quite a bit above what we’ve observed over the previous year. Shareholders should take this as an indication that LiveRamp has made some recent improvements to its go-to-market strategy and that they are working well for the time being.
8. Customer Acquisition Efficiency
The customer acquisition cost (CAC) payback period represents the months required to recover the cost of acquiring a new customer. Essentially, it’s the break-even point for sales and marketing investments. A shorter CAC payback period is ideal, as it implies better returns on investment and business scalability.
LiveRamp is extremely efficient at acquiring new customers, and its CAC payback period checked in at 17 months this quarter. The company’s rapid recovery of its customer acquisition costs means it can attempt to spur growth by increasing its sales and marketing investments.
9. Customer Retention
One of the best parts about the software-as-a-service business model (and a reason why they trade at high valuation multiples) is that customers typically spend more on a company’s products and services over time.
LiveRamp’s net revenue retention rate, a key performance metric measuring how much money existing customers from a year ago are spending today, was 104% in Q4. This means LiveRamp would’ve grown its revenue by 4.2% even if it didn’t win any new customers over the last 12 months.
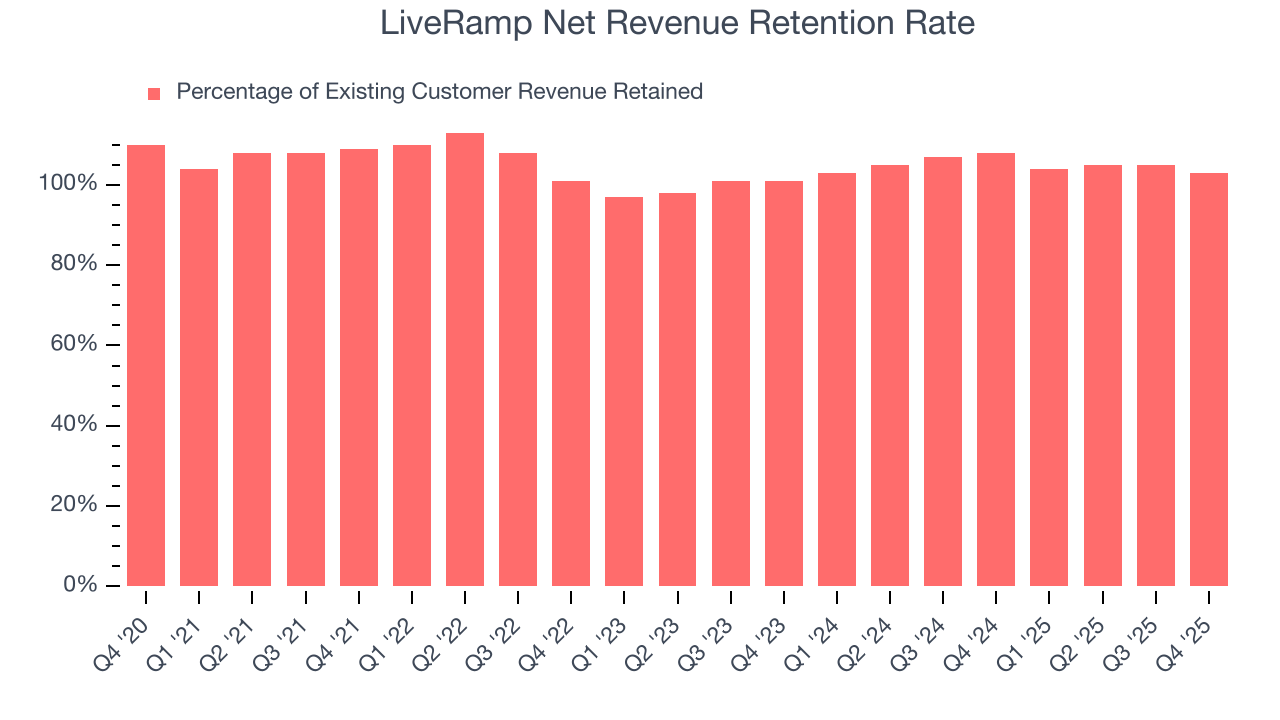
Despite falling over the last year, LiveRamp still has an adequate net retention rate, showing us that it generally keeps customers but lags behind the best SaaS businesses, which routinely post net retention rates of 120%+.
10. Gross Margin & Pricing Power
For software companies like LiveRamp, gross profit tells us how much money remains after paying for the base cost of products and services (typically servers, licenses, and certain personnel). These costs are usually low as a percentage of revenue, explaining why software is more lucrative than other sectors.
LiveRamp’s gross margin is slightly below the average software company, giving it less room than its competitors to invest in areas such as product and sales. As you can see below, it averaged a 70.4% gross margin over the last year. Said differently, LiveRamp had to pay a chunky $29.60 to its service providers for every $100 in revenue.
The market not only cares about gross margin levels but also how they change over time because expansion creates firepower for profitability and free cash generation. LiveRamp has seen gross margins decline by 2.1 percentage points over the last 2 year, which is among the worst in the software space.
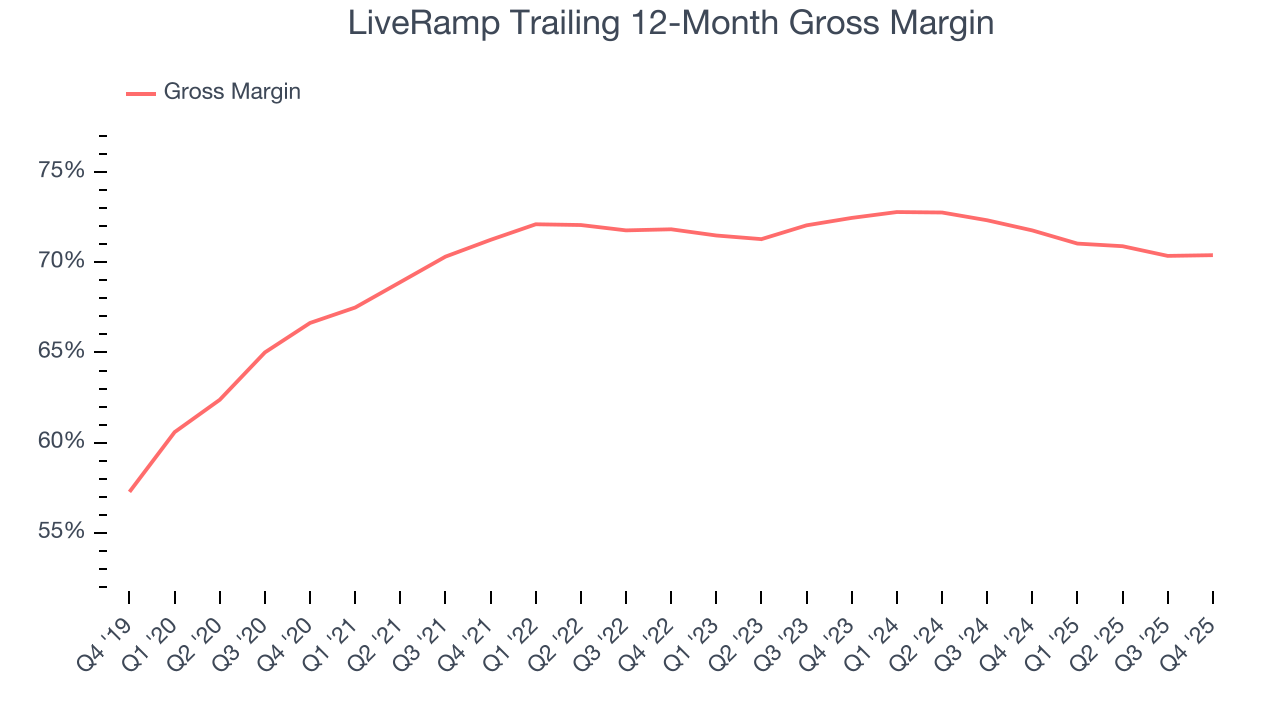
LiveRamp produced a 71.9% gross profit margin in Q4, in line with the same quarter last year. On a wider time horizon, LiveRamp’s full-year margin has been trending down over the past 12 months, decreasing by 1.4 percentage points. If this move continues, it could suggest a more competitive environment with some pressure to lower prices and higher input costs.
11. Operating Margin
LiveRamp has managed its cost base well over the last year. It demonstrated solid profitability for a software business, producing an average operating margin of 7.1%. This result was particularly impressive because of its low gross margin, which is mostly a factor of what it sells and takes huge shifts to move meaningfully. Companies have more control over their operating margins, and it’s a show of well-managed operations if they’re high when gross margins are low.
Analyzing the trend in its profitability, LiveRamp’s operating margin rose by 6.8 percentage points over the last two years, as its sales growth gave it operating leverage.
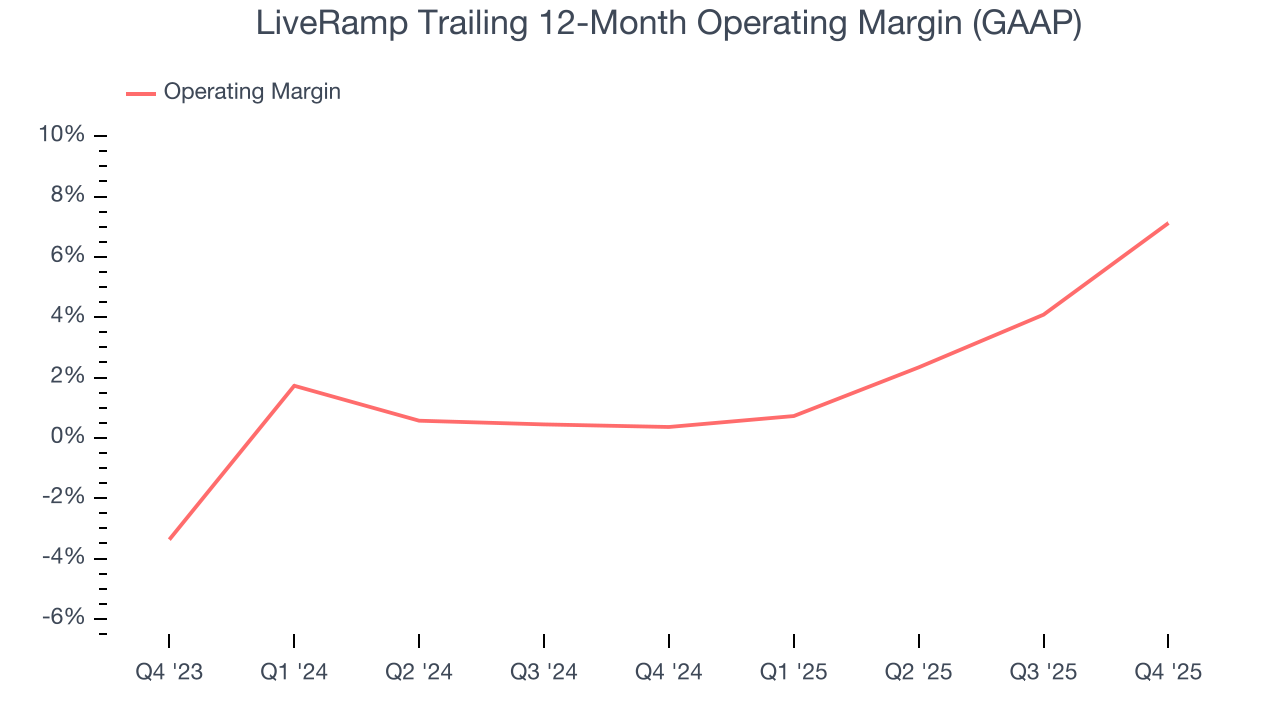
This quarter, LiveRamp generated an operating margin profit margin of 18.6%, up 11.1 percentage points year on year. The increase was solid, and because its operating margin rose more than its gross margin, we can infer it was more efficient with expenses such as marketing, R&D, and administrative overhead.
12. Cash Is King
Free cash flow isn't a prominently featured metric in company financials and earnings releases, but we think it's telling because it accounts for all operating and capital expenses, making it tough to manipulate. Cash is king.
LiveRamp has shown impressive cash profitability, driven by its cost-effective customer acquisition strategy that gives it the option to invest in new products and services rather than sales and marketing. The company’s free cash flow margin averaged 21.4% over the last year, better than the broader software sector.
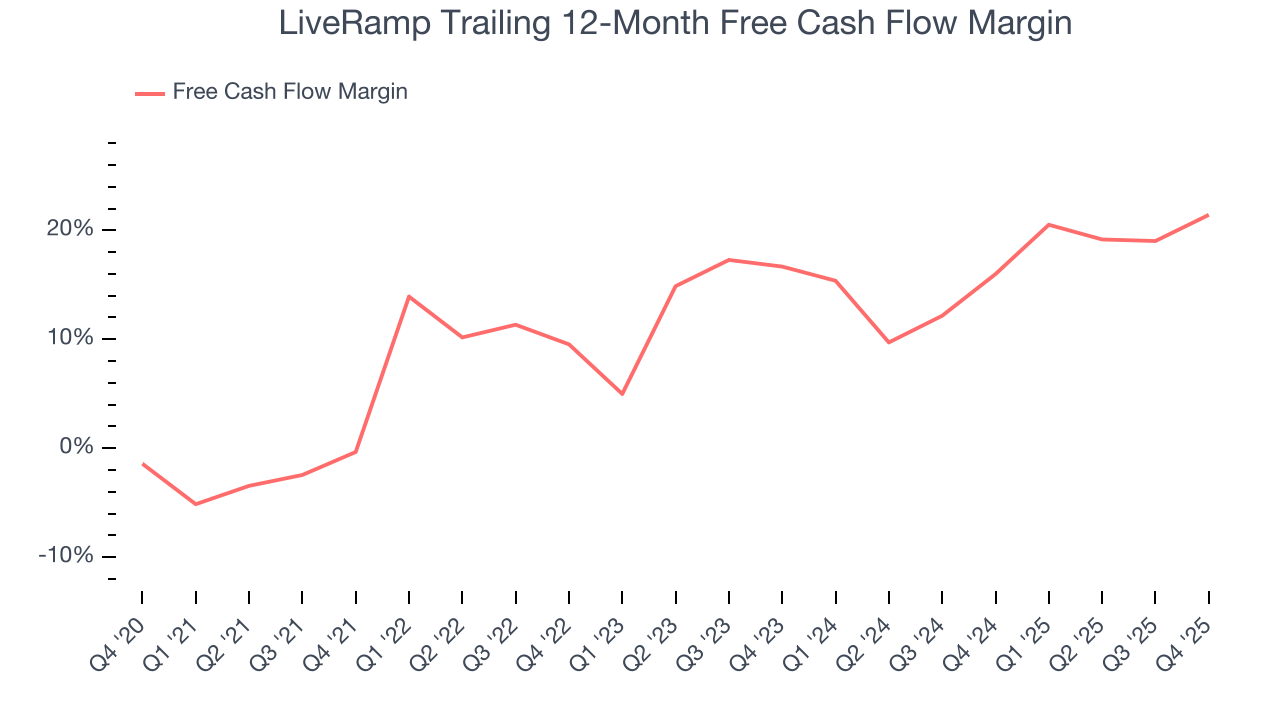
LiveRamp’s free cash flow clocked in at $67.1 million in Q4, equivalent to a 31.6% margin. This result was good as its margin was 8.7 percentage points higher than in the same quarter last year, but we wouldn’t read too much into the short term because investment needs can be seasonal, causing temporary swings. Long-term trends trump fluctuations.
Over the next year, analysts predict LiveRamp’s cash conversion will slightly fall. Their consensus estimates imply its free cash flow margin of 21.4% for the last 12 months will decrease to 18.2%.
13. Balance Sheet Assessment
Businesses that maintain a cash surplus face reduced bankruptcy risk.
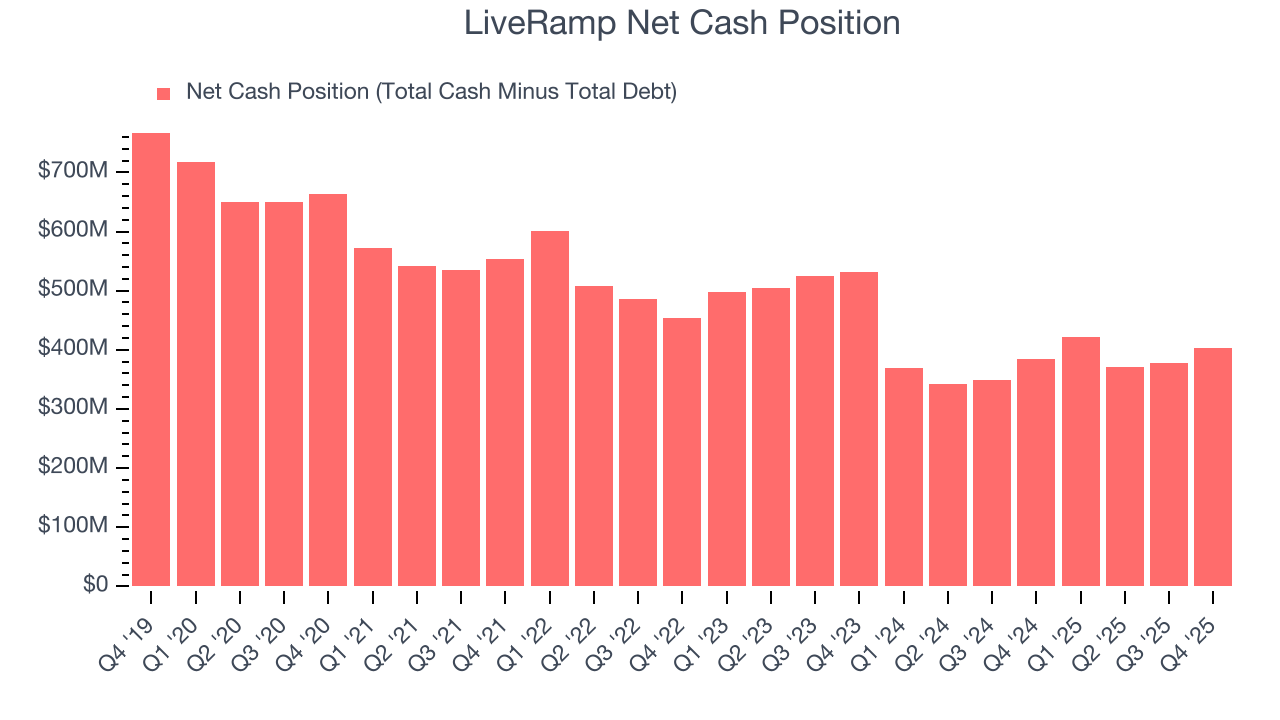
LiveRamp is a profitable, well-capitalized company with $403.4 million of cash and no debt. This position is 27.8% of its market cap and gives it the freedom to borrow money, return capital to shareholders, or invest in growth initiatives. Leverage is not an issue here.
14. Key Takeaways from LiveRamp’s Q4 Results
We were impressed by how significantly LiveRamp blew past analysts’ EBITDA expectations this quarter. On the other hand, its revenue guidance for next quarter slightly missed and its full-year revenue guidance fell slightly short of Wall Street’s estimates. Overall, this was a mixed quarter. The stock traded up 3.7% to $23.24 immediately after reporting.
15. Is Now The Time To Buy LiveRamp?
Updated: March 29, 2026 at 10:15 PM EDT
We think that the latest earnings result is only one piece of the bigger puzzle. If you’re deciding whether to own LiveRamp, you should also grasp the company’s longer-term business quality and valuation.
LiveRamp isn’t a terrible business, but it isn’t one of our picks. First off, its revenue growth was uninspiring over the last five years, and analysts expect its demand to deteriorate over the next 12 months. While its efficient sales strategy allows it to target and onboard new users at scale, the downside is its ARR has disappointed and shows the company is having difficulty retaining customers and their spending. On top of that, its customers generally do not adopt its complementary products.
LiveRamp’s price-to-sales ratio based on the next 12 months is 1.9x. This valuation multiple is fair, but we don’t have much faith in the company. We're fairly confident there are better investments elsewhere.
Wall Street analysts have a consensus one-year price target of $37.88 on the company (compared to the current share price of $25.73).
Although the price target is bullish, readers should exercise caution because analysts tend to be overly optimistic. The firms they work for, often big banks, have relationships with companies that extend into fundraising, M&A advisory, and other rewarding business lines. As a result, they typically hesitate to say bad things for fear they will lose out. We at StockStory do not suffer from such conflicts of interest, so we’ll always tell it like it is.