
Stanley Black & Decker (SWK)
Stanley Black & Decker is in for a bumpy ride. Its sales have underperformed and its low returns on capital show it has few growth opportunities.― StockStory Analyst Team
1. News


2. Summary
Why We Think Stanley Black & Decker Will Underperform
With an iconic “STANLEY” logo which has remained virtually unchanged for over a century, Stanley Black & Decker (NYSE:SWK) is a manufacturer primarily catering to the tool and outdoor equipment industry.
- Sales tumbled by 2.7% annually over the last two years, showing market trends are working against its favor during this cycle
- Incremental sales over the last five years were much less profitable as its earnings per share fell by 9.6% annually while its revenue grew
- Absence of organic revenue growth over the past two years suggests it may have to lean into acquisitions to drive its expansion


Stanley Black & Decker doesn’t meet our quality criteria. We’re redirecting our focus to better businesses.
Why There Are Better Opportunities Than Stanley Black & Decker


At $84.10 per share, Stanley Black & Decker trades at 16.4x forward P/E. Stanley Black & Decker’s multiple may seem like a great deal among industrials peers, but we think there are valid reasons why it’s this cheap.
Cheap stocks can look like a great deal at first glance, but they can be value traps. They often have less earnings power, meaning there is more reliance on a re-rating to generate good returns - an unlikely scenario for low-quality companies.
3. Stanley Black & Decker (SWK) Research Report: Q3 CY2025 Update
Manufacturing company Stanley Black & Decker (NYSE:SWK) met Wall Streets revenue expectations in Q3 CY2025, but sales were flat year on year at $3.76 billion. Its non-GAAP profit of $1.43 per share was 19.8% above analysts’ consensus estimates.
Stanley Black & Decker (SWK) Q3 CY2025 Highlights:
- Revenue: $3.76 billion vs analyst estimates of $3.77 billion (flat year on year, in line)
- Adjusted EPS: $1.43 vs analyst estimates of $1.19 (19.8% beat)
- Management lowered its full-year Adjusted EPS guidance to $4.55 at the midpoint, a 2.2% decrease
- Operating Margin: 3.1%, down from 8.6% in the same quarter last year
- Free Cash Flow Margin: 4.1%, down from 5.3% in the same quarter last year
- Organic Revenue fell 1% year on year vs analyst estimates of flat growth (47.7 basis point miss)
- Market Capitalization: $10.27 billion
Company Overview
With an iconic “STANLEY” logo which has remained virtually unchanged for over a century, Stanley Black & Decker (NYSE:SWK) is a manufacturer primarily catering to the tool and outdoor equipment industry.
Stanley Black & Decker's story starts with the establishment of Stanley's Bolt Manufactory by Frederick Stanley in 1843 and the Stanley Rule and Level Company by his cousin Henry Stanley in 1857. The two companies merged in 1920, forming The Stanley Works. In 2010, The Stanley Works merged with Black & Decker, creating Stanley Black & Decker.
In recent years, Stanley Black & Decker has actively reshaped its portfolio through strategic acquisitions and divestitures, concentrating on its core strengths in tools, outdoor products, and fastening systems. Notably, in December 2021, the company acquired the remaining 80% stake in MTD Holdings for $1.5 billion, expanding its presence in the outdoor market. Additionally, the acquisition of Excel Industries for $374 million strengthened the company's foothold in the independent dealer network. Stanley sold its CSS and MAS businesses, as well as the Oil & Gas and Infrastructure businesses to shed non-core operations to focus on areas where the company holds strong market positions.
Stanley Black & Decker’s product offerings can be logically divided into two categories: tools and outdoor and industrial products, which it sells through a variety of brands. In the tools and outdoor category, the company provides a lineup of power tools, hand tools, accessories, and outdoor power equipment. For instance, the DEWALT® Cordless Drill is a key product used for drilling holes and driving screws. In the industrial category Stanley Black & Decker specializes in engineered components such as fasteners, fittings, and various engineered products. The business serves automotive, manufacturing, electronics, construction, and aerospace sectors. Additionally, the company designs and manufactures attachments for excavators and handheld hydraulic tools used in infrastructure and construction. While its tools and outdoors products are primarily sold through mass retailers and third party distributors, its industrial products are primarily distributed through a direct sales force, for a more targeted and effective market reach given the large orders customers place. Stanley Black & Decker generates revenue from the sale of its goods, with the majority of its revenue from its tools and outdoor products. The company also benefits from recurring revenue through its aftermarket services, the sale of consumables and replacement parts.
4. Professional Tools and Equipment
Automation that increases efficiency and connected equipment that collects analyzable data have been trending, creating new demand. Some professional tools and equipment companies also provide software to accompany measurement or automated machinery, adding a stream of recurring revenues to their businesses. On the other hand, professional tools and equipment companies are at the whim of economic cycles. Consumer spending and interest rates, for example, can greatly impact the industrial production that drives demand for these companies’ offerings.
Competitors offering similar products include Snap-On (NYSE:SNA), Illinois Tool Works (NYSE:ITW), and Newell Brands (NYSE:NWL).
5. Revenue Growth
Examining a company’s long-term performance can provide clues about its quality. Any business can experience short-term success, but top-performing ones enjoy sustained growth for years. Regrettably, Stanley Black & Decker’s sales grew at a sluggish 3.5% compounded annual growth rate over the last five years. This fell short of our benchmark for the industrials sector and is a rough starting point for our analysis.
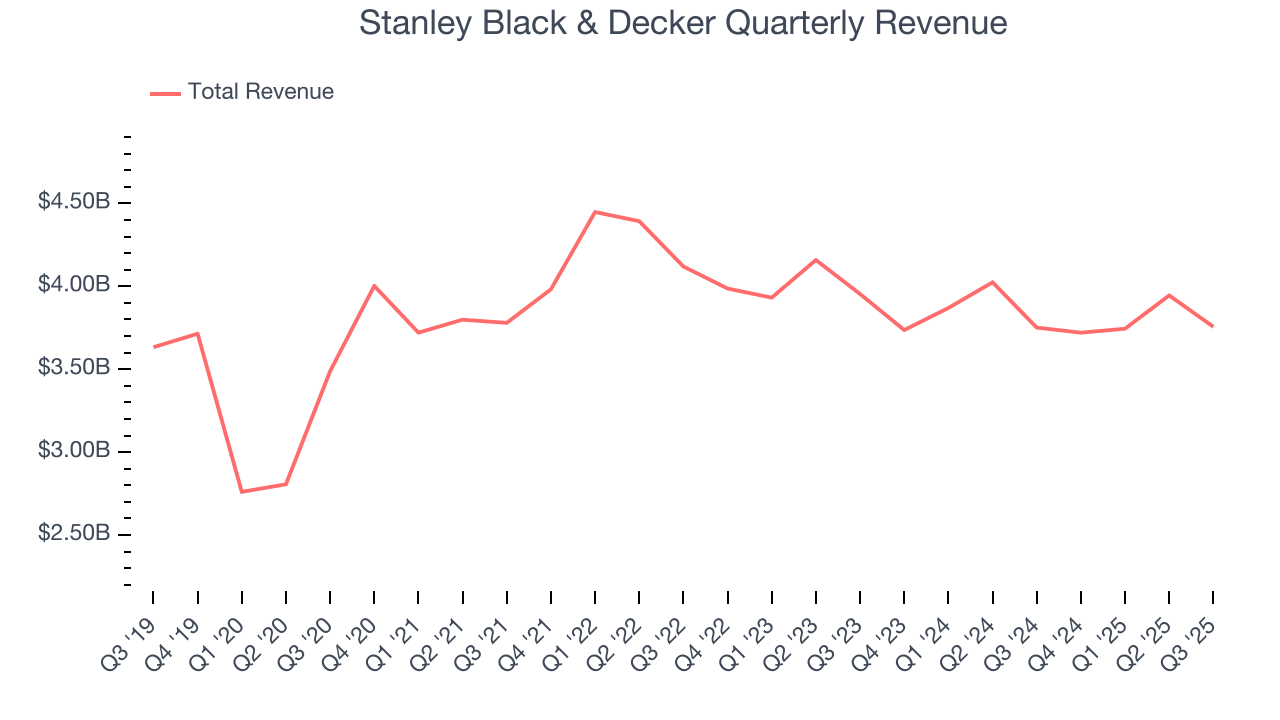
Long-term growth is the most important, but within industrials, a half-decade historical view may miss new industry trends or demand cycles. Stanley Black & Decker’s performance shows it grew in the past but relinquished its gains over the last two years, as its revenue fell by 2.7% annually. 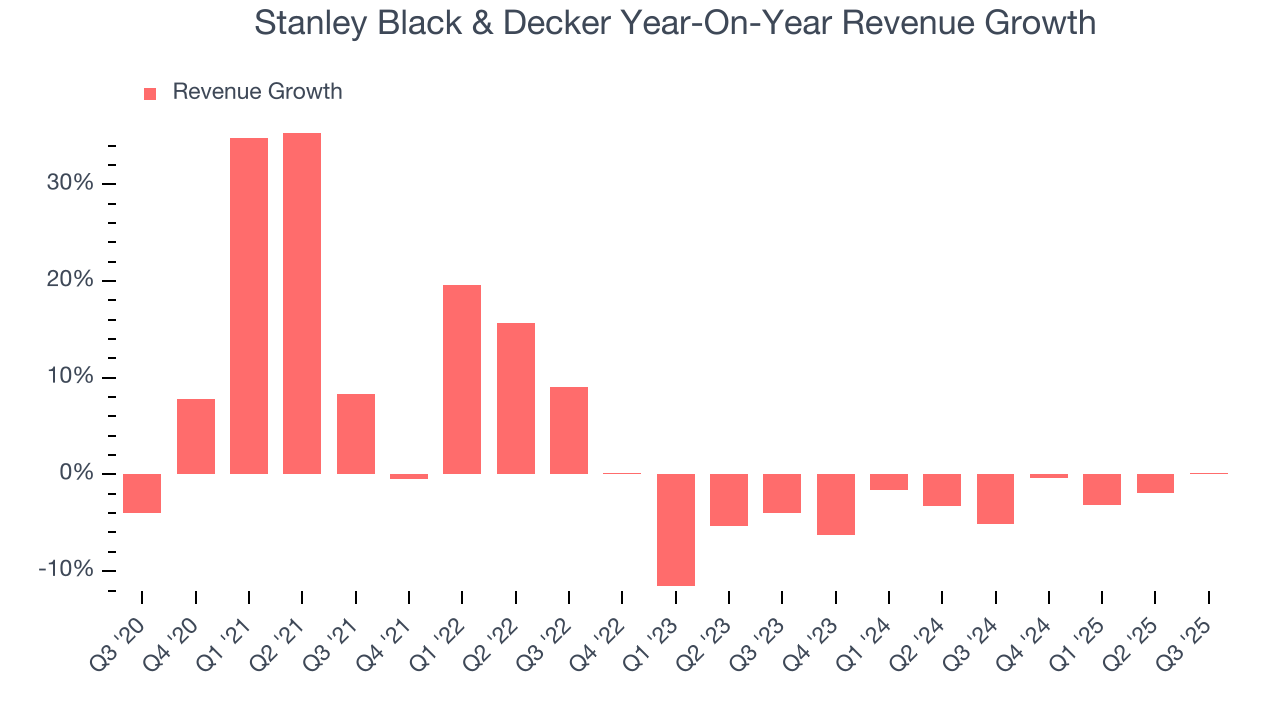
Stanley Black & Decker also reports organic revenue, which strips out one-time events like acquisitions and currency fluctuations that don’t accurately reflect its fundamentals. Over the last two years, Stanley Black & Decker’s organic revenue averaged 1.2% year-on-year declines. Because this number aligns with its two-year revenue growth, we can see the company’s core operations (not acquisitions and divestitures) drove most of its results. 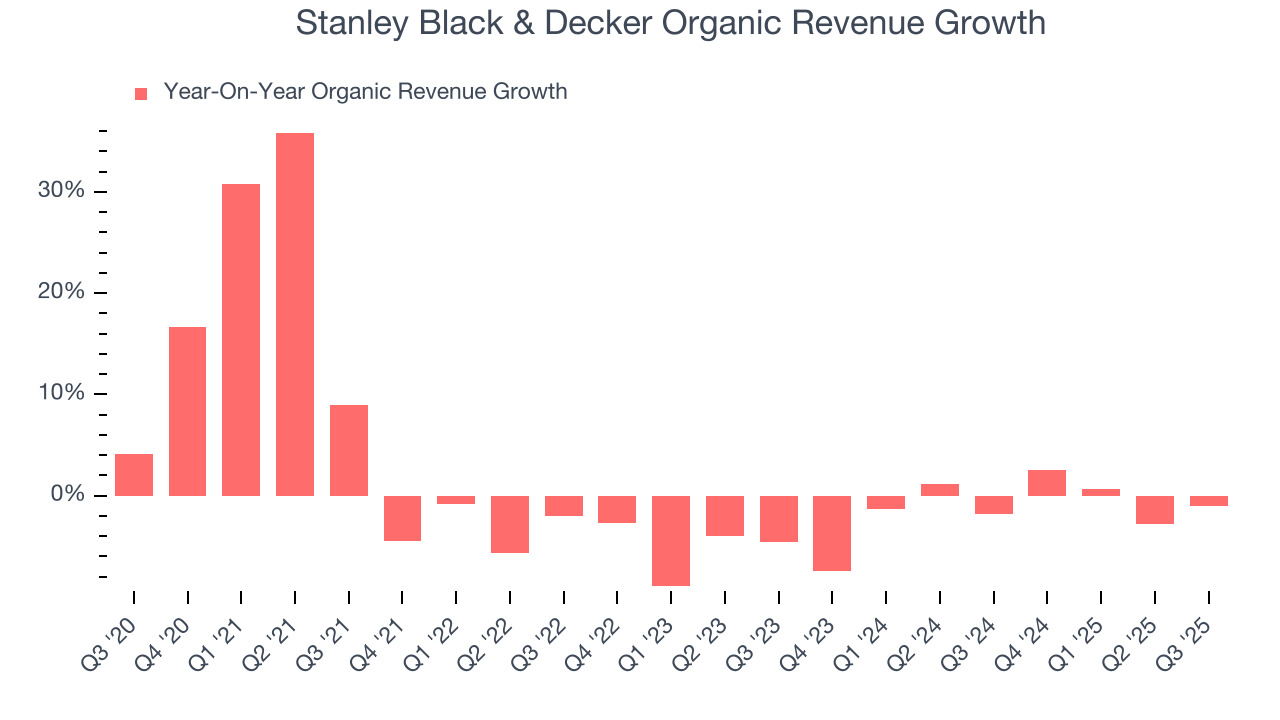
This quarter, Stanley Black & Decker’s $3.76 billion of revenue was flat year on year and in line with Wall Street’s estimates.
Looking ahead, sell-side analysts expect revenue to grow 3.3% over the next 12 months. Although this projection indicates its newer products and services will catalyze better top-line performance, it is still below the sector average.
6. Gross Margin & Pricing Power
Stanley Black & Decker’s gross margin is slightly below the average industrials company, giving it less room to invest in areas such as research and development. As you can see below, it averaged a 29.3% gross margin over the last five years. That means Stanley Black & Decker paid its suppliers a lot of money ($70.67 for every $100 in revenue) to run its business. 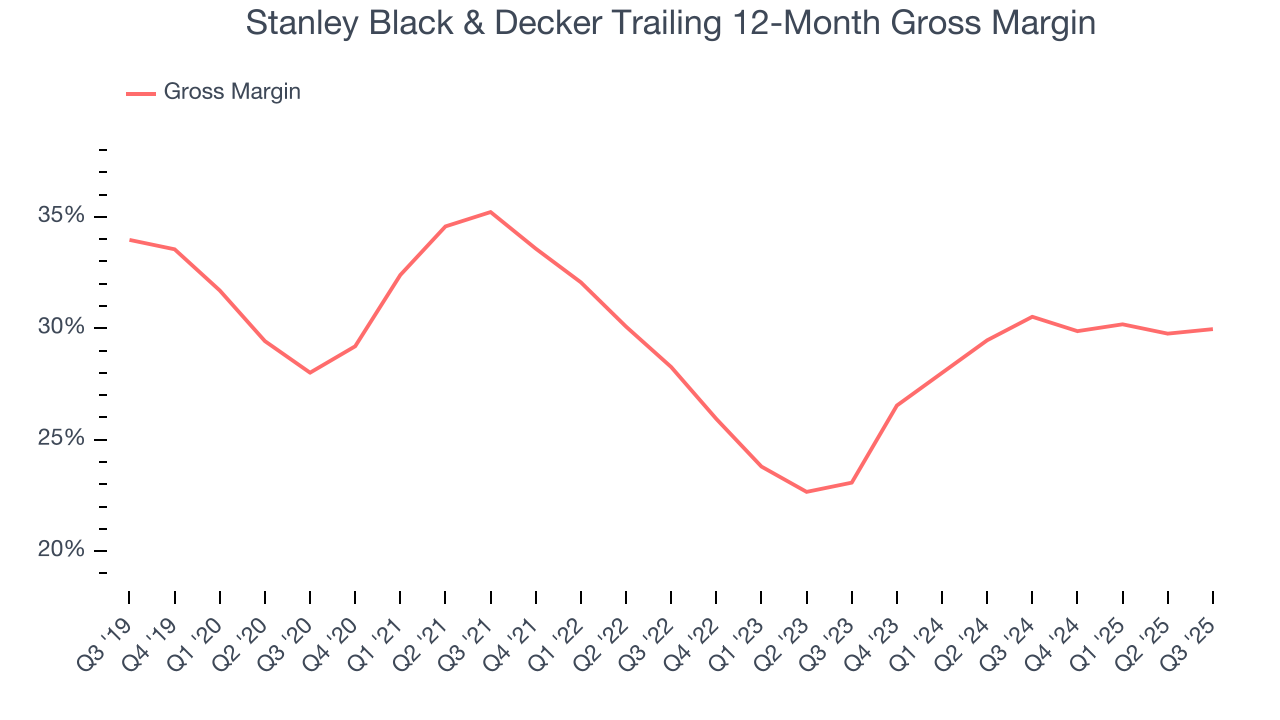
This quarter, Stanley Black & Decker’s gross profit margin was 31.4%, in line with the same quarter last year. On a wider time horizon, the company’s full-year margin has remained steady over the past four quarters, suggesting its input costs (such as raw materials and manufacturing expenses) have been stable and it isn’t under pressure to lower prices.
7. Operating Margin
Stanley Black & Decker was profitable over the last five years but held back by its large cost base. Its average operating margin of 7.4% was weak for an industrials business. This result isn’t too surprising given its low gross margin as a starting point.
Analyzing the trend in its profitability, Stanley Black & Decker’s operating margin decreased by 9.8 percentage points over the last five years. This raises questions about the company’s expense base because its revenue growth should have given it leverage on its fixed costs, resulting in better economies of scale and profitability. Stanley Black & Decker’s performance was poor no matter how you look at it - it shows that costs were rising and it couldn’t pass them onto its customers.
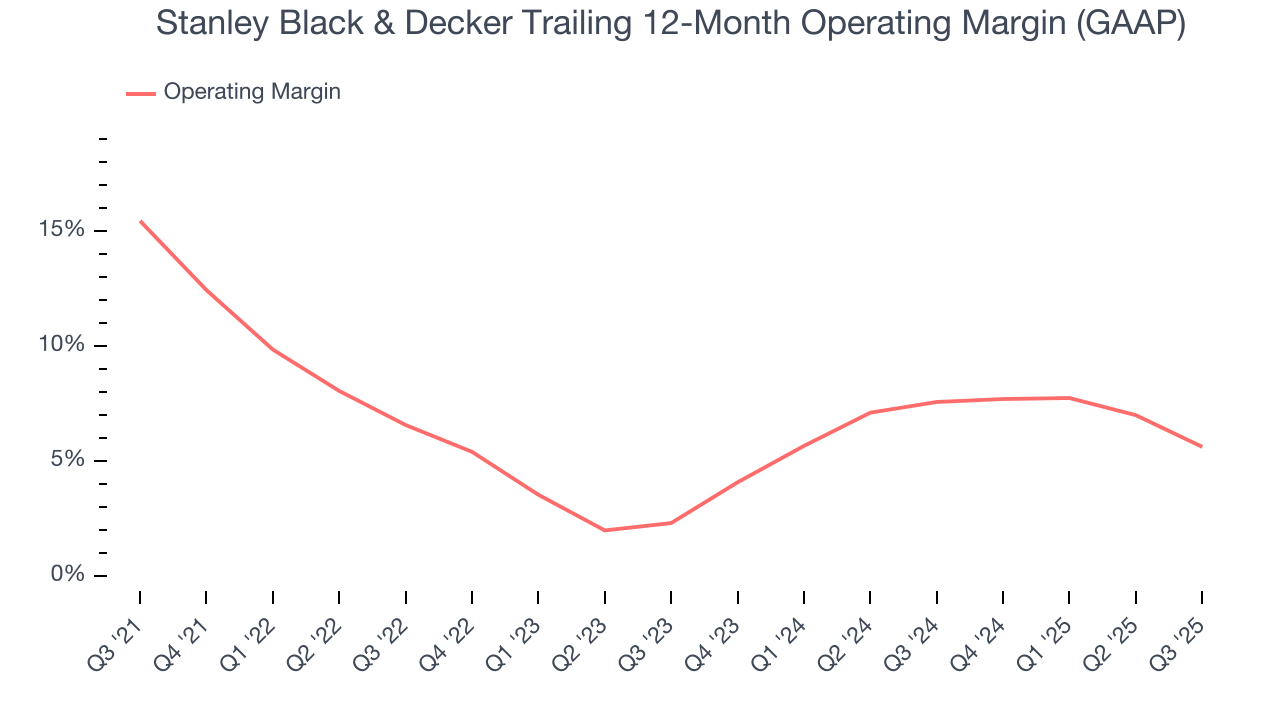
This quarter, Stanley Black & Decker generated an operating margin profit margin of 3.1%, down 5.6 percentage points year on year. Since Stanley Black & Decker’s operating margin decreased more than its gross margin, we can assume it was less efficient because expenses such as marketing, R&D, and administrative overhead increased.
8. Earnings Per Share
We track the long-term change in earnings per share (EPS) for the same reason as long-term revenue growth. Compared to revenue, however, EPS highlights whether a company’s growth is profitable.
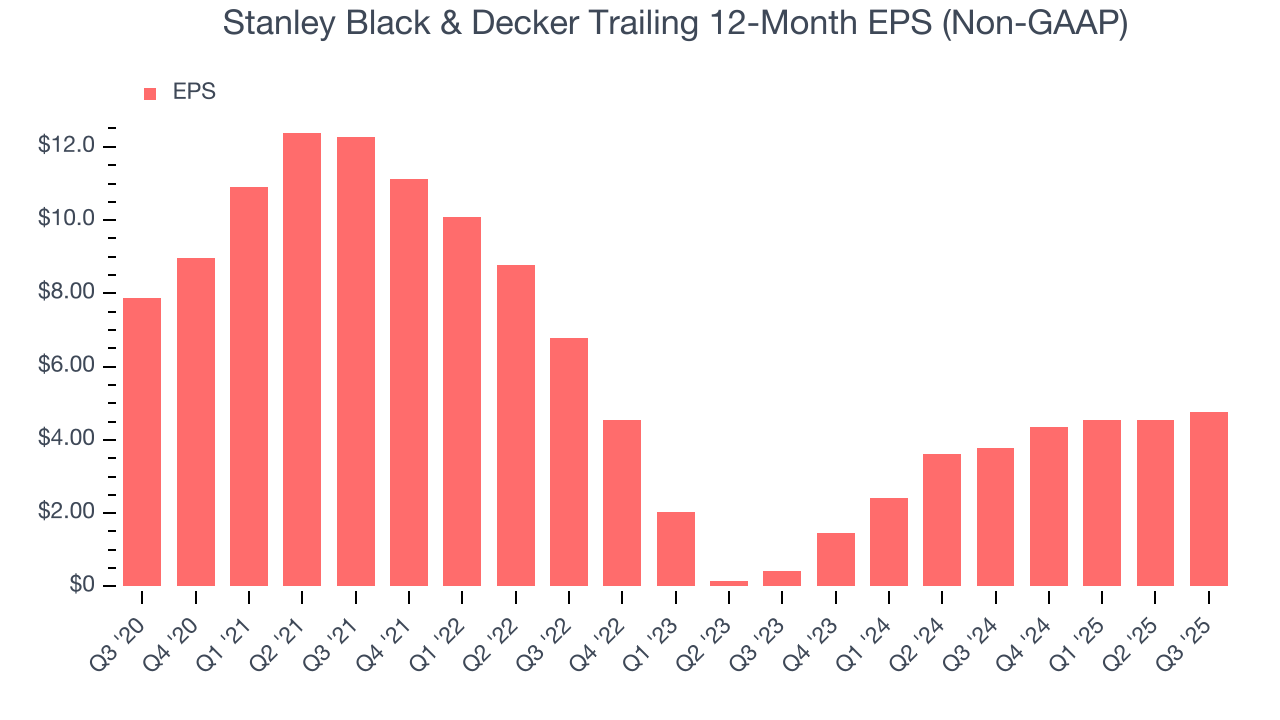
Sadly for Stanley Black & Decker, its EPS declined by 9.6% annually over the last five years while its revenue grew by 3.5%. This tells us the company became less profitable on a per-share basis as it expanded due to non-fundamental factors such as interest expenses and taxes.
Diving into the nuances of Stanley Black & Decker’s earnings can give us a better understanding of its performance. As we mentioned earlier, Stanley Black & Decker’s operating margin declined by 9.8 percentage points over the last five years. This was the most relevant factor (aside from the revenue impact) behind its lower earnings; interest expenses and taxes can also affect EPS but don’t tell us as much about a company’s fundamentals.
Like with revenue, we analyze EPS over a shorter period to see if we are missing a change in the business.
For Stanley Black & Decker, its two-year annual EPS growth of 232% was higher than its five-year trend. This acceleration made it one of the faster-growing industrials companies in recent history.
In Q3, Stanley Black & Decker reported adjusted EPS of $1.43, up from $1.22 in the same quarter last year. This print easily cleared analysts’ estimates, and shareholders should be content with the results. Over the next 12 months, Wall Street expects Stanley Black & Decker’s full-year EPS of $4.75 to grow 15.6%.
9. Cash Is King
If you’ve followed StockStory for a while, you know we emphasize free cash flow. Why, you ask? We believe that in the end, cash is king, and you can’t use accounting profits to pay the bills.
Stanley Black & Decker has shown poor cash profitability over the last five years, giving the company limited opportunities to return capital to shareholders. Its free cash flow margin averaged 1.1%, lousy for an industrials business.
Taking a step back, we can see that Stanley Black & Decker’s margin dropped by 5.7 percentage points during that time. Almost any movement in the wrong direction is undesirable because of its already low cash conversion. If the trend continues, it could signal it’s in the middle of a big investment cycle.
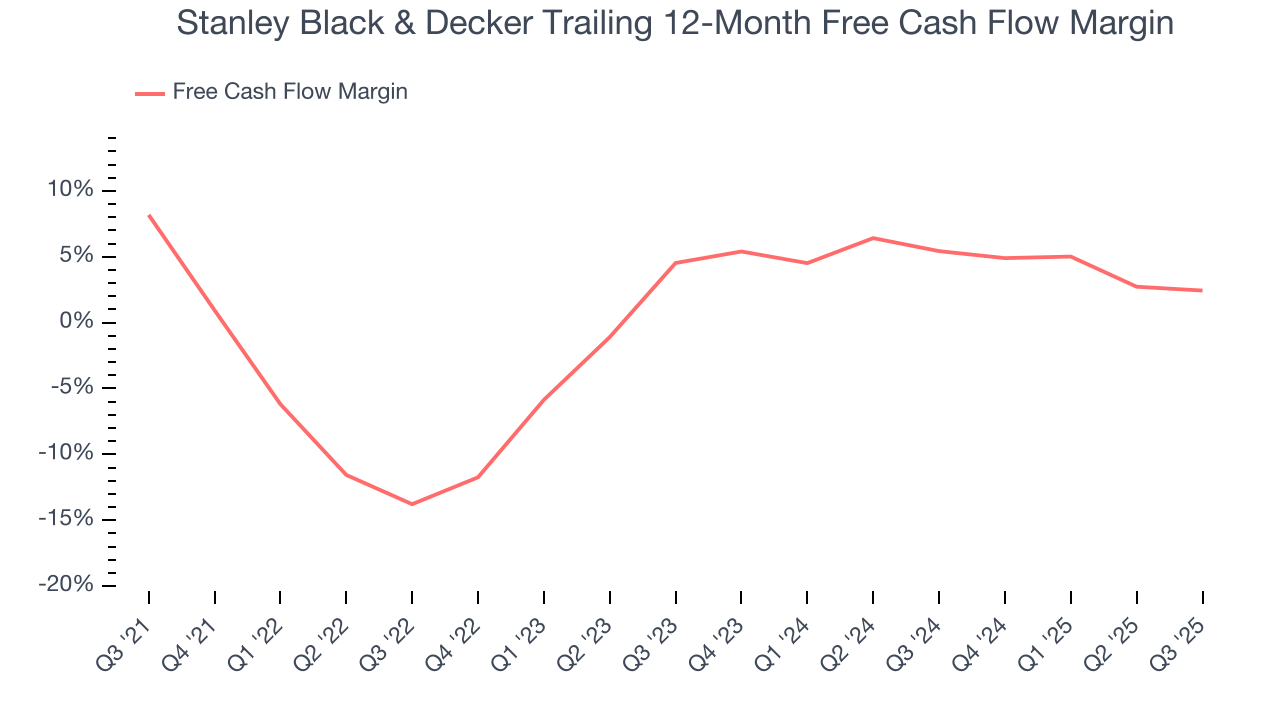
Stanley Black & Decker’s free cash flow clocked in at $155.3 million in Q3, equivalent to a 4.1% margin. The company’s cash profitability regressed as it was 1.2 percentage points lower than in the same quarter last year, but it’s still above its five-year average. We wouldn’t read too much into this quarter’s decline because investment needs can be seasonal, leading to short-term swings. Long-term trends carry greater meaning.
10. Return on Invested Capital (ROIC)
EPS and free cash flow tell us whether a company was profitable while growing its revenue. But was it capital-efficient? A company’s ROIC explains this by showing how much operating profit it makes compared to the money it has raised (debt and equity).
Stanley Black & Decker historically did a mediocre job investing in profitable growth initiatives. Its five-year average ROIC was 7.3%, somewhat low compared to the best industrials companies that consistently pump out 20%+.
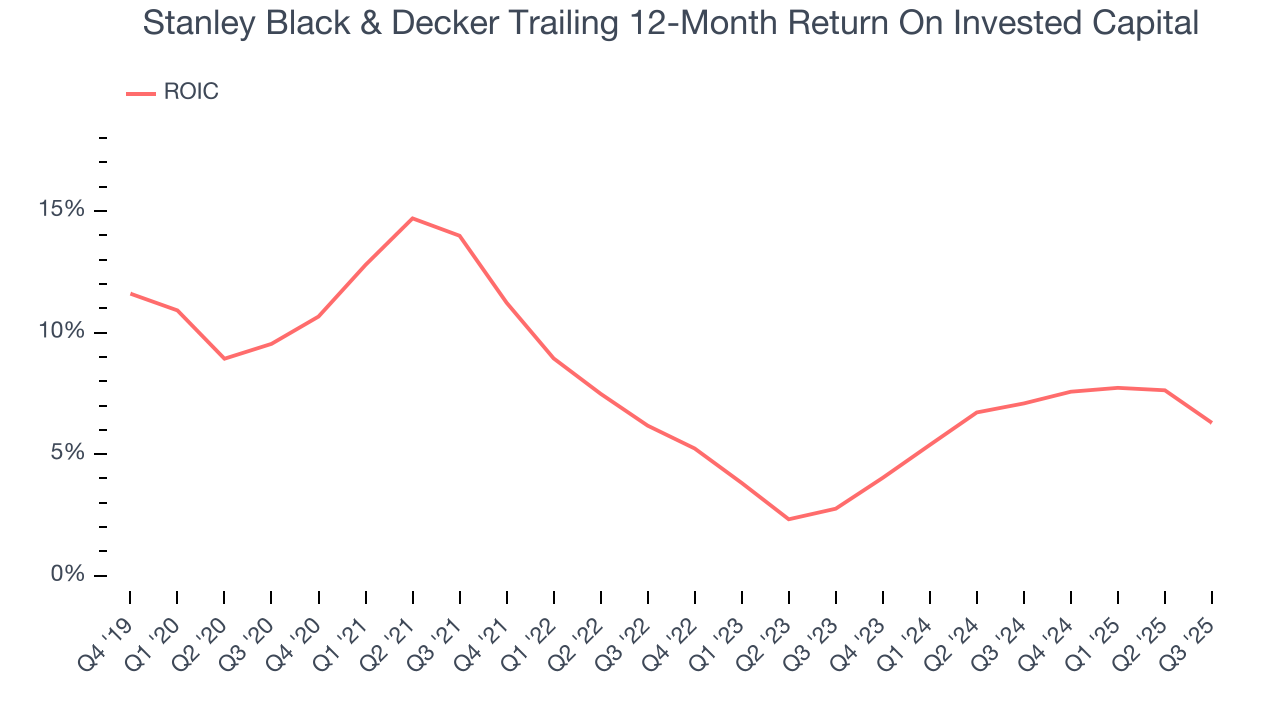
We like to invest in businesses with high returns, but the trend in a company’s ROIC is what often surprises the market and moves the stock price. On average, Stanley Black & Decker’s ROIC decreased by 3.4 percentage points annually over the last few years. Paired with its already low returns, these declines suggest its profitable growth opportunities are few and far between.
11. Balance Sheet Assessment
Stanley Black & Decker reported $268.3 million of cash and $6.61 billion of debt on its balance sheet in the most recent quarter. As investors in high-quality companies, we primarily focus on two things: 1) that a company’s debt level isn’t too high and 2) that its interest payments are not excessively burdening the business.
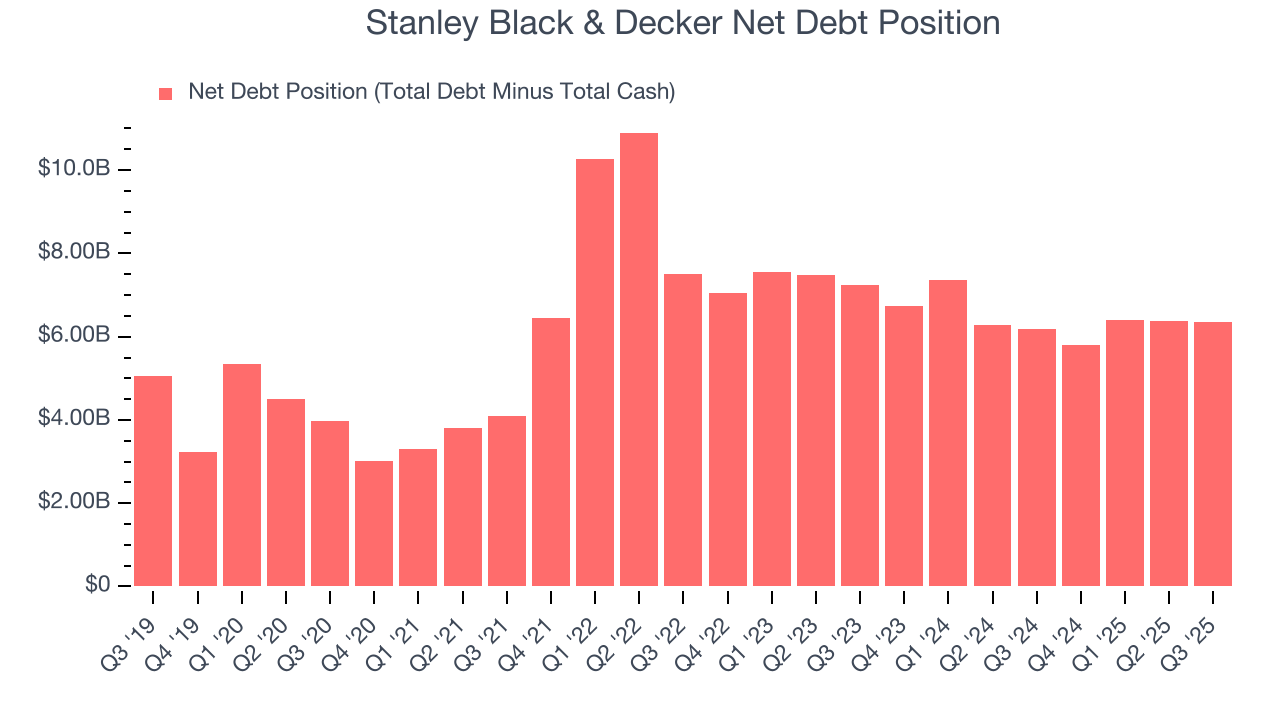
With $1.53 billion of EBITDA over the last 12 months, we view Stanley Black & Decker’s 4.1× net-debt-to-EBITDA ratio as safe. We also see its $152.9 million of annual interest expenses as appropriate. The company’s profits give it plenty of breathing room, allowing it to continue investing in growth initiatives.
12. Key Takeaways from Stanley Black & Decker’s Q3 Results
It was good to see Stanley Black & Decker beat analysts’ EPS expectations this quarter. On the other hand, its revenue was just in line and full-year EPS guidance missed Wall Street’s estimates. Overall, this quarter could have been better. The stock traded down 2.8% to $64.49 immediately following the results.
13. Is Now The Time To Buy Stanley Black & Decker?
Updated: January 20, 2026 at 10:43 PM EST
We think that the latest earnings result is only one piece of the bigger puzzle. If you’re deciding whether to own Stanley Black & Decker, you should also grasp the company’s longer-term business quality and valuation.
Stanley Black & Decker falls short of our quality standards. To kick things off, its revenue growth was weak over the last five years, and analysts expect its demand to deteriorate over the next 12 months. On top of that, Stanley Black & Decker’s declining EPS over the last five years makes it a less attractive asset to the public markets, and its declining operating margin shows the business has become less efficient.
Stanley Black & Decker’s P/E ratio based on the next 12 months is 16.4x. This valuation is reasonable, but the company’s shaky fundamentals present too much downside risk. There are superior stocks to buy right now.
Wall Street analysts have a consensus one-year price target of $87.51 on the company (compared to the current share price of $80.98).