
THOR Industries (THO)
We wouldn’t buy THOR Industries. Its poor sales growth and falling returns on capital suggest its growth opportunities are shrinking.― StockStory Analyst Team
1. News


2. Summary
Why We Think THOR Industries Will Underperform
Created through the acquisition and merger of various RV manufacturers, THOR Industries manufactures and sells a range of recreational vehicles, including motorhomes and travel trailers, catering to consumers seeking the freedom and comfort of the RV lifestyle.
- Sales tumbled by 3.3% annually over the last two years, showing market trends are working against its favor during this cycle
- Earnings per share have contracted by 1.2% annually over the last two years, a headwind for returns as stock prices often echo long-term EPS performance
- Projected sales decline of 1.7% over the next 12 months indicates demand will continue deteriorating


THOR Industries doesn’t live up to our standards. There are superior opportunities elsewhere.
Why There Are Better Opportunities Than THOR Industries


THOR Industries is trading at $95.90 per share, or 21.3x forward P/E. THOR Industries’s valuation may seem like a bargain, especially when stacked up against other industrials companies. We remind you that you often get what you pay for, though.
It’s better to pay up for high-quality businesses with higher long-term earnings potential rather than to buy lower-quality stocks because they appear cheap. These challenged businesses often don’t re-rate, a phenomenon known as a “value trap”.
3. THOR Industries (THO) Research Report: Q4 CY2025 Update
RV manufacturer Thor Industries (NYSE:THO) reported Q4 CY2025 results exceeding the market’s revenue expectations, with sales up 5.3% year on year to $2.13 billion. On the other hand, the company’s full-year revenue guidance of $9.25 billion at the midpoint came in 3.9% below analysts’ estimates. Its GAAP profit of $0.34 per share was significantly above analysts’ consensus estimates.
THOR Industries (THO) Q4 CY2025 Highlights:
- Revenue: $2.13 billion vs analyst estimates of $1.95 billion (5.3% year-on-year growth, 9% beat)
- EPS (GAAP): $0.34 vs analyst estimates of $0.03 (significant beat)
- Adjusted EBITDA: $98.05 million vs analyst estimates of $87.1 million (4.6% margin, 12.6% beat)
- The company reconfirmed its revenue guidance for the full year of $9.25 billion at the midpoint
- EPS (GAAP) guidance for the full year is $4 at the midpoint, missing analyst estimates by 4.9%
- Market Capitalization: $5.06 billion
Company Overview
Created through the acquisition and merger of various RV manufacturers, THOR Industries manufactures and sells a range of recreational vehicles, including motorhomes and travel trailers, catering to consumers seeking the freedom and comfort of the RV lifestyle.
THOR Industries was founded in 1980 by Wade F. B. Thompson and Peter B. Orthwein to produce recreational vehicles (RVs) that offer consumers the freedom to explore and travel comfortably.
THOR Industries provides a range of RVs, including motorhomes, travel trailers, and fifth wheels, designed to meet the diverse needs of consumers. The company's product offerings address the desire for mobility and convenience in leisure travel, making it easier for individuals and families to embark on road trips and outdoor adventures. For instance, THOR's motorhomes are equipped with modern amenities such as full kitchens, comfortable sleeping quarters, and entertainment systems, providing a home-like experience on the road.
The primary revenue sources for THOR Industries come from the sale of its RVs and related products. The company's business model focuses on manufacturing and distributing its vehicles through a network of independent dealers. The company appeals to a range of consumers, from first-time buyers to experienced RV users, by offering a variety of models and customization options. Recurring revenue is generated through after-sales services, parts, and accessories.
4. Automobile Manufacturing
Much capital investment and technical know-how are needed to manufacture functional, safe, and aesthetically pleasing automobiles for the mass market. Barriers to entry are therefore high, and auto manufacturers with economies of scale can boast strong economic moats. However, this doesn’t insulate them from new entrants, as electric vehicles (EVs) have entered the market and are upending it. This has forced established manufacturers to not only contend with emerging EV-first competitors but also decide how much they want to invest in these disruptive technologies, which will likely cannibalize their legacy offerings.
THOR Industries' competitors in the recreational vehicle market include Winnebago Industries (NYSE:WGO), Forest River (a subsidiary of Berkshire Hathaway NYSE:BRK.B), Polaris Inc. (NYSE:PII), and Knaus Tabbert (ETR:KTA).
5. Revenue Growth
A company’s long-term performance is an indicator of its overall quality. Any business can put up a good quarter or two, but the best consistently grow over the long haul. Regrettably, THOR Industries’s sales grew at a weak 1.4% compounded annual growth rate over the last five years. This was below our standards and is a poor baseline for our analysis.
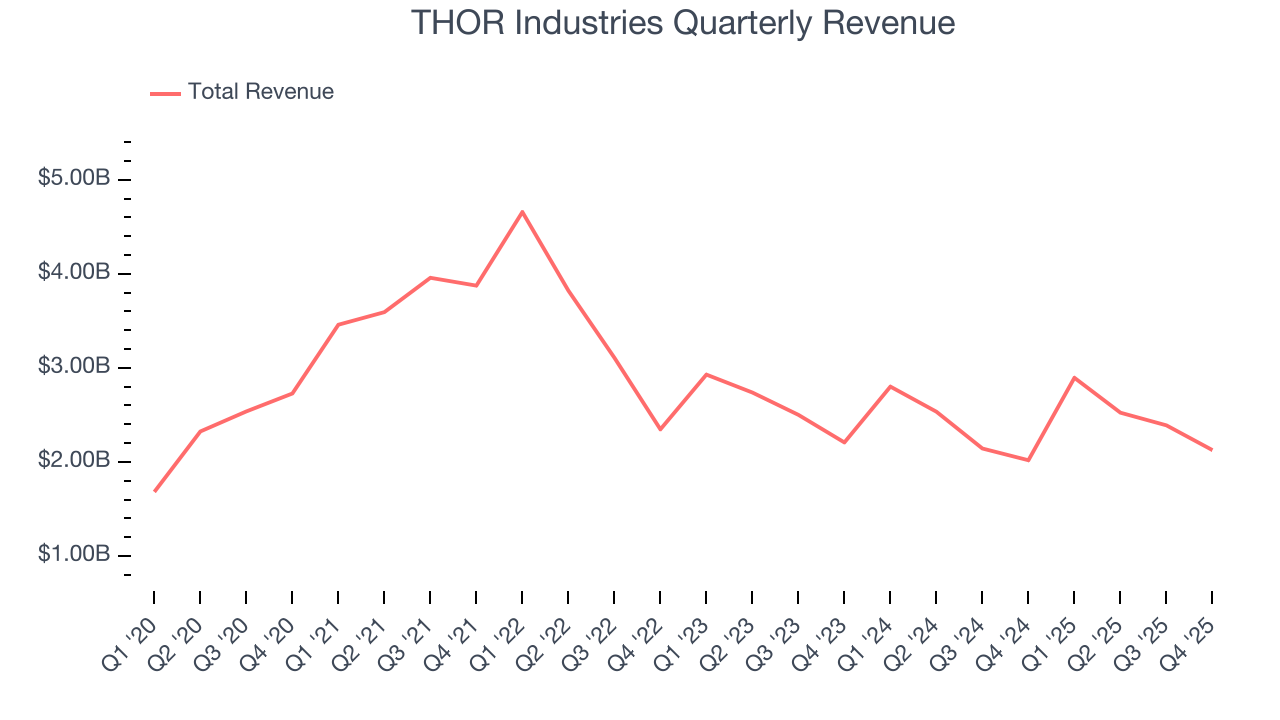
We at StockStory place the most emphasis on long-term growth, but within industrials, a half-decade historical view may miss cycles, industry trends, or a company capitalizing on catalysts such as a new contract win or a successful product line. THOR Industries’s performance shows it grew in the past but relinquished its gains over the last two years, as its revenue fell by 2.2% annually. 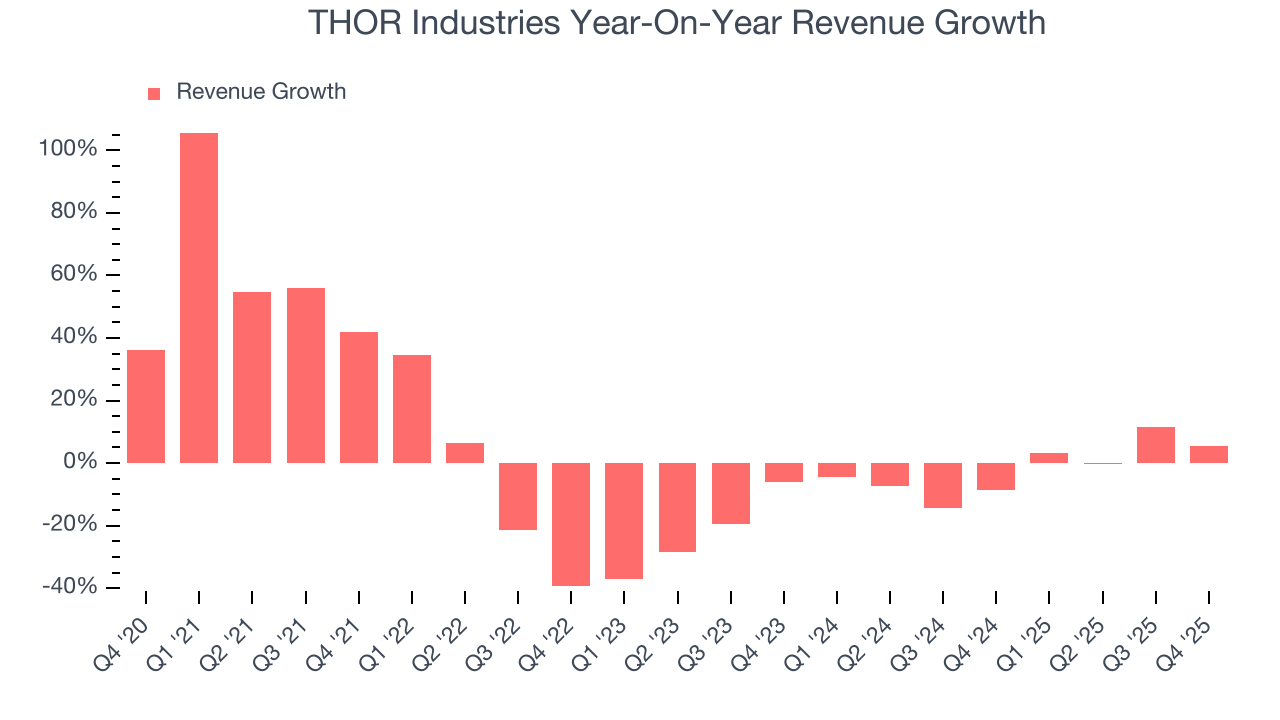
This quarter, THOR Industries reported year-on-year revenue growth of 5.3%, and its $2.13 billion of revenue exceeded Wall Street’s estimates by 9%.
Looking ahead, sell-side analysts expect revenue to decline by 1.9% over the next 12 months, similar to its two-year rate. This projection is underwhelming and indicates its newer products and services will not lead to better top-line performance yet.
6. Gross Margin & Pricing Power
Cost of sales for an industrials business is usually comprised of the direct labor, raw materials, and supplies needed to offer a product or service. These costs can be impacted by inflation and supply chain dynamics.
THOR Industries has bad unit economics for an industrials business, signaling it operates in a competitive market. This is also because it’s an automobile manufacturer.
Automobile manufacturers have structurally lower profitability as they often break even on the initial sale of vehicles and instead make money on parts and servicing, which come many years later - this explains why new entrants such as Rivian, Lucid, and Nikola have negative gross margins. As you can see below, these dynamics culminated in an average 15.1% gross margin for THOR Industries over the last five years.
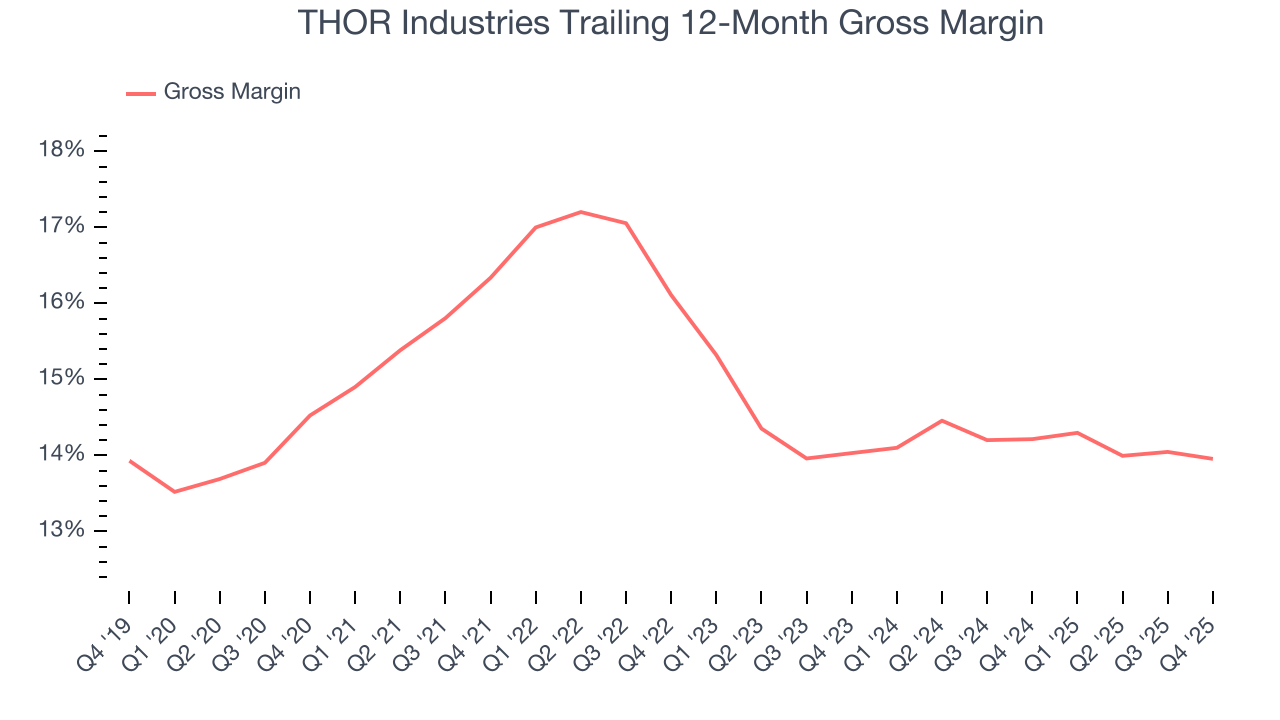
In Q4, THOR Industries produced a 11.8% gross profit margin, in line with the same quarter last year. Zooming out, the company’s full-year margin has remained steady over the past 12 months, suggesting its input costs (such as raw materials and manufacturing expenses) have been stable and it isn’t under pressure to lower prices.
7. Operating Margin
Operating margin is an important measure of profitability as it shows the portion of revenue left after accounting for all core expenses – everything from the cost of goods sold to advertising and wages. It’s also useful for comparing profitability across companies with different levels of debt and tax rates because it excludes interest and taxes.
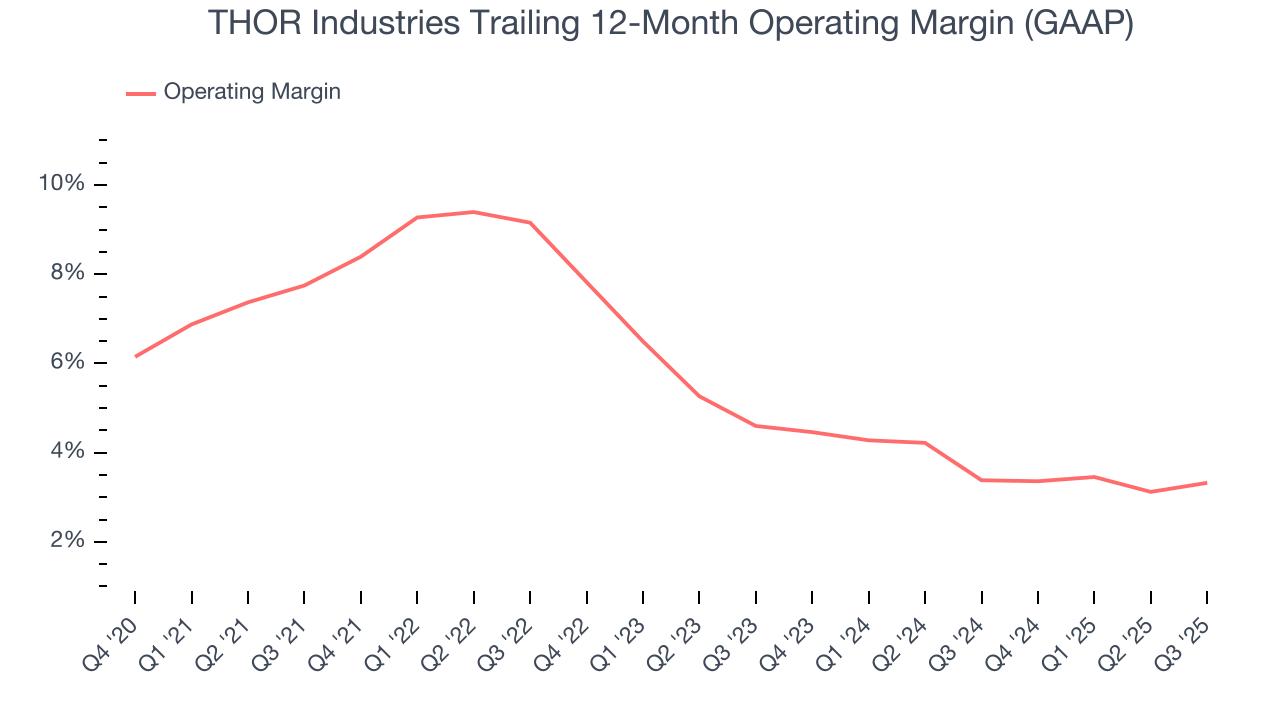
THOR Industries was profitable over the last five years but held back by its large cost base. Its average operating margin of 6.1% was weak for an industrials business. This result isn’t too surprising given its low gross margin as a starting point.
Looking at the trend in its profitability, THOR Industries’s operating margin decreased by 4 percentage points over the last five years. This raises questions about the company’s expense base because its revenue growth should have given it leverage on its fixed costs, resulting in better economies of scale and profitability. THOR Industries’s performance was poor no matter how you look at it - it shows that costs were rising and it couldn’t pass them onto its customers.
8. Earnings Per Share
Revenue trends explain a company’s historical growth, but the long-term change in earnings per share (EPS) points to the profitability of that growth – for example, a company could inflate its sales through excessive spending on advertising and promotions.
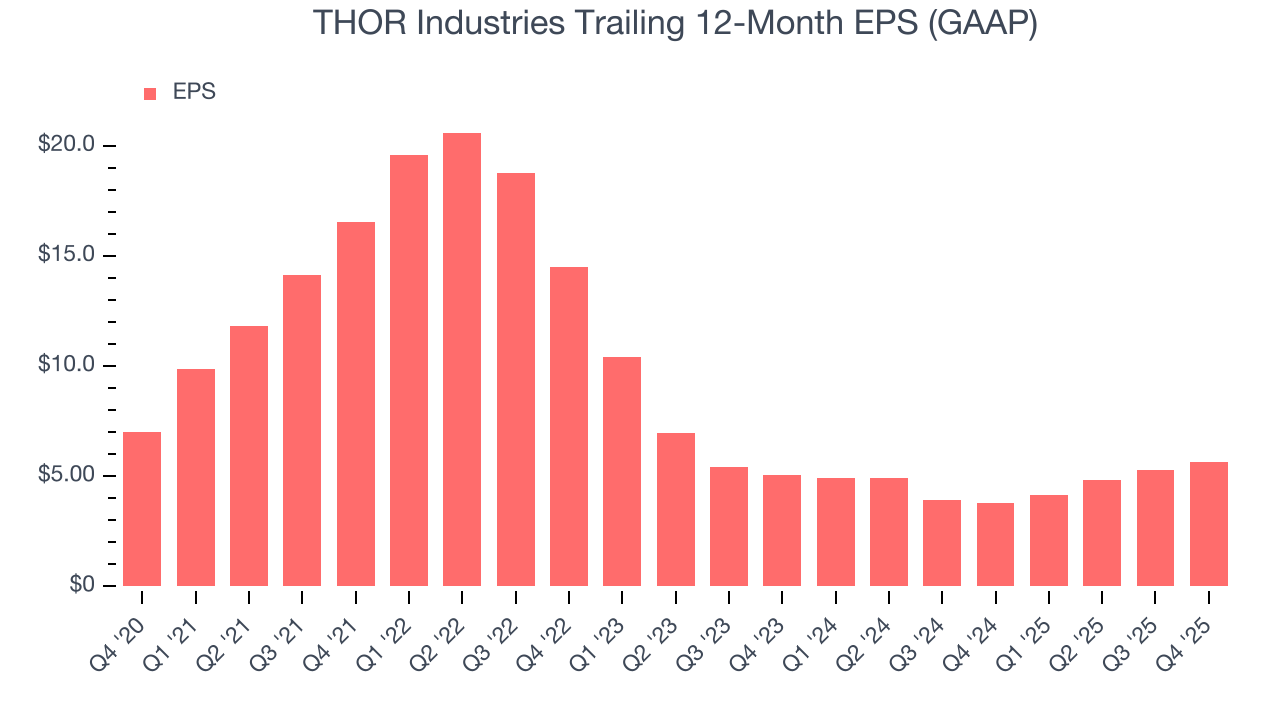
Sadly for THOR Industries, its EPS declined by 4.3% annually over the last five years while its revenue grew by 1.4%. This tells us the company became less profitable on a per-share basis as it expanded due to non-fundamental factors such as interest expenses and taxes.
We can take a deeper look into THOR Industries’s earnings to better understand the drivers of its performance. As we mentioned earlier, THOR Industries’s operating margin declined by 4 percentage points over the last five years. This was the most relevant factor (aside from the revenue impact) behind its lower earnings; interest expenses and taxes can also affect EPS but don’t tell us as much about a company’s fundamentals.
Like with revenue, we analyze EPS over a shorter period to see if we are missing a change in the business.
Although it wasn’t great, THOR Industries’s two-year annual EPS growth of 5.7% topped its two-year revenue performance.
In Q4, THOR Industries reported EPS of $0.34, up from negative $0.01 in the same quarter last year. This print easily cleared analysts’ estimates, and shareholders should be content with the results. Over the next 12 months, Wall Street expects THOR Industries’s full-year EPS of $5.64 to shrink by 16.8%.
9. Cash Is King
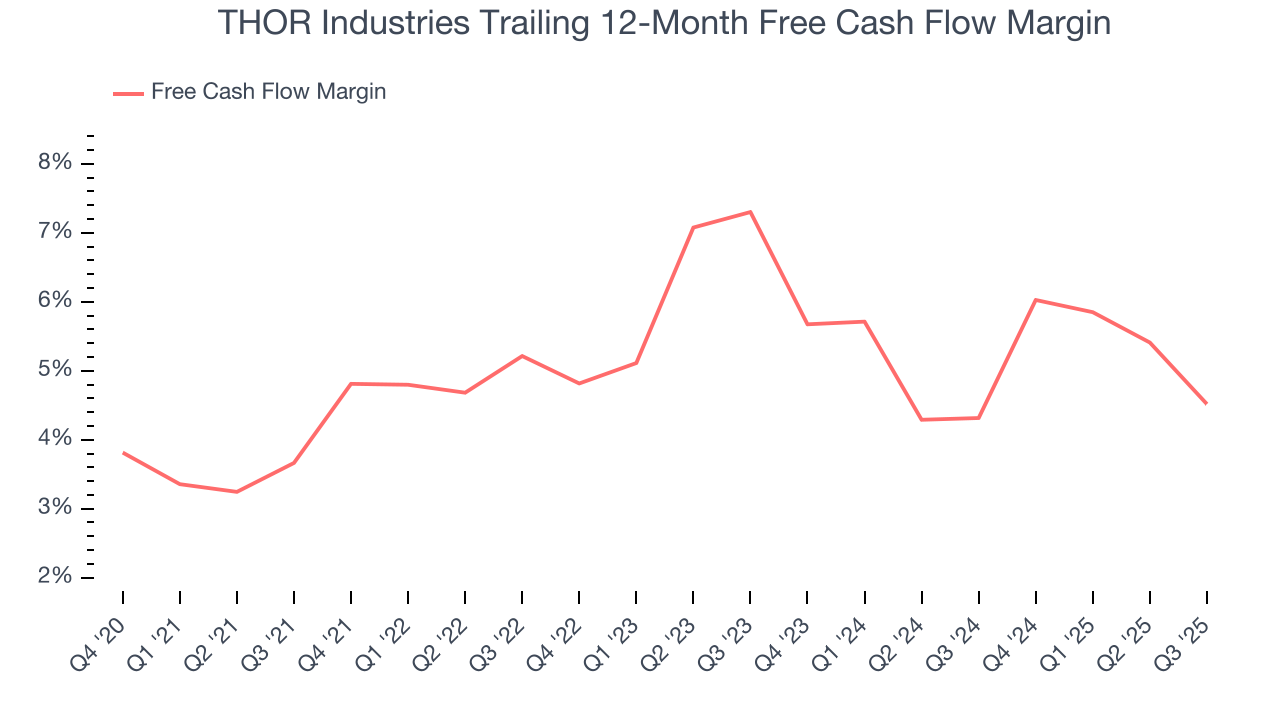
Free cash flow isn't a prominently featured metric in company financials and earnings releases, but we think it's telling because it accounts for all operating and capital expenses, making it tough to manipulate. Cash is king.
THOR Industries has shown mediocre cash profitability over the last five years, giving the company limited opportunities to return capital to shareholders. Its free cash flow margin averaged 5.3%, subpar for an industrials business.
10. Return on Invested Capital (ROIC)
EPS and free cash flow tell us whether a company was profitable while growing its revenue. But was it capital-efficient? Enter ROIC, a metric showing how much operating profit a company generates relative to the money it has raised (debt and equity).
Although THOR Industries hasn’t been the highest-quality company lately because of its poor revenue and EPS performance, it historically found a few growth initiatives that worked. Its five-year average ROIC was 12.8%, higher than most industrials businesses.
We like to invest in businesses with high returns, but the trend in a company’s ROIC is what often surprises the market and moves the stock price. Unfortunately, THOR Industries’s ROIC has decreased significantly over the last few years. We like what management has done in the past, but its declining returns are perhaps a symptom of fewer profitable growth opportunities.
11. Key Takeaways from THOR Industries’s Q4 Results
It was good to see THOR Industries beat analysts’ EPS expectations this quarter. We were also excited its EBITDA outperformed Wall Street’s estimates by a wide margin. On the other hand, its full-year revenue guidance missed and its full-year EPS guidance fell short of Wall Street’s estimates. Zooming out, we think this was a mixed quarter. The stock remained flat at $95.24 immediately following the results.
12. Is Now The Time To Buy THOR Industries?
We think that the latest earnings result is only one piece of the bigger puzzle. If you’re deciding whether to own THOR Industries, you should also grasp the company’s longer-term business quality and valuation.
THOR Industries falls short of our quality standards. First off, its revenue growth was weak over the last five years, and analysts expect its demand to deteriorate over the next 12 months. While its solid ROIC suggests it has grown profitably in the past, the downside is its diminishing returns show management's prior bets haven't worked out. On top of that, its projected EPS for the next year is lacking.
THOR Industries’s P/E ratio based on the next 12 months is 20.3x. This valuation is reasonable, but the company’s shaky fundamentals present too much downside risk. There are better stocks to buy right now.
Wall Street analysts have a consensus one-year price target of $113.42 on the company (compared to the current share price of $95.24).
Although the price target is bullish, readers should exercise caution because analysts tend to be overly optimistic. The firms they work for, often big banks, have relationships with companies that extend into fundraising, M&A advisory, and other rewarding business lines. As a result, they typically hesitate to say bad things for fear they will lose out. We at StockStory do not suffer from such conflicts of interest, so we’ll always tell it like it is.