
Tennant (TNC)
We wouldn’t buy Tennant. Its weak sales growth and declining returns on capital show its demand and profits are shrinking.― StockStory Analyst Team
1. News


2. Summary
Why We Think Tennant Will Underperform
As the world’s largest manufacturer of autonomous mobile robots, Tennant (NYSE:TNC) designs, manufactures, and sells cleaning products to various sectors.
- Annual sales declines of 1.6% for the past two years show its products and services struggled to connect with the market during this cycle
- Sales were less profitable over the last two years as its earnings per share fell by 16.8% annually, worse than its revenue declines
- Anticipated sales growth of 4.7% for the next year implies demand will be shaky


Tennant doesn’t pass our quality test. We see more lucrative opportunities elsewhere.
Why There Are Better Opportunities Than Tennant


Tennant is trading at $61.48 per share, or 12.4x forward P/E. This multiple is lower than most industrials companies, but for good reason.
Our advice is to pay up for elite businesses whose advantages are tailwinds to earnings growth. Don’t get sucked into lower-quality businesses just because they seem like bargains. These mediocre businesses often never achieve a higher multiple as hoped, a phenomenon known as a “value trap”.
3. Tennant (TNC) Research Report: Q4 CY2025 Update
Industrial cleaning equipment manufacturer Tennant Company missed Wall Street’s revenue expectations in Q4 CY2025, with sales falling 11.3% year on year to $291.6 million. The company’s full-year revenue guidance of $1.26 billion at the midpoint came in 3.4% below analysts’ estimates. Its non-GAAP profit of $0.48 per share was 71.7% below analysts’ consensus estimates.
Tennant (TNC) Q4 CY2025 Highlights:
- Revenue: $291.6 million vs analyst estimates of $320.5 million (11.3% year-on-year decline, 9% miss)
- Adjusted EPS: $0.48 vs analyst expectations of $1.70 (71.7% miss)
- Adjusted EBITDA: $25.6 million vs analyst estimates of $47.8 million (8.8% margin, 46.4% miss)
- Adjusted EPS guidance for the upcoming financial year 2026 is $5 at the midpoint, missing analyst estimates by 25%
- EBITDA guidance for the upcoming financial year 2026 is $182.5 million at the midpoint, below analyst estimates of $198.9 million
- Operating Margin: -1.4%, down from 4.6% in the same quarter last year
- Free Cash Flow Margin: 3.3%, down from 8.5% in the same quarter last year
- Market Capitalization: $1.49 billion
Company Overview
As the world’s largest manufacturer of autonomous mobile robots, Tennant (NYSE:TNC) designs, manufactures, and sells cleaning products to various sectors.
Tennant, headquartered in Eden Prairie, Minnesota, is a global leader in designing, manufacturing, and marketing solutions for creating cleaner, safer, and healthier environments.
Founded in 1870 by George H. Tennant, the company has evolved from a one-man woodworking business into a prominent manufacturer of floor cleaning equipment and sustainable cleaning technologies. Tennant operates with a presence in the Americas, Europe, Middle East and Africa (EMEA), and Asia Pacific (APAC) regions. The company's primary focus is on developing and providing cleaning solutions for non-residential surfaces. Tennant's product portfolio includes manual and mechanized cleaning equipment, detergent-free cleaning technologies, aftermarket parts, and consumables as well as equipment maintenance and repair services.
The company serves a customer base of factories, warehouses, distribution centers, office buildings, public venues, schools, universities, hospitals, and clinics. Tennant markets its products under several brands, including Tennant, Nobles, Alfa Uma Empresa Tennant, IPC, Gaomei, and Rongen, as well as private-label brands.
Tennant generates income through direct sales to end-users, as well as through its extensive network of authorized distributors worldwide. Additionally, Tennant offers various business solutions, including financing, rental, and leasing programs, which provide alternative revenue streams and help customers manage their equipment needs more flexibly. The company also derives revenue from its aftermarket parts and consumables business, which supplies customers with the necessary components to maintain and operate their Tennant equipment.
4. Water Infrastructure
Trends towards conservation and reducing groundwater depletion are putting water infrastructure and treatment products front and center. Companies that can innovate and create solutions–especially automated or connected solutions–to address these thematic trends will create incremental demand and speed up replacement cycles. On the other hand, water infrastructure and treatment companies are at the whim of economic cycles. Consumer spending and interest rates, for example, can greatly impact the industrial production that drives demand for these companies’ offerings.
Competitors offering similar products include Standex (NYSE:SXI), Middleby (NASDAQ:MIDD), and Enerpac (NYSE:EPAC).
5. Revenue Growth
A company’s long-term sales performance can indicate its overall quality. Even a bad business can shine for one or two quarters, but a top-tier one grows for years. Unfortunately, Tennant’s 3.8% annualized revenue growth over the last five years was sluggish. This was below our standard for the industrials sector and is a rough starting point for our analysis.
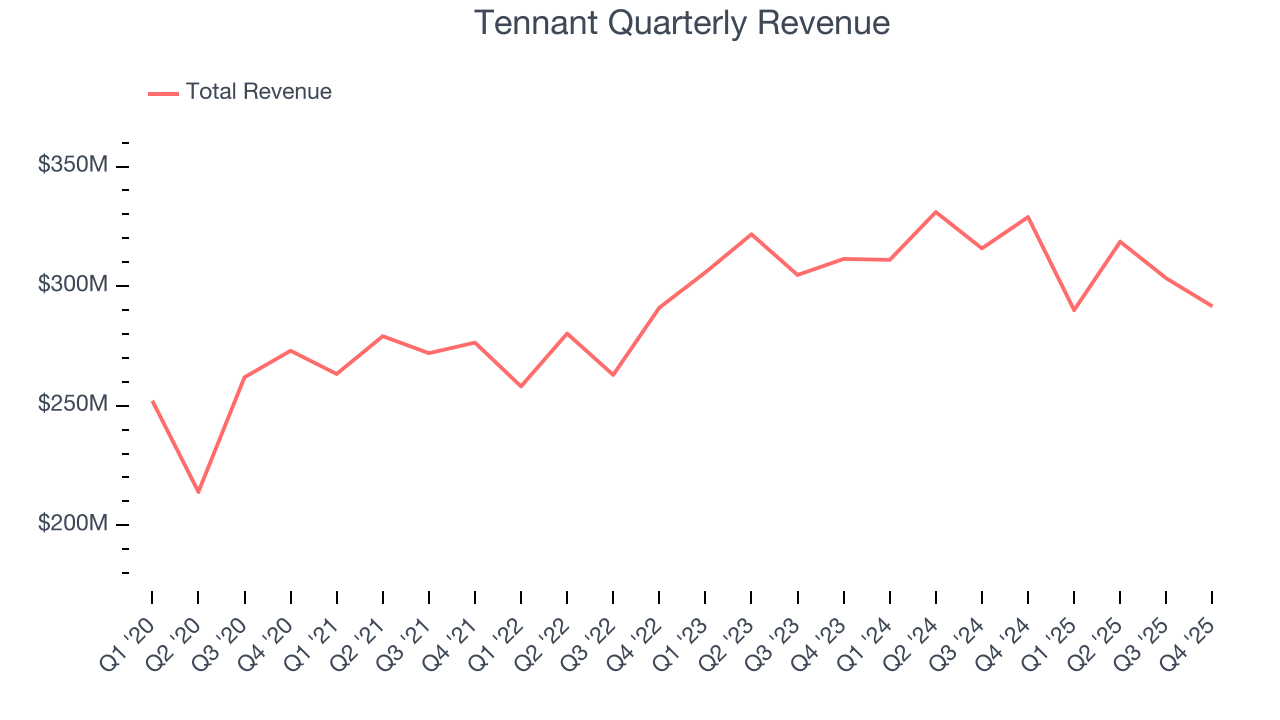
Long-term growth is the most important, but within industrials, a half-decade historical view may miss new industry trends or demand cycles. Tennant’s performance shows it grew in the past but relinquished its gains over the last two years, as its revenue fell by 1.6% annually. 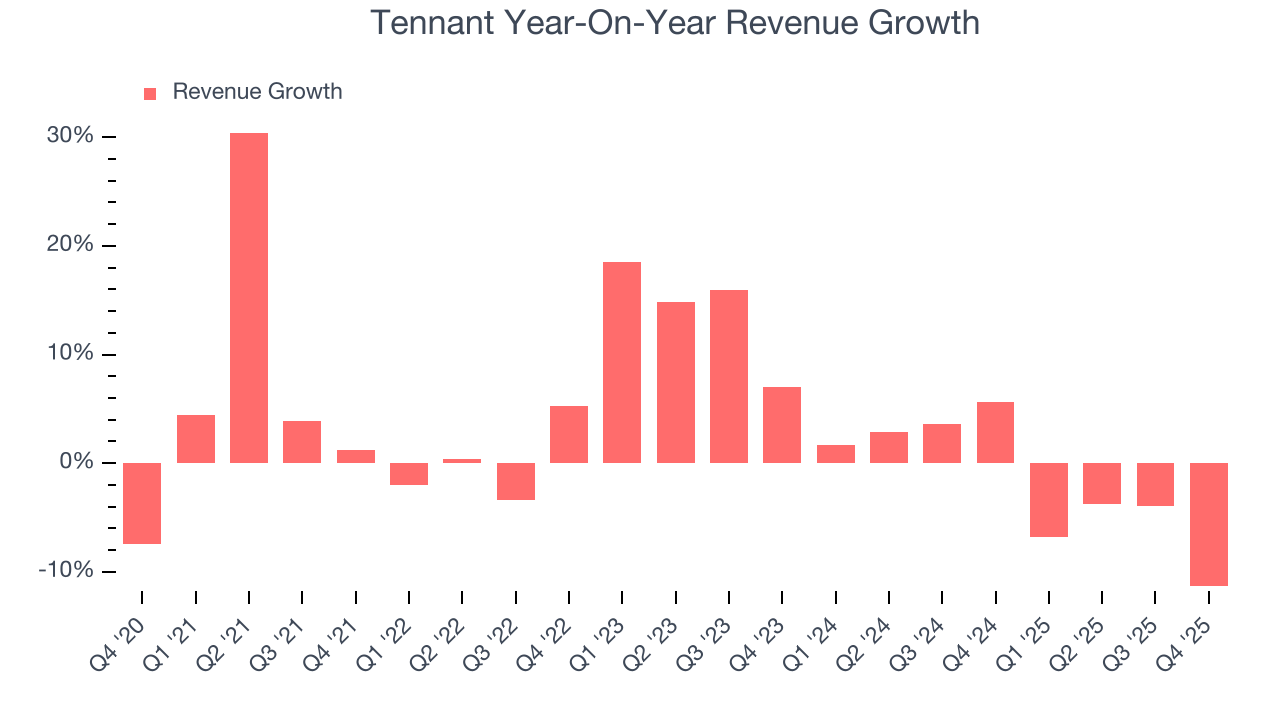
This quarter, Tennant missed Wall Street’s estimates and reported a rather uninspiring 11.3% year-on-year revenue decline, generating $291.6 million of revenue.
Looking ahead, sell-side analysts expect revenue to grow 8.4% over the next 12 months, an improvement versus the last two years. This projection is above average for the sector and implies its newer products and services will catalyze better top-line performance.
6. Gross Margin & Pricing Power
Tennant’s unit economics are great compared to the broader industrials sector and signal that it enjoys product differentiation through quality or brand. As you can see below, it averaged an excellent 41% gross margin over the last five years. Said differently, roughly $40.96 was left to spend on selling, marketing, R&D, and general administrative overhead for every $100 in revenue. 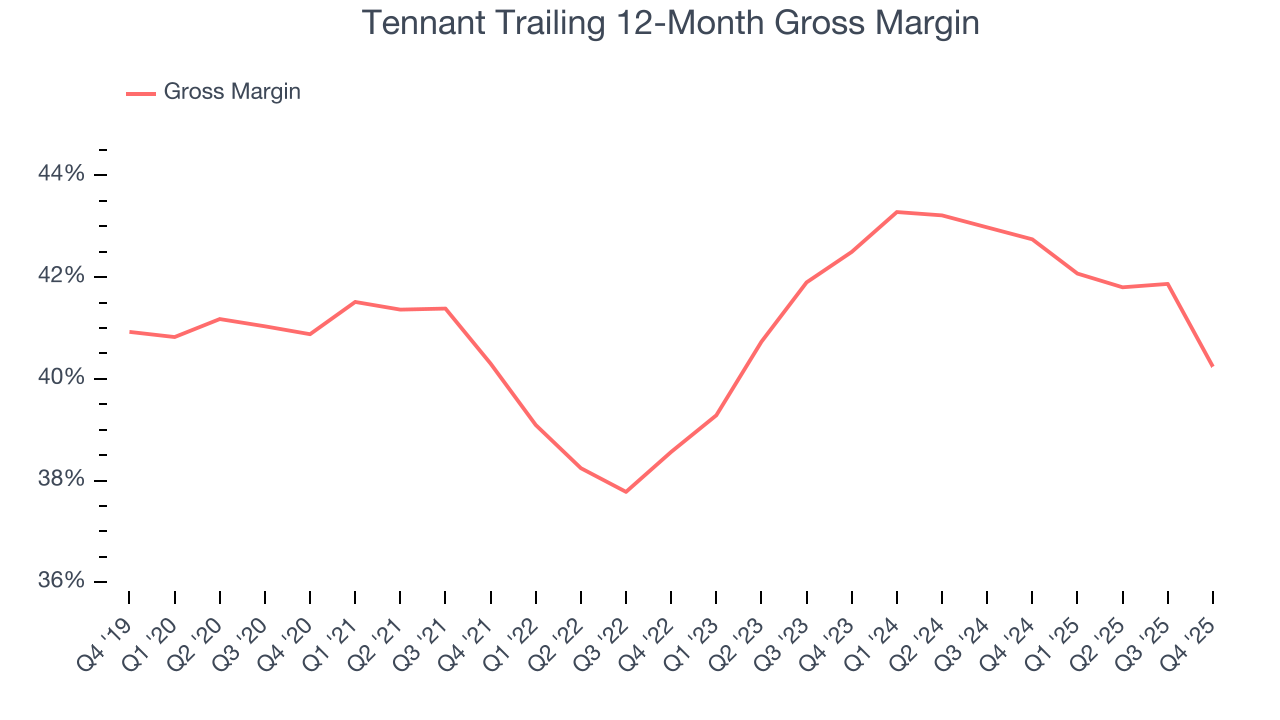
Tennant produced a 34.6% gross profit margin in Q4, down 6.8 percentage points year on year. Tennant’s full-year margin has also been trending down over the past 12 months, decreasing by 2.5 percentage points. If this move continues, it could suggest a more competitive environment with some pressure to lower prices and higher input costs (such as raw materials and manufacturing expenses).
7. Operating Margin
Tennant has done a decent job managing its cost base over the last five years. The company has produced an average operating margin of 8.7%, higher than the broader industrials sector.
Looking at the trend in its profitability, Tennant’s operating margin decreased by 2.6 percentage points over the last five years. This raises questions about the company’s expense base because its revenue growth should have given it leverage on its fixed costs, resulting in better economies of scale and profitability.
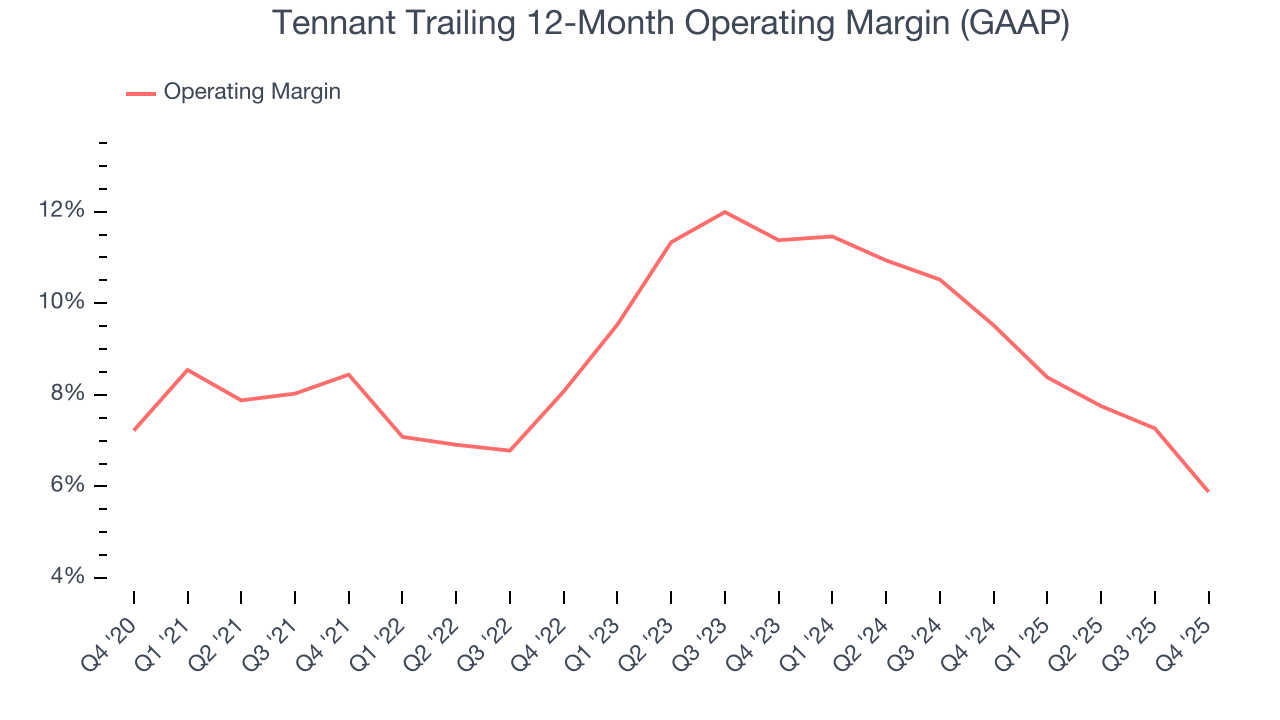
In Q4, Tennant generated an operating margin profit margin of negative 1.4%, down 6.1 percentage points year on year. Since Tennant’s gross margin decreased more than its operating margin, we can assume its recent inefficiencies were driven more by weaker leverage on its cost of sales rather than increased marketing, R&D, and administrative overhead expenses.
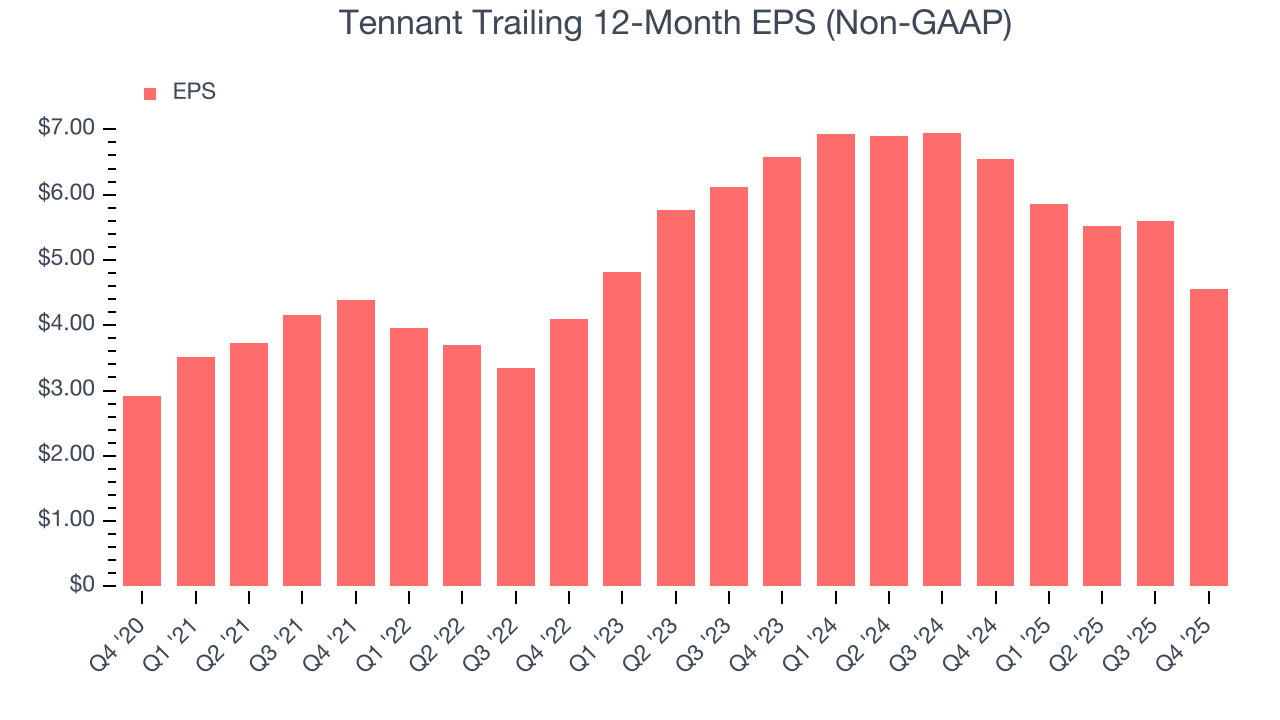
8. Earnings Per Share
We track the long-term change in earnings per share (EPS) for the same reason as long-term revenue growth. Compared to revenue, however, EPS highlights whether a company’s growth is profitable.
Tennant’s EPS grew at a decent 9.4% compounded annual growth rate over the last five years, higher than its 3.8% annualized revenue growth. However, this alone doesn’t tell us much about its business quality because its operating margin didn’t improve.
Diving into the nuances of Tennant’s earnings can give us a better understanding of its performance. A five-year view shows that Tennant has repurchased its stock, shrinking its share count by 2.6%. This tells us its EPS outperformed its revenue not because of increased operational efficiency but financial engineering, as buybacks boost per share earnings. 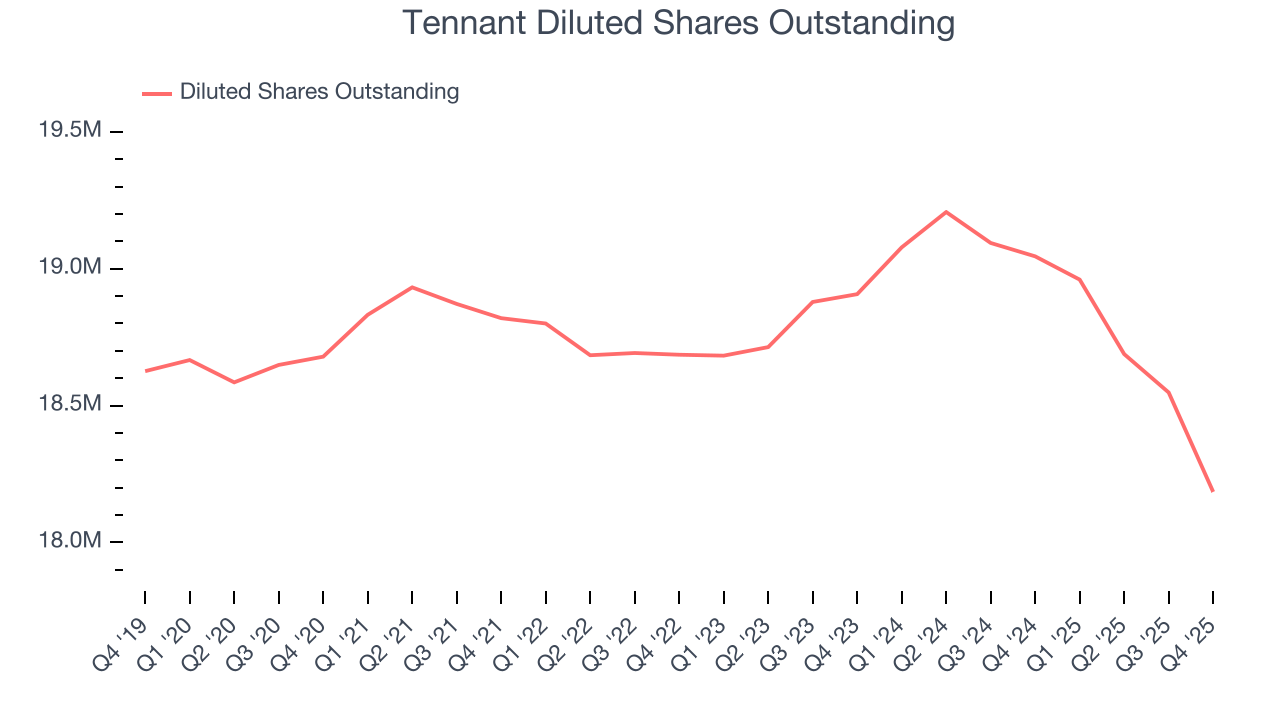
Like with revenue, we analyze EPS over a more recent period because it can provide insight into an emerging theme or development for the business.
For Tennant, its two-year annual EPS declines of 16.8% mark a reversal from its five-year trend. We hope Tennant can return to earnings growth in the future.
In Q4, Tennant reported adjusted EPS of $0.48, down from $1.52 in the same quarter last year. This print missed analysts’ estimates, but we care more about long-term adjusted EPS growth than short-term movements. Over the next 12 months, Wall Street expects Tennant’s full-year EPS of $4.55 to grow 46.7%.
9. Cash Is King
Although earnings are undoubtedly valuable for assessing company performance, we believe cash is king because you can’t use accounting profits to pay the bills.
Tennant has shown weak cash profitability over the last five years, giving the company limited opportunities to return capital to shareholders. Its free cash flow margin averaged 4.5%, subpar for an industrials business.
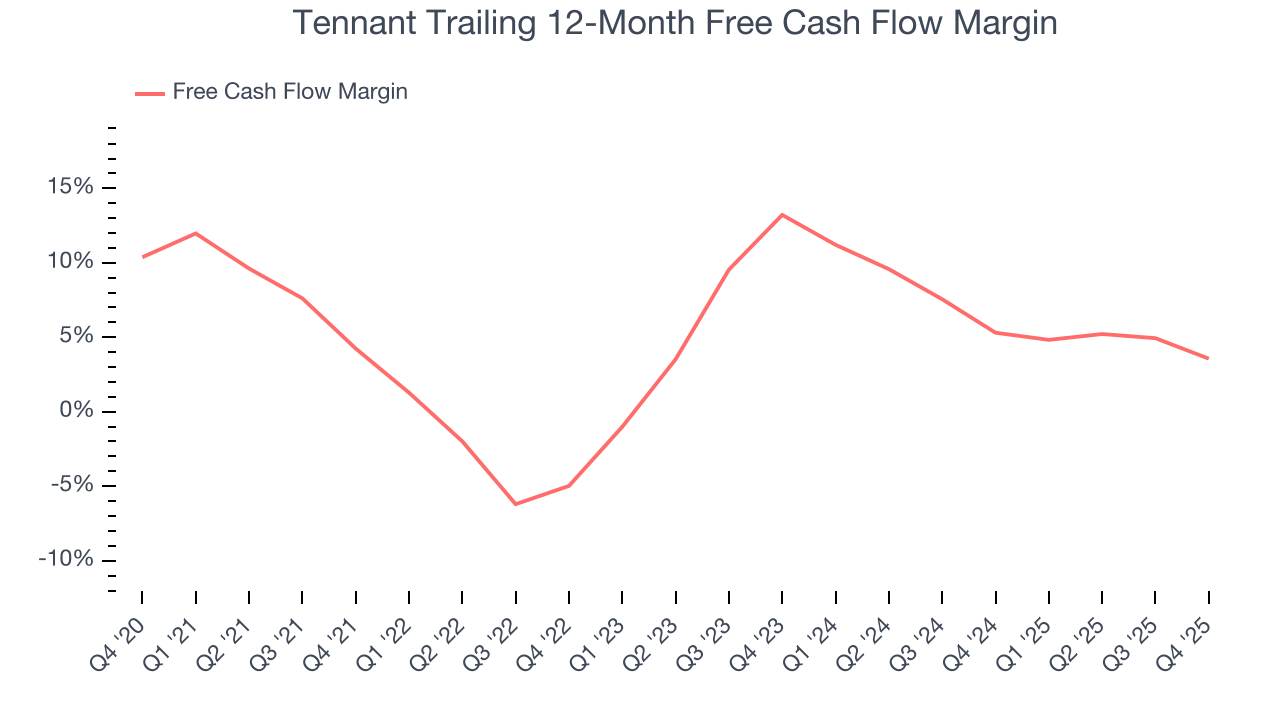
Tennant’s free cash flow clocked in at $9.6 million in Q4, equivalent to a 3.3% margin. The company’s cash profitability regressed as it was 5.2 percentage points lower than in the same quarter last year, prompting us to pay closer attention. Short-term fluctuations typically aren’t a big deal because investment needs can be seasonal, but we’ll be watching to see if the trend extrapolates into future quarters.
10. Return on Invested Capital (ROIC)
EPS and free cash flow tell us whether a company was profitable while growing its revenue. But was it capital-efficient? A company’s ROIC explains this by showing how much operating profit it makes compared to the money it has raised (debt and equity).
Although Tennant hasn’t been the highest-quality company lately because of its poor top-line performance, it historically found a few growth initiatives that worked. Its five-year average ROIC was 13%, higher than most industrials businesses.
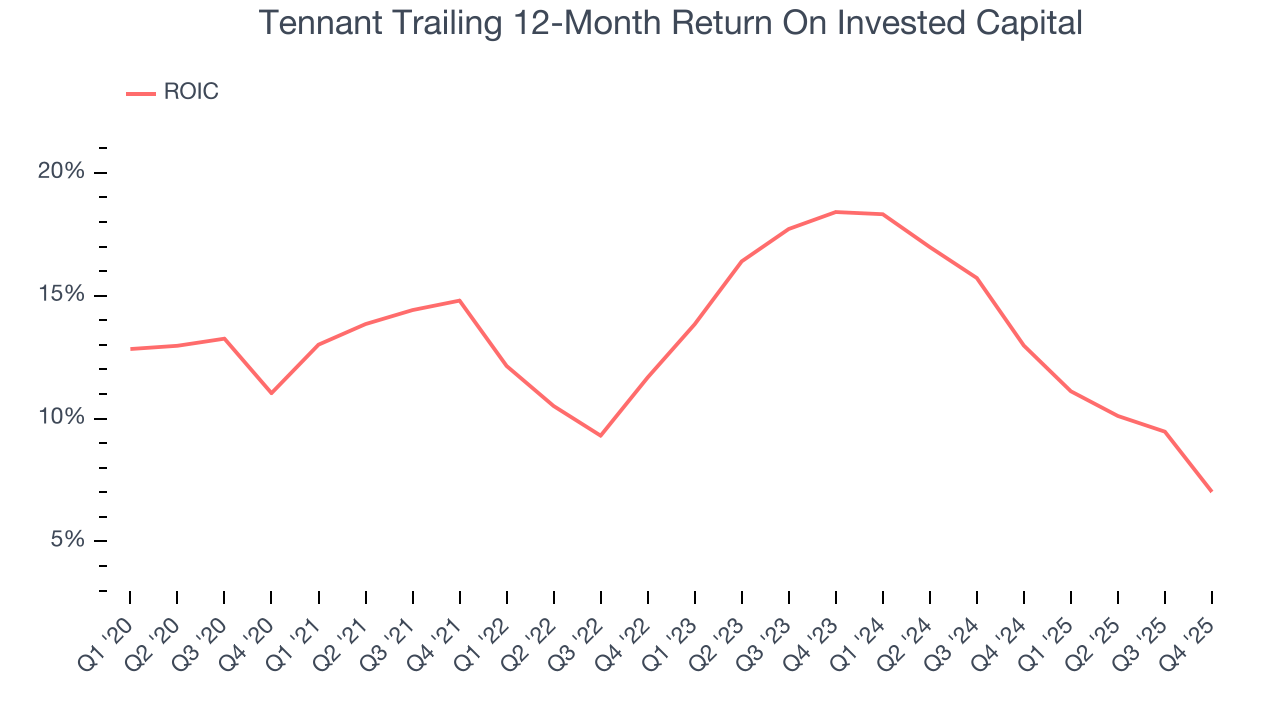
We like to invest in businesses with high returns, but the trend in a company’s ROIC is what often surprises the market and moves the stock price. Unfortunately, Tennant’s ROIC averaged 3.2 percentage point decreases each year over the last few years. We like what management has done in the past, but its declining returns are perhaps a symptom of fewer profitable growth opportunities.
11. Balance Sheet Assessment
Tennant reported $106.4 million of cash and $309.1 million of debt on its balance sheet in the most recent quarter. As investors in high-quality companies, we primarily focus on two things: 1) that a company’s debt level isn’t too high and 2) that its interest payments are not excessively burdening the business.
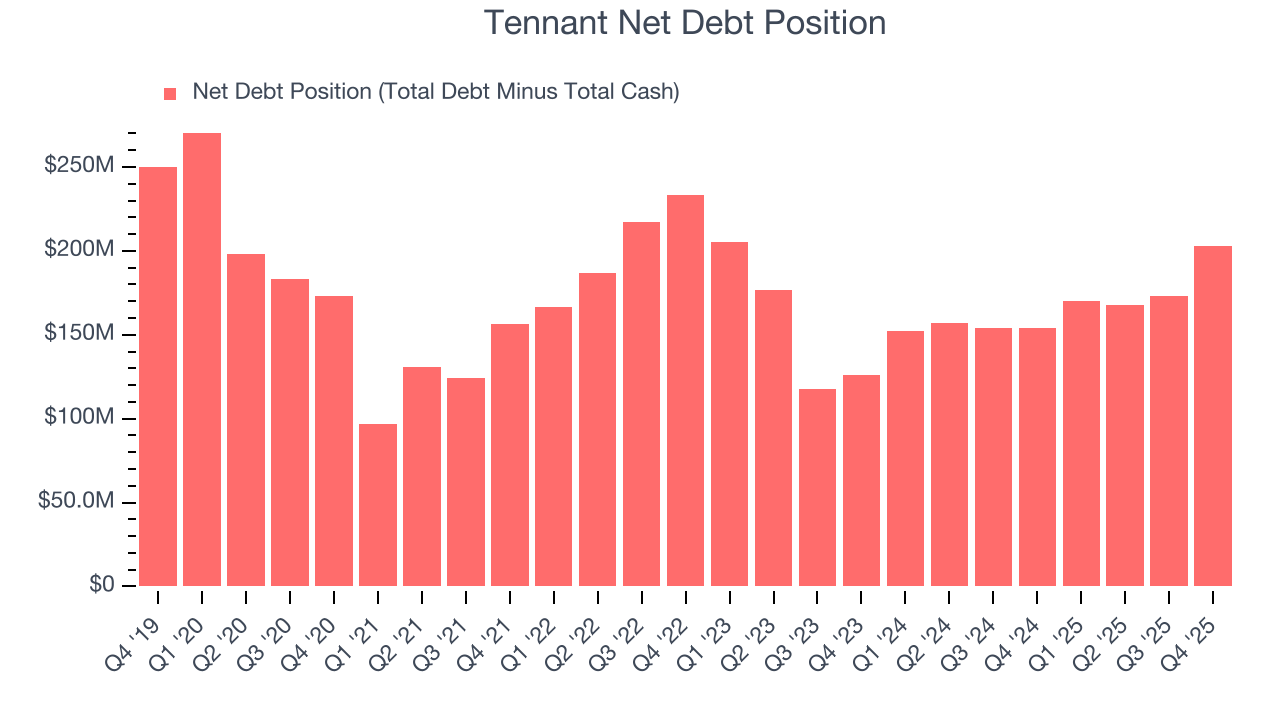
With $167.4 million of EBITDA over the last 12 months, we view Tennant’s 1.2× net-debt-to-EBITDA ratio as safe. We also see its $9 million of annual interest expenses as appropriate. The company’s profits give it plenty of breathing room, allowing it to continue investing in growth initiatives.
12. Key Takeaways from Tennant’s Q4 Results
We struggled to find many positives in these results. Its full-year revenue guidance missed and its full-year EBITDA guidance fell short of Wall Street’s estimates. Overall, this was a softer quarter. The stock traded down 24.8% to $61.92 immediately following the results.
13. Is Now The Time To Buy Tennant?
Updated: March 8, 2026 at 11:42 PM EDT
The latest quarterly earnings matters, sure, but we actually think longer-term fundamentals and valuation matter more. Investors should consider all these pieces before deciding whether or not to invest in Tennant.
Tennant doesn’t pass our quality test. First off, its revenue growth was uninspiring over the last five years, and analysts don’t see anything changing over the next 12 months. While its healthy gross margins indicate the value of its differentiated offerings, the downside is its diminishing returns show management's prior bets haven't worked out. On top of that, its declining operating margin shows the business has become less efficient.
Tennant’s P/E ratio based on the next 12 months is 12.4x. This valuation multiple is fair, but we don’t have much confidence in the company. There are better investments elsewhere.
Wall Street analysts have a consensus one-year price target of $83.75 on the company (compared to the current share price of $61.48).
Although the price target is bullish, readers should exercise caution because analysts tend to be overly optimistic. The firms they work for, often big banks, have relationships with companies that extend into fundraising, M&A advisory, and other rewarding business lines. As a result, they typically hesitate to say bad things for fear they will lose out. We at StockStory do not suffer from such conflicts of interest, so we’ll always tell it like it is.