Under Armour (UAA)
Under Armour keeps us up at night. Its weak sales growth and low returns on capital show it struggled to generate demand and profits.― StockStory Analyst Team
1. News


2. Summary
Why We Think Under Armour Will Underperform
Founded in 1996 by a former University of Maryland football player, Under Armour (NYSE:UAA) is an apparel brand specializing in sportswear designed to improve athletic performance.
- Sales trends were unexciting over the last five years as its 2.1% annual growth was below the typical consumer discretionary company
- Historical operating margin losses point to an inefficient cost structure
- 6× net-debt-to-EBITDA ratio makes lenders less willing to extend additional capital, potentially necessitating dilutive equity offerings


Under Armour lacks the business quality we seek. There are more appealing investments to be made.
Why There Are Better Opportunities Than Under Armour


Under Armour’s stock price of $5.76 implies a valuation ratio of 32.3x forward P/E. Not only does Under Armour trade at a premium to companies in the consumer discretionary space, but this multiple is also high for its top-line growth.
We prefer to invest in similarly-priced but higher-quality companies with superior earnings growth.
3. Under Armour (UAA) Research Report: Q4 CY2025 Update
Athletic apparel company Under Armour (NYSE:UAA) reported Q4 CY2025 results beating Wall Street’s revenue expectations, but sales fell by 5.2% year on year to $1.33 billion. Its non-GAAP profit of $0.09 per share was significantly above analysts’ consensus estimates.
Under Armour (UAA) Q4 CY2025 Highlights:
- Revenue: $1.33 billion vs analyst estimates of $1.31 billion (5.2% year-on-year decline, 1.2% beat)
- Adjusted EPS: $0.09 vs analyst estimates of -$0.01 (significant beat)
- Adjusted EBITDA: -$122.5 million vs analyst estimates of $34.03 million (-9.2% margin, significant miss)
- Management raised its full-year Adjusted EPS guidance to $0.11 at the midpoint, a 163% increase
- Operating Margin: -11.3%, down from 1% in the same quarter last year
- Free Cash Flow Margin: 19.7%, similar to the same quarter last year
- Constant Currency Revenue fell 6% year on year, in line with the same quarter last year
- Market Capitalization: $2.64 billion
Company Overview
Founded in 1996 by a former University of Maryland football player, Under Armour (NYSE:UAA) is an apparel brand specializing in sportswear designed to improve athletic performance.
Under Armour gained popularity through its moisture-wicking synthetic fabric, a revolutionary technology at the time, designed to keep athletes cool and dry during exercise. This set the company apart in its early days and remains a cornerstone of its product lines. The brand has since expanded its offerings to include compression wear, performance footwear, and sports accessories.
The company invests in research and development to enhance its products. This has led to the introduction of fabrics including "HeatGear" and "ColdGear", which regulate body temperature. The company has also created online fitness platforms and smart gear that integrate digital technology into workout apparel.
Under Armour’s marketing strategy has been an important part of the business. The brand has forged partnerships with high-profile athletes and teams across various sports, leveraging these relationships to enhance its visibility and appeal. Additionally, Under Armour's marketing campaigns often focus on the determination and grit of athletes, resonating with consumers who are passionate about fitness and sports.
4. Apparel and Accessories
Thanks to social media and the internet, not only are styles changing more frequently today than in decades past but also consumers are shifting the way they buy their goods, favoring omnichannel and e-commerce experiences. Some apparel and accessories companies have made concerted efforts to adapt while those who are slower to move may fall behind.
Under Armour's primary competitors include Nike (NYSE:NKE), Lululemon (NASDAQ:LULU), Columbia Sportswear (NASDAQ:COLM), Adidas (ETR:ADS), and Puma (ETR:PUM).
5. Revenue Growth
A company’s long-term sales performance can indicate its overall quality. Any business can put up a good quarter or two, but many enduring ones grow for years. Regrettably, Under Armour’s sales grew at a weak 2.1% compounded annual growth rate over the last five years. This fell short of our benchmarks and is a poor baseline for our analysis.
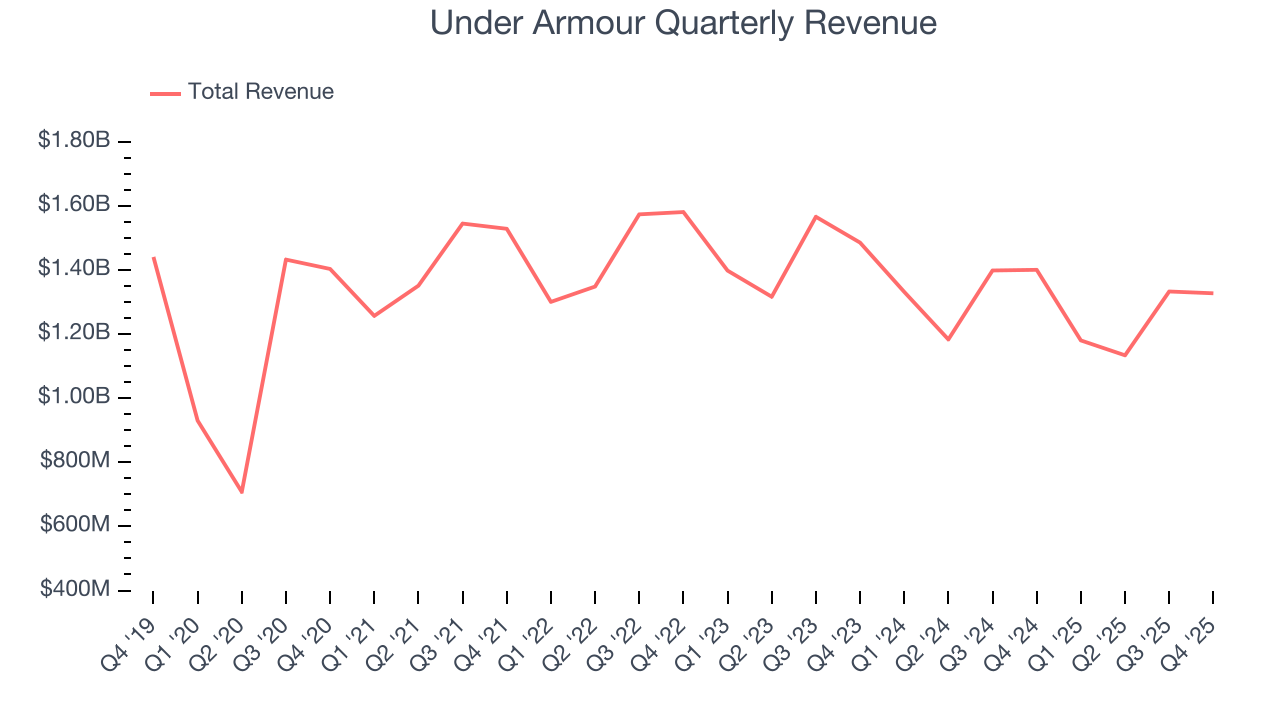
We at StockStory place the most emphasis on long-term growth, but within consumer discretionary, a stretched historical view may miss a company riding a successful new product or trend. Under Armour’s performance shows it grew in the past but relinquished its gains over the last two years, as its revenue fell by 7.1% annually. 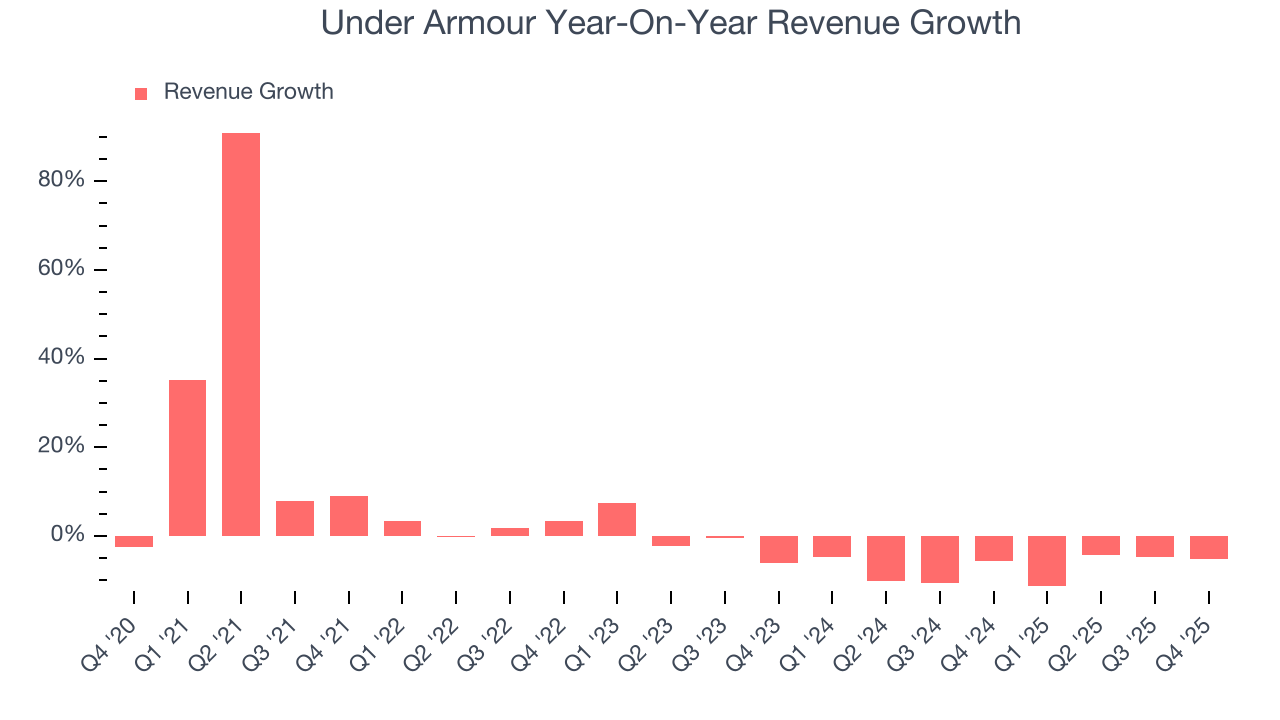
Under Armour also reports sales performance excluding currency movements, which are outside the company’s control and not indicative of demand. Over the last two years, its constant currency sales averaged 4.6% year-on-year declines. Because this number is better than its normal revenue growth, we can see that foreign exchange rates have been a headwind for Under Armour. 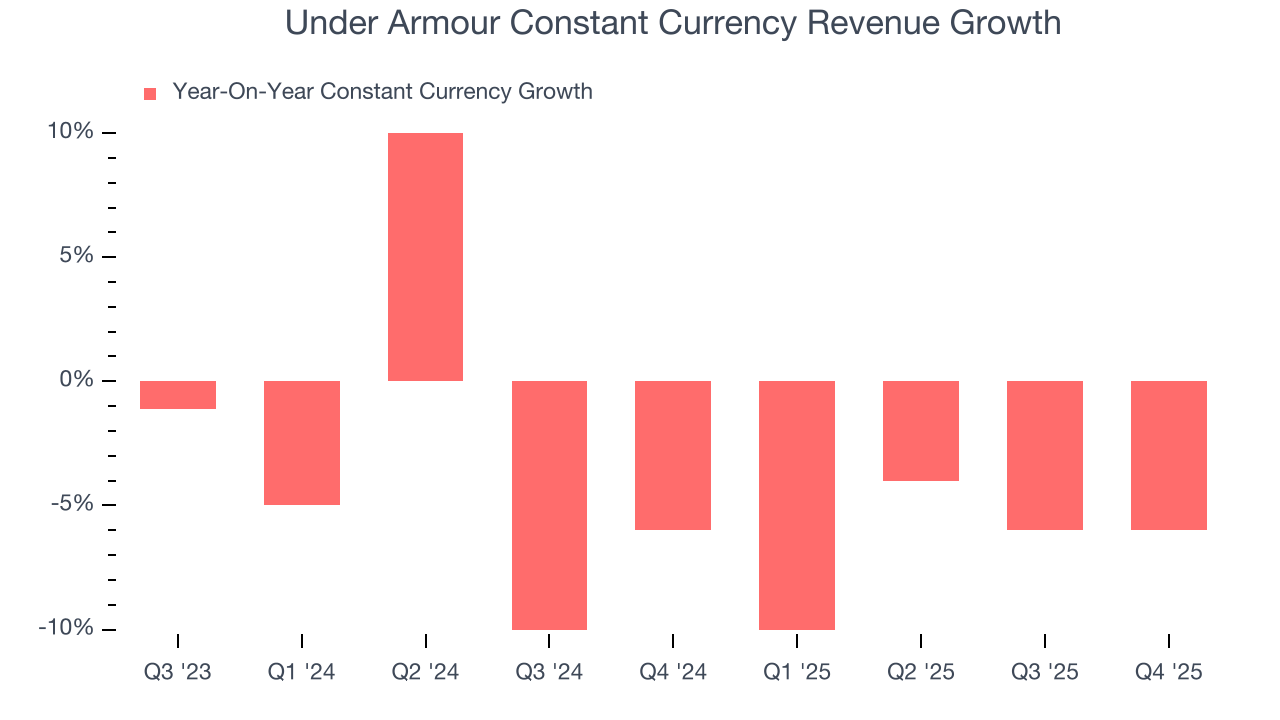
This quarter, Under Armour’s revenue fell by 5.2% year on year to $1.33 billion but beat Wall Street’s estimates by 1.2%.
Looking ahead, sell-side analysts expect revenue to remain flat over the next 12 months. While this projection implies its newer products and services will fuel better top-line performance, it is still below average for the sector.
6. Operating Margin
Under Armour’s operating margin has been trending down over the last 12 months and averaged negative 3.1% over the last two years. Unprofitable consumer discretionary companies with falling margins deserve extra scrutiny because they’re spending loads of money to stay relevant, an unsustainable practice.
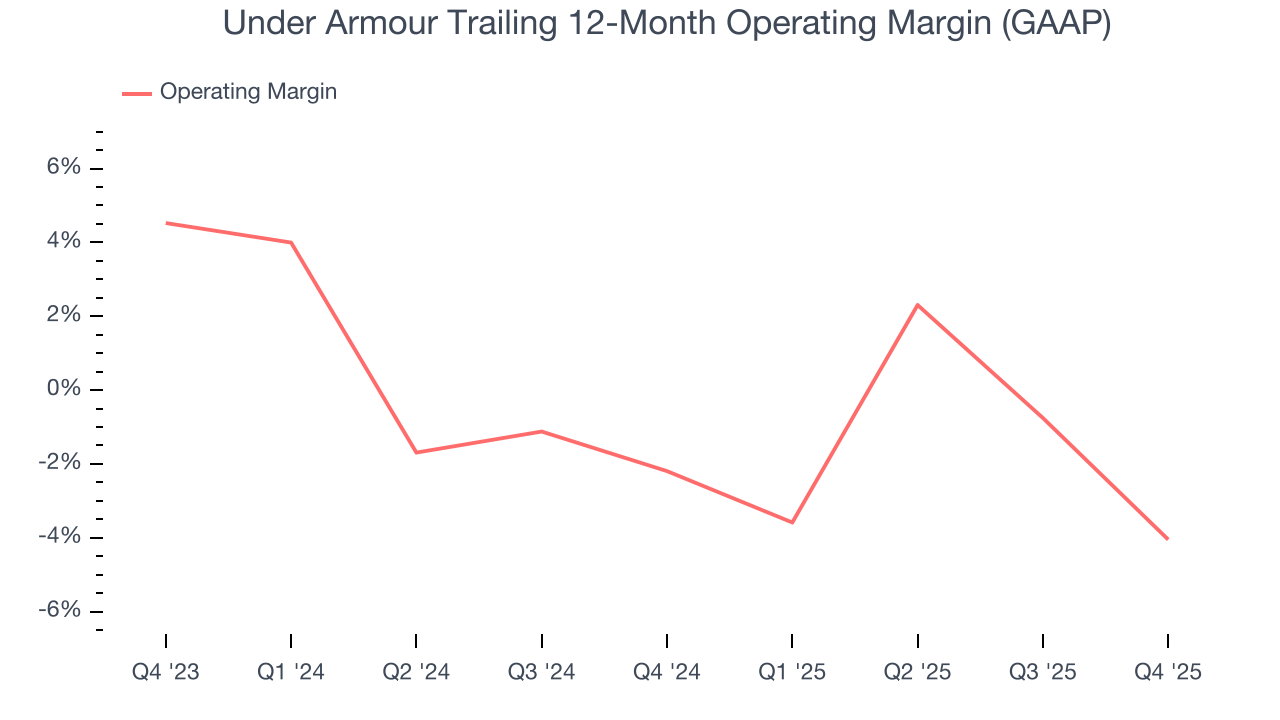
Under Armour’s operating margin was negative 11.3% this quarter. The company's consistent lack of profits raise a flag.
7. Earnings Per Share
Revenue trends explain a company’s historical growth, but the long-term change in earnings per share (EPS) points to the profitability of that growth – for example, a company could inflate its sales through excessive spending on advertising and promotions.
Under Armour’s full-year EPS flipped from negative to positive over the last five years. This is encouraging and shows it’s at a critical moment in its life.
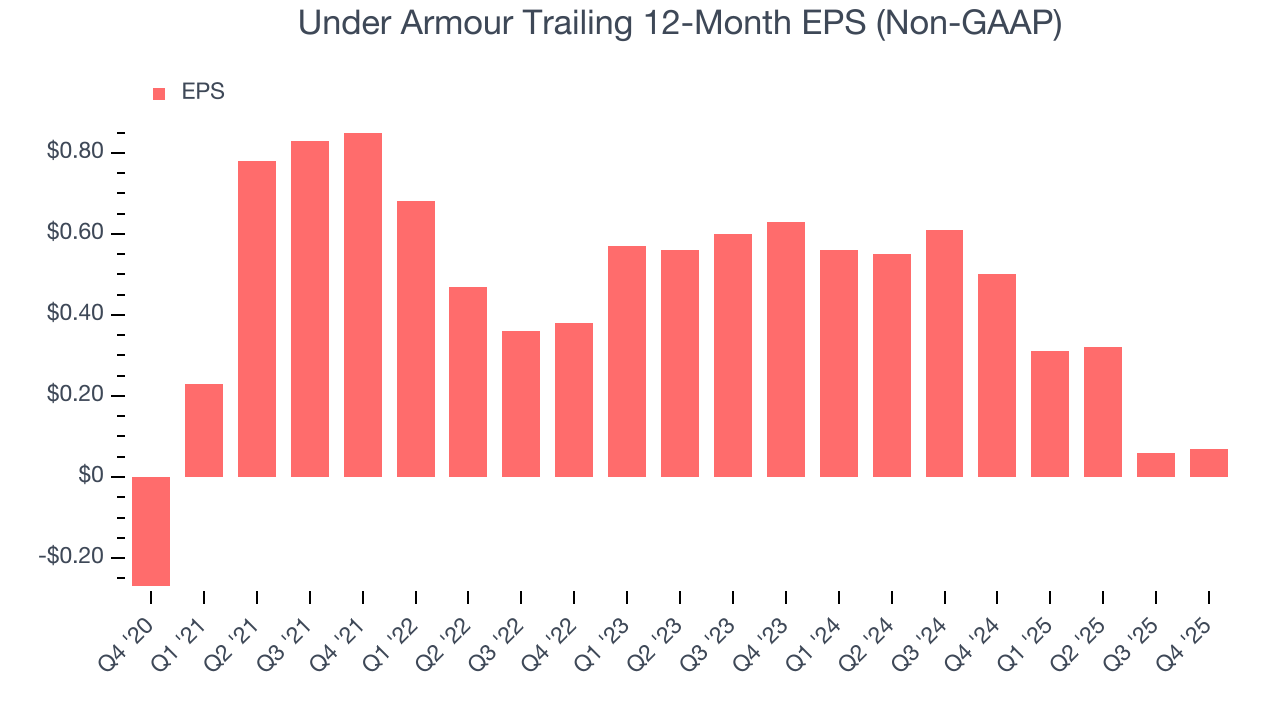
In Q4, Under Armour reported adjusted EPS of $0.09, up from $0.08 in the same quarter last year. This print easily cleared analysts’ estimates, and shareholders should be content with the results. Over the next 12 months, Wall Street expects Under Armour’s full-year EPS of $0.07 to grow 161%.
8. Cash Is King
Free cash flow isn't a prominently featured metric in company financials and earnings releases, but we think it's telling because it accounts for all operating and capital expenses, making it tough to manipulate. Cash is king.
While Under Armour posted positive free cash flow this quarter, the broader story hasn’t been so clean. Over the last two years, Under Armour’s demanding reinvestments to stay relevant have drained its resources, putting it in a pinch and limiting its ability to return capital to investors. Its free cash flow margin averaged negative 1.9%, meaning it lit $1.94 of cash on fire for every $100 in revenue.
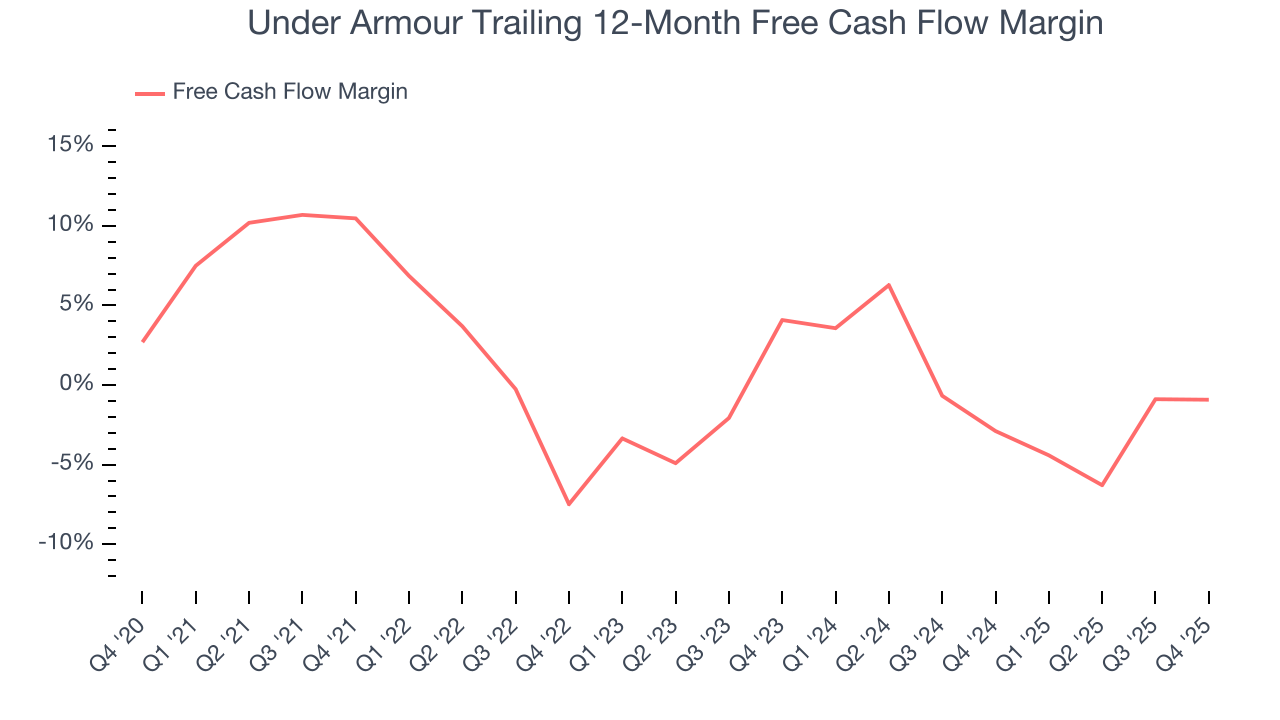
Under Armour’s free cash flow clocked in at $261.9 million in Q4, equivalent to a 19.7% margin. This cash profitability was in line with the comparable period last year and above its two-year average.
Over the next year, analysts predict Under Armour’s cash conversion will improve. Their consensus estimates imply its breakeven free cash flow margin for the last 12 months will increase to 4.2%, giving it more optionality.
9. Return on Invested Capital (ROIC)
EPS and free cash flow tell us whether a company was profitable while growing its revenue. But was it capital-efficient? Enter ROIC, a metric showing how much operating profit a company generates relative to the money it has raised (debt and equity).
Under Armour historically did a mediocre job investing in profitable growth initiatives. Its five-year average ROIC was 10.7%, somewhat low compared to the best consumer discretionary companies that consistently pump out 25%+.
We like to invest in businesses with high returns, but the trend in a company’s ROIC is what often surprises the market and moves the stock price. Unfortunately, Under Armour’s ROIC has decreased significantly over the last few years. Paired with its already low returns, these declines suggest its profitable growth opportunities are few and far between.
10. Balance Sheet Risk
Debt is a tool that can boost company returns but presents risks if used irresponsibly. As long-term investors, we aim to avoid companies taking excessive advantage of this instrument because it could lead to insolvency.
Under Armour’s $1.69 billion of debt exceeds the $464.6 million of cash on its balance sheet. Furthermore, its 82× net-debt-to-EBITDA ratio (based on its EBITDA of $14.97 million over the last 12 months) shows the company is overleveraged.
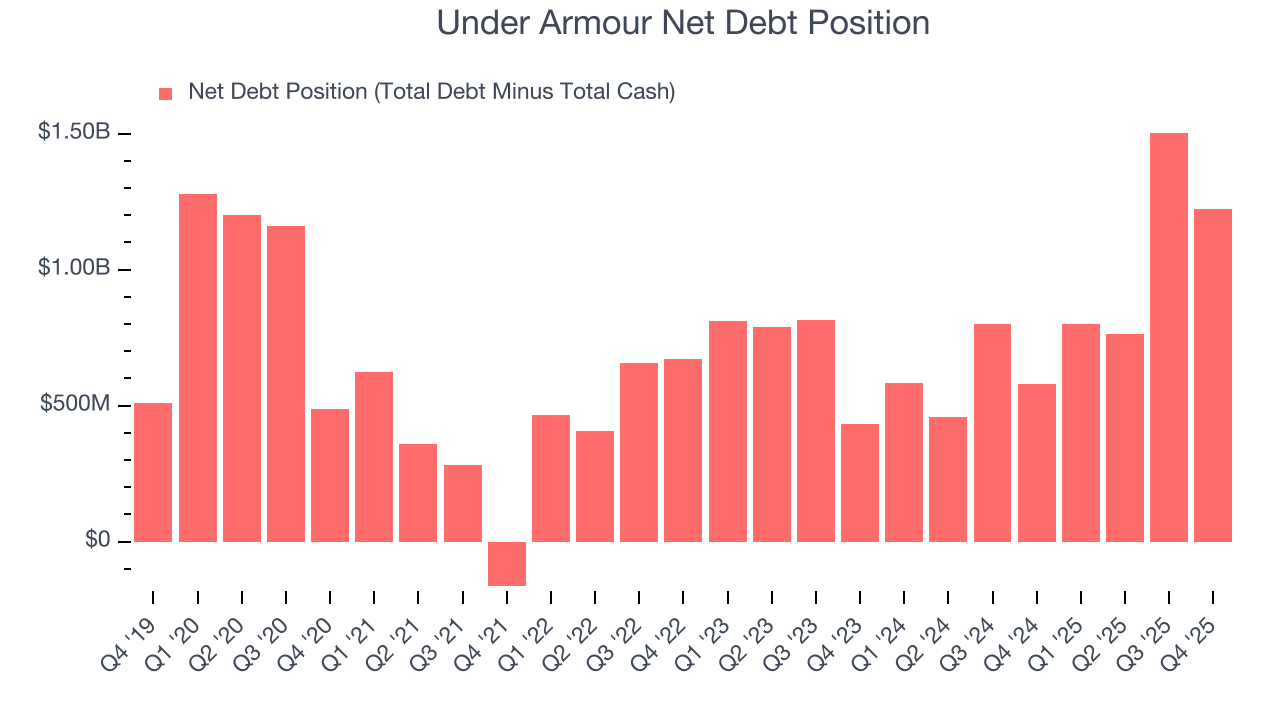
At this level of debt, incremental borrowing becomes increasingly expensive and credit agencies could downgrade the company’s rating if profitability falls. Under Armour could also be backed into a corner if the market turns unexpectedly – a situation we seek to avoid as investors in high-quality companies.
We hope Under Armour can improve its balance sheet and remain cautious until it increases its profitability or pays down its debt.
11. Key Takeaways from Under Armour’s Q4 Results
It was good to see Under Armour beat analysts’ EPS expectations this quarter. We were also glad its full-year EPS guidance trumped Wall Street’s estimates. On the other hand, its EBITDA missed. Overall, we think this was a solid quarter with some key areas of upside. The stock traded up 2.5% to $6.47 immediately after reporting.
12. Is Now The Time To Buy Under Armour?
Updated: March 29, 2026 at 10:42 PM EDT
When considering an investment in Under Armour, investors should account for its valuation and business qualities as well as what’s happened in the latest quarter.
We cheer for all companies serving everyday consumers, but in the case of Under Armour, we’ll be cheering from the sidelines. While its projected EPS for the next year implies the company’s fundamentals will improve, the downside is its constant currency sales performance has disappointed. On top of that, its relatively low ROIC suggests management has struggled to find compelling investment opportunities.
Under Armour’s P/E ratio based on the next 12 months is 32.3x. This valuation tells us it’s a bit of a market darling with a lot of good news priced in - we think other companies feature superior fundamentals at the moment.
Wall Street analysts have a consensus one-year price target of $7.73 on the company (compared to the current share price of $5.76).
Although the price target is bullish, readers should exercise caution because analysts tend to be overly optimistic. The firms they work for, often big banks, have relationships with companies that extend into fundraising, M&A advisory, and other rewarding business lines. As a result, they typically hesitate to say bad things for fear they will lose out. We at StockStory do not suffer from such conflicts of interest, so we’ll always tell it like it is.