
WESCO (WCC)
We’re skeptical of WESCO. Its growth has decelerated and its failure to generate meaningful free cash flow makes us question its prospects.― StockStory Analyst Team
1. News


2. Summary
Why We Think WESCO Will Underperform
Based in Pittsburgh, WESCO (NYSE:WCC) provides electrical, industrial, and communications products and augments them with services such as supply chain management.
- Lacking free cash flow limits its freedom to invest in growth initiatives, execute share buybacks, or pay dividends
- Organic revenue growth fell short of our benchmarks over the past two years and implies it may need to improve its products, pricing, or go-to-market strategy
- One positive is that its market share has increased this cycle as its 17.4% annual revenue growth over the last five years was exceptional


WESCO falls short of our quality standards. We’re hunting for superior stocks elsewhere.
Why There Are Better Opportunities Than WESCO


WESCO’s stock price of $300.50 implies a valuation ratio of 20x forward P/E. WESCO’s multiple may seem like a great deal among industrials peers, but we think there are valid reasons why it’s this cheap.
It’s better to pay up for high-quality businesses with higher long-term earnings potential rather than to buy lower-quality stocks because they appear cheap. These challenged businesses often don’t re-rate, a phenomenon known as a “value trap”.
3. WESCO (WCC) Research Report: Q4 CY2025 Update
Electrical supply company WESCO (NYSE:WCC) met Wall Street’s revenue expectations in Q4 CY2025, with sales up 10.3% year on year to $6.07 billion. Its non-GAAP profit of $3.40 per share was 12.6% below analysts’ consensus estimates.
WESCO (WCC) Q4 CY2025 Highlights:
- Revenue: $6.07 billion vs analyst estimates of $6.04 billion (10.3% year-on-year growth, in line)
- Adjusted EPS: $3.40 vs analyst expectations of $3.89 (12.6% miss)
- Adjusted EBITDA: $408.6 million vs analyst estimates of $420 million (6.7% margin, 2.7% miss)
- Operating Margin: 5.3%, in line with the same quarter last year
- Free Cash Flow Margin: 0.5%, down from 4.9% in the same quarter last year
- Organic Revenue rose 9.2% year on year (miss)
- Market Capitalization: $14.68 billion
Company Overview
Based in Pittsburgh, WESCO (NYSE:WCC) provides electrical, industrial, and communications products and augments them with services such as supply chain management.
Founded in 1922, WESCO started as a subsidiary of Westinghouse Electric Corporation, a manufacturer of motors, generators, and turbines. It was charged with selling and distributing the equipment and components manufactured by its parent.
Today, WESCO still maintains the mission of selling and distributing. Among its electrical and communications-focused product portfolio are circuit breakers, fuses, transformers, and circuit boards. The company aims to be a one-stop shop for these categories and aims to carry products from a variety of manufacturers so that customers such as manufacturing plants and electrical contractors don’t need to waste time shopping around. Reliable selection is complemented by reliable delivery, with WESCO able to get these sometimes difficult-to-transport products to construction and project sites.
The primary revenue source for WESCO comes from the sale of electrical and industrial products. The company also offers services such as supply chain and project management. While these services are a smaller portion of revenue, they do dampen the cyclical swings from selling goods whose demand can ebb and flow with the cyclical commercial and residential construction markets.
4. Maintenance and Repair Distributors
Supply chain and inventory management are themes that grew in focus after COVID wreaked havoc on the global movement of raw materials and components. Maintenance and repair distributors that boast reliable selection and quickly deliver products to customers can benefit from this theme. While e-commerce hasn’t disrupted industrial distribution as much as consumer retail, it is still a real threat, forcing investment in omnichannel capabilities to serve customers everywhere. Additionally, maintenance and repair distributors are at the whim of economic cycles that impact the capital spending and construction projects that can juice demand.
Competitors in the industrial distribution and supply chain solutions industry include Graybar Electric (NYSE:GRAY), Anixter (NASDAQ:AXE), and HD Supply (NASDAQ:HDS).
5. Revenue Growth
A company’s long-term sales performance is one signal of its overall quality. Even a bad business can shine for one or two quarters, but a top-tier one grows for years. Luckily, WESCO’s sales grew at an exceptional 13.8% compounded annual growth rate over the last five years. Its growth beat the average industrials company and shows its offerings resonate with customers.
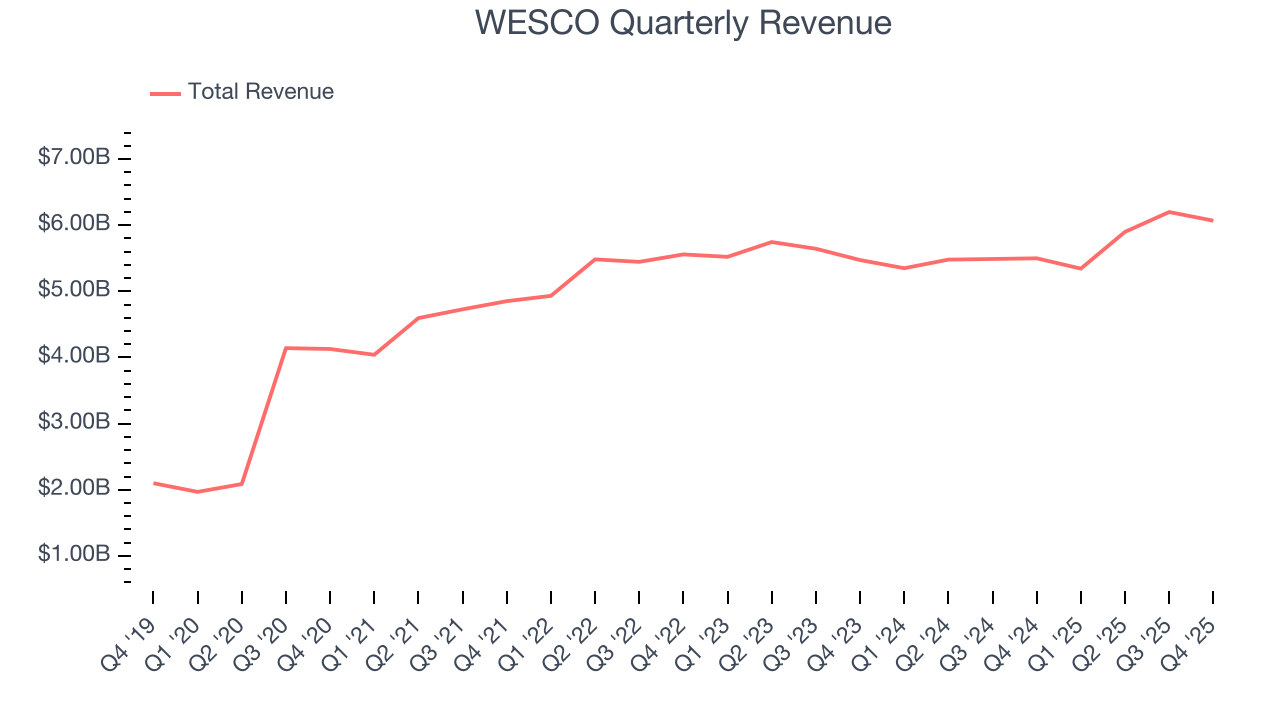
We at StockStory place the most emphasis on long-term growth, but within industrials, a half-decade historical view may miss cycles, industry trends, or a company capitalizing on catalysts such as a new contract win or a successful product line. WESCO’s recent performance shows its demand has slowed significantly as its annualized revenue growth of 2.5% over the last two years was well below its five-year trend. 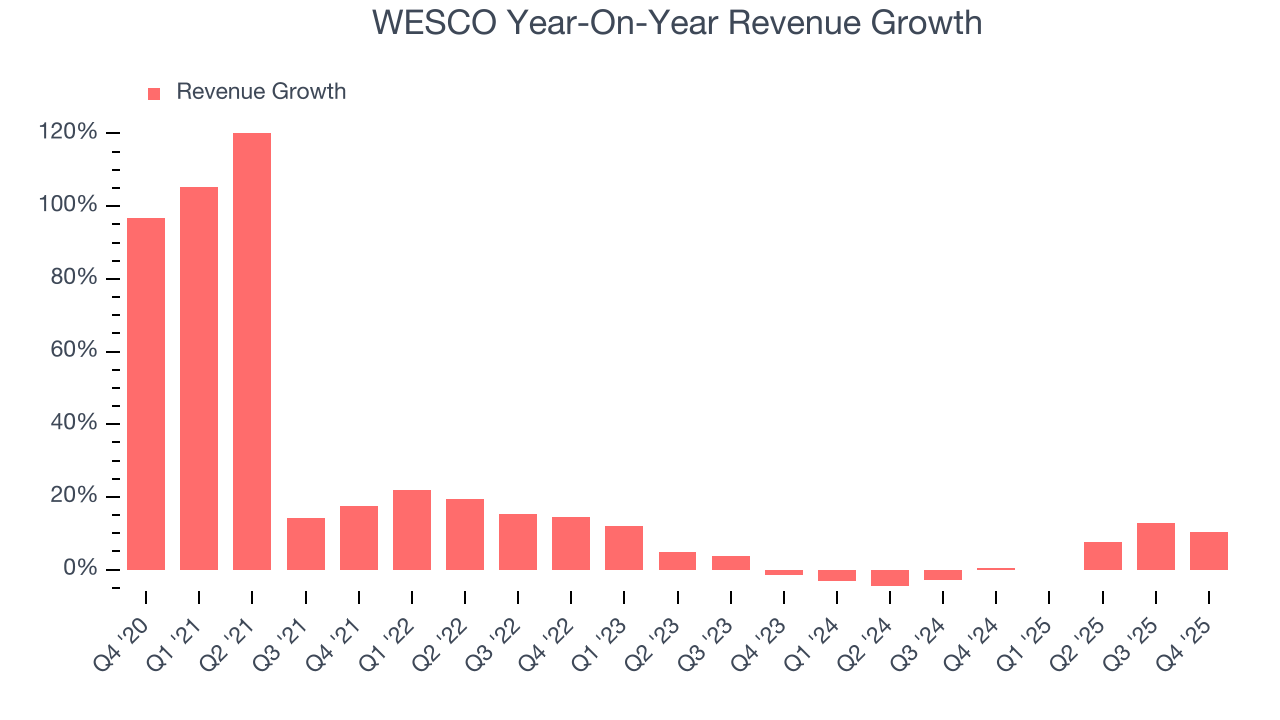
We can dig further into the company’s sales dynamics by analyzing its organic revenue, which strips out one-time events like acquisitions and currency fluctuations that don’t accurately reflect its fundamentals. Over the last two years, WESCO’s organic revenue averaged 4% year-on-year growth. Because this number is better than its two-year revenue growth, we can see that some mixture of divestitures and foreign exchange rates dampened its headline results. 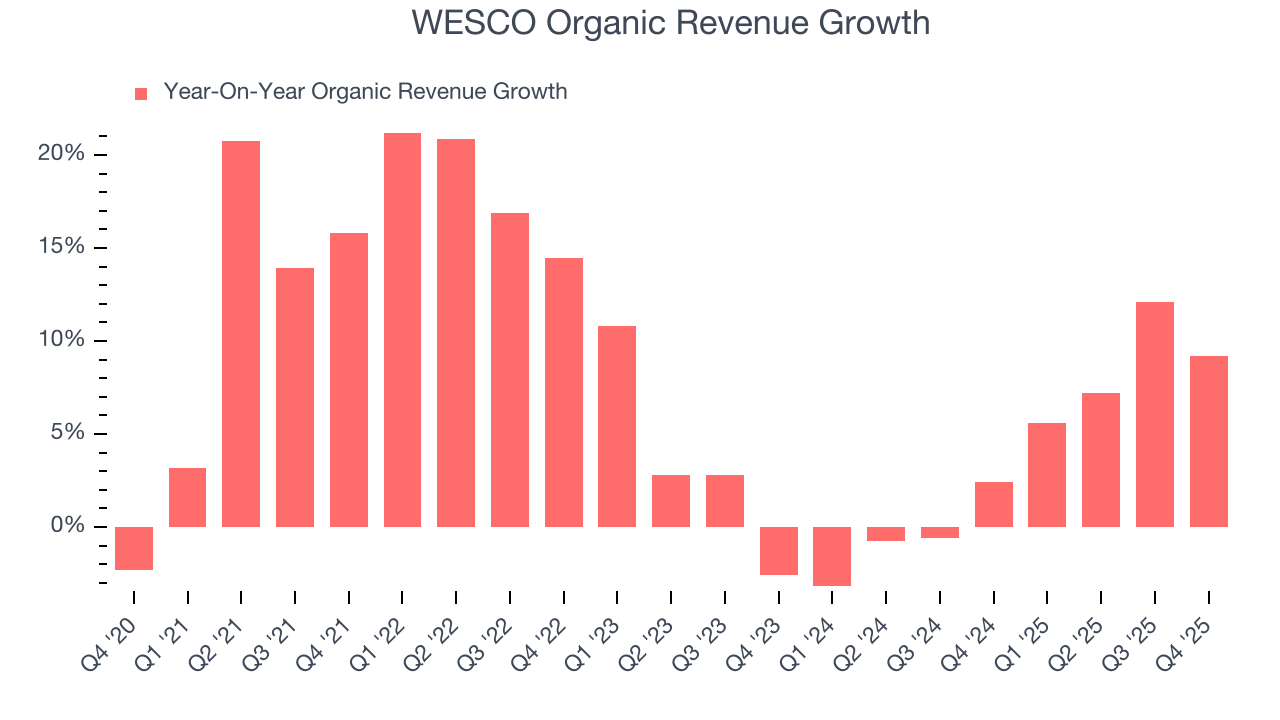
This quarter, WESCO’s year-on-year revenue growth was 10.3%, and its $6.07 billion of revenue was in line with Wall Street’s estimates.
Looking ahead, sell-side analysts expect revenue to grow 6.1% over the next 12 months. Although this projection indicates its newer products and services will catalyze better top-line performance, it is still below average for the sector.
6. Gross Margin & Pricing Power
WESCO has bad unit economics for an industrials business, signaling it operates in a competitive market. As you can see below, it averaged a 21.4% gross margin over the last five years. That means WESCO paid its suppliers a lot of money ($78.59 for every $100 in revenue) to run its business. 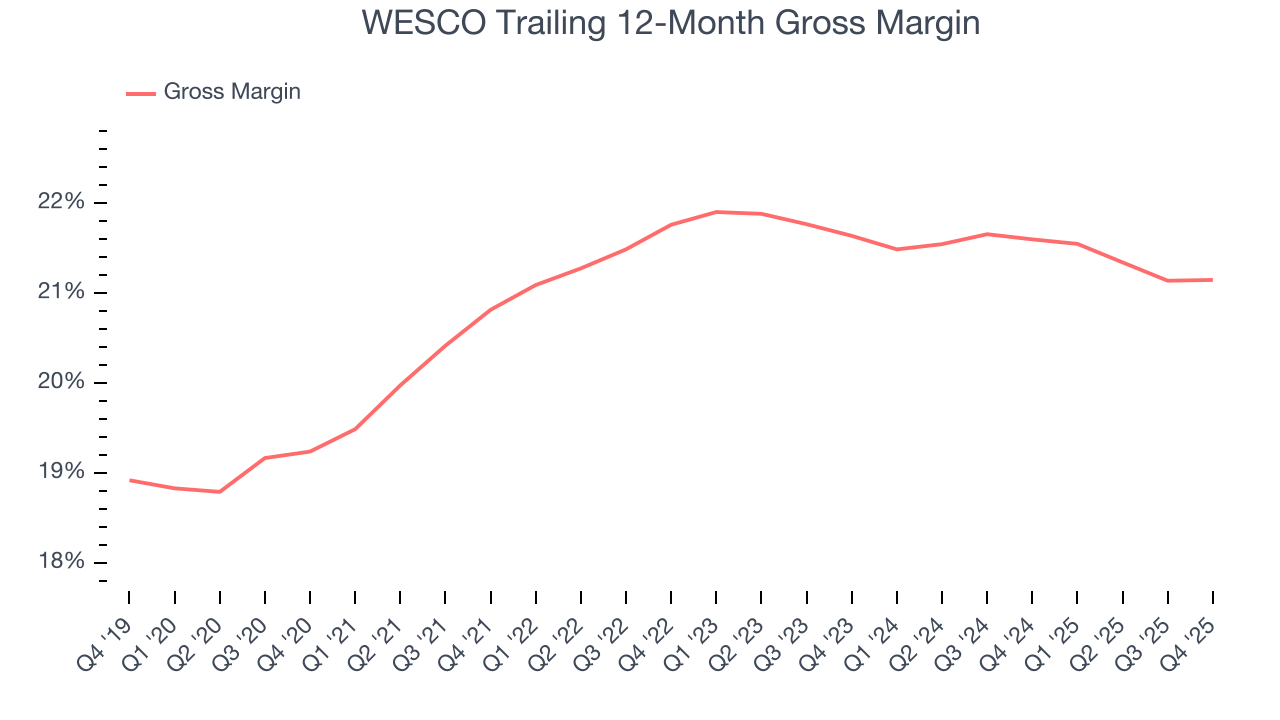
WESCO produced a 21.2% gross profit margin in Q4, in line with the same quarter last year. Zooming out, the company’s full-year margin has remained steady over the past 12 months, suggesting its input costs (such as raw materials and manufacturing expenses) have been stable and it isn’t under pressure to lower prices.
7. Operating Margin
Operating margin is one of the best measures of profitability because it tells us how much money a company takes home after procuring and manufacturing its products, marketing and selling those products, and most importantly, keeping them relevant through research and development.
WESCO’s operating margin might fluctuated slightly over the last 12 months but has remained more or less the same, averaging 5.7% over the last five years. This profitability was paltry for an industrials business and caused by its suboptimal cost structureand low gross margin.
Analyzing the trend in its profitability, WESCO’s operating margin might fluctuated slightly but has generally stayed the same over the last five years. This raises questions about the company’s expense base because its revenue growth should have given it leverage on its fixed costs, resulting in better economies of scale and profitability.
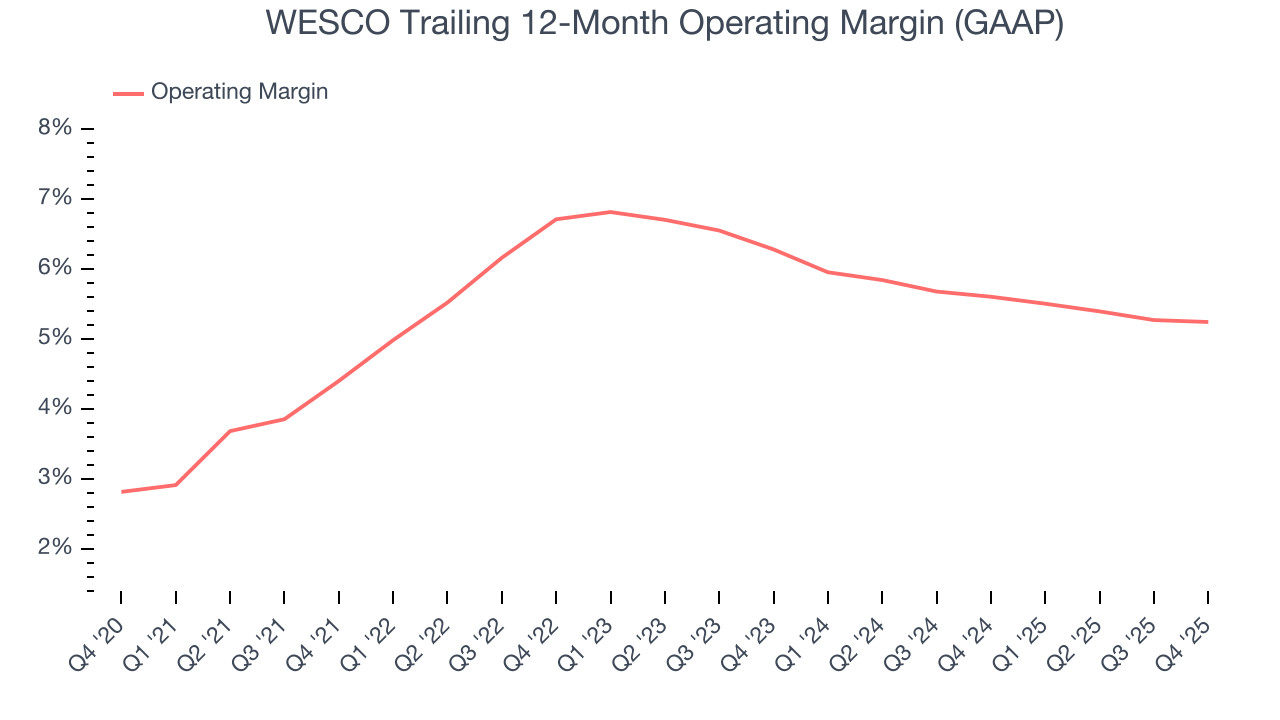
This quarter, WESCO generated an operating margin profit margin of 5.3%, in line with the same quarter last year. This indicates the company’s cost structure has recently been stable.
8. Earnings Per Share
Revenue trends explain a company’s historical growth, but the long-term change in earnings per share (EPS) points to the profitability of that growth – for example, a company could inflate its sales through excessive spending on advertising and promotions.
WESCO’s EPS grew at an astounding 20.3% compounded annual growth rate over the last five years, higher than its 13.8% annualized revenue growth. This tells us the company became more profitable on a per-share basis as it expanded.
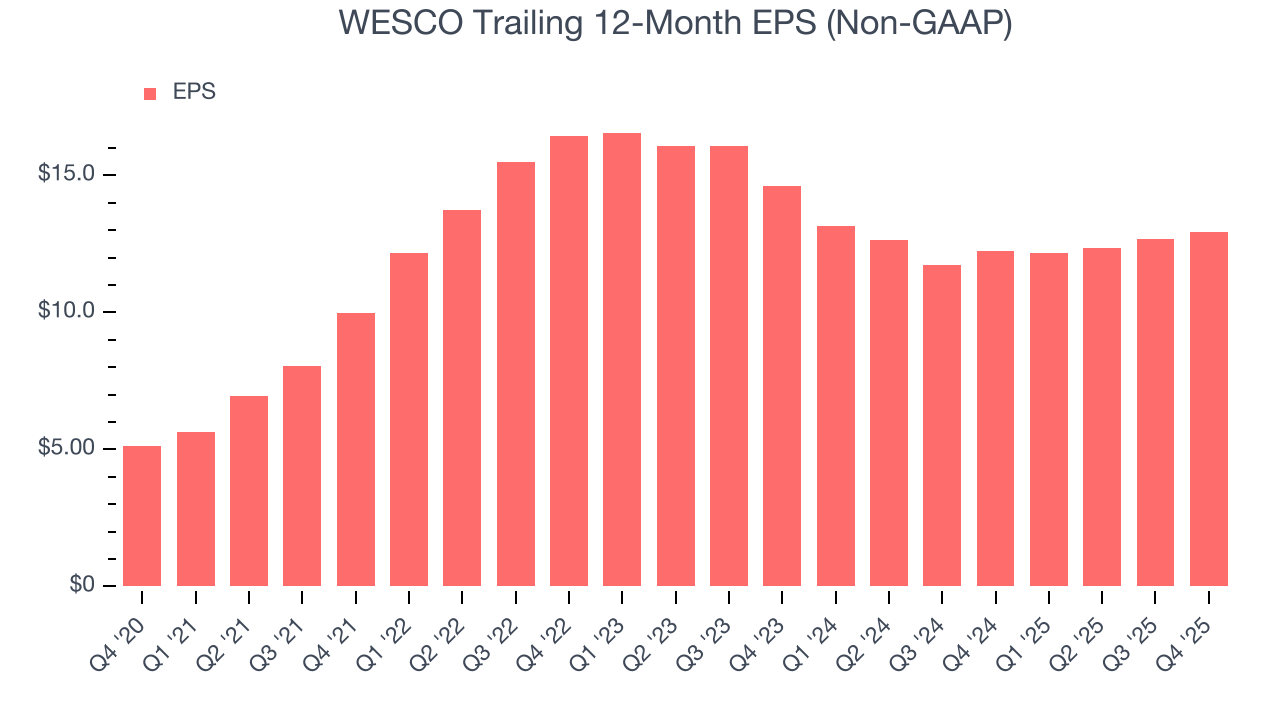
We can take a deeper look into WESCO’s earnings to better understand the drivers of its performance. A five-year view shows that WESCO has repurchased its stock, shrinking its share count by 3.3%. This tells us its EPS outperformed its revenue not because of increased operational efficiency but financial engineering, as buybacks boost per share earnings. 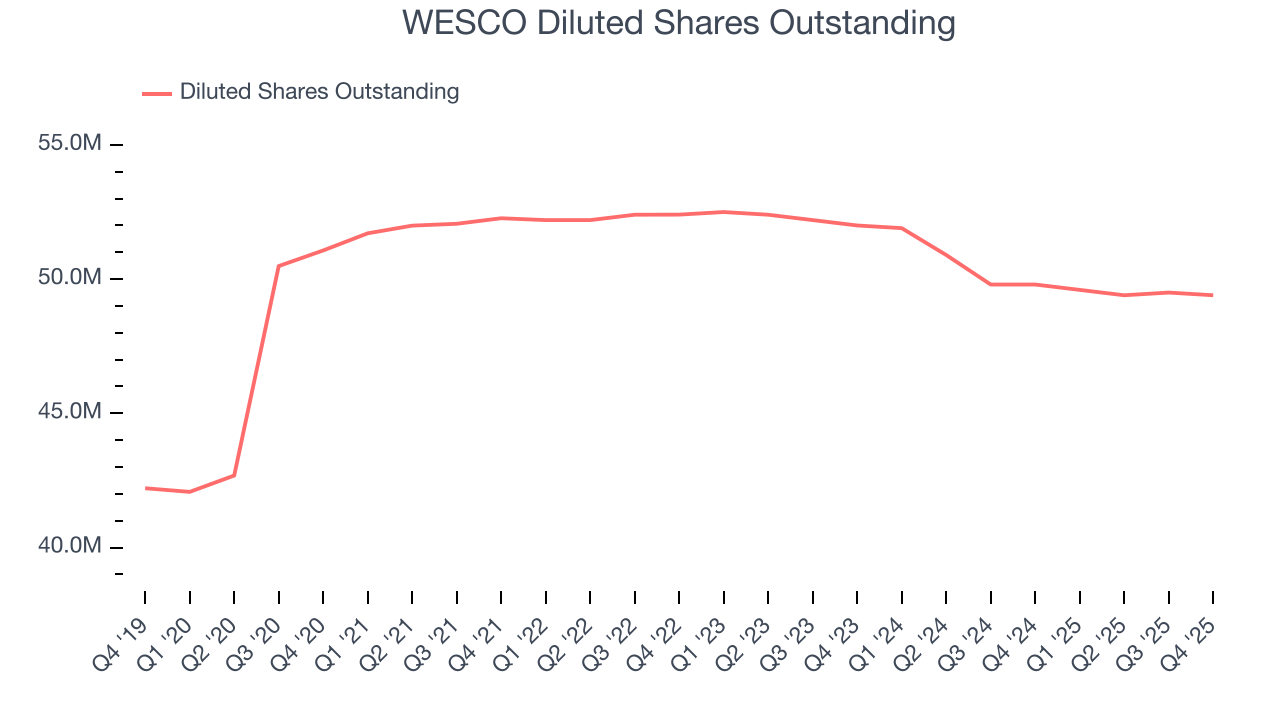
Like with revenue, we analyze EPS over a more recent period because it can provide insight into an emerging theme or development for the business.
For WESCO, its two-year annual EPS declines of 5.9% mark a reversal from its (seemingly) healthy five-year trend. We hope WESCO can return to earnings growth in the future.
In Q4, WESCO reported adjusted EPS of $3.40, up from $3.16 in the same quarter last year. Despite growing year on year, this print missed analysts’ estimates, but we care more about long-term adjusted EPS growth than short-term movements. Over the next 12 months, Wall Street expects WESCO’s full-year EPS of $12.92 to grow 26.8%.
9. Cash Is King
Although earnings are undoubtedly valuable for assessing company performance, we believe cash is king because you can’t use accounting profits to pay the bills.
WESCO has shown poor cash profitability over the last five years, giving the company limited opportunities to return capital to shareholders. Its free cash flow margin averaged 1.5%, lousy for an industrials business.
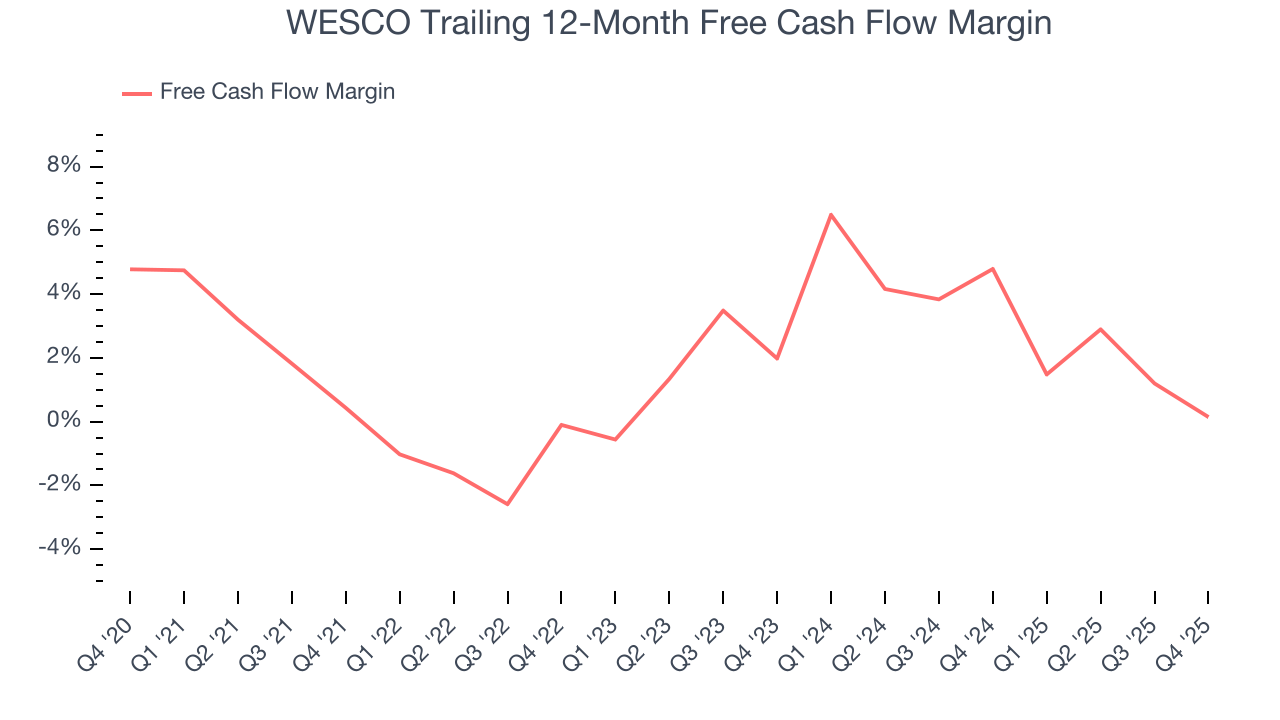
WESCO broke even from a free cash flow perspective in Q4. The company’s cash profitability regressed as it was 4.4 percentage points lower than in the same quarter last year, prompting us to pay closer attention. Short-term fluctuations typically aren’t a big deal because investment needs can be seasonal, but we’ll be watching to see if the trend extrapolates into future quarters.
10. Return on Invested Capital (ROIC)
EPS and free cash flow tell us whether a company was profitable while growing its revenue. But was it capital-efficient? A company’s ROIC explains this by showing how much operating profit it makes compared to the money it has raised (debt and equity).
WESCO’s management team makes decent investment decisions and generates value for shareholders. Its five-year average ROIC was 10.8%, slightly better than typical industrials business.
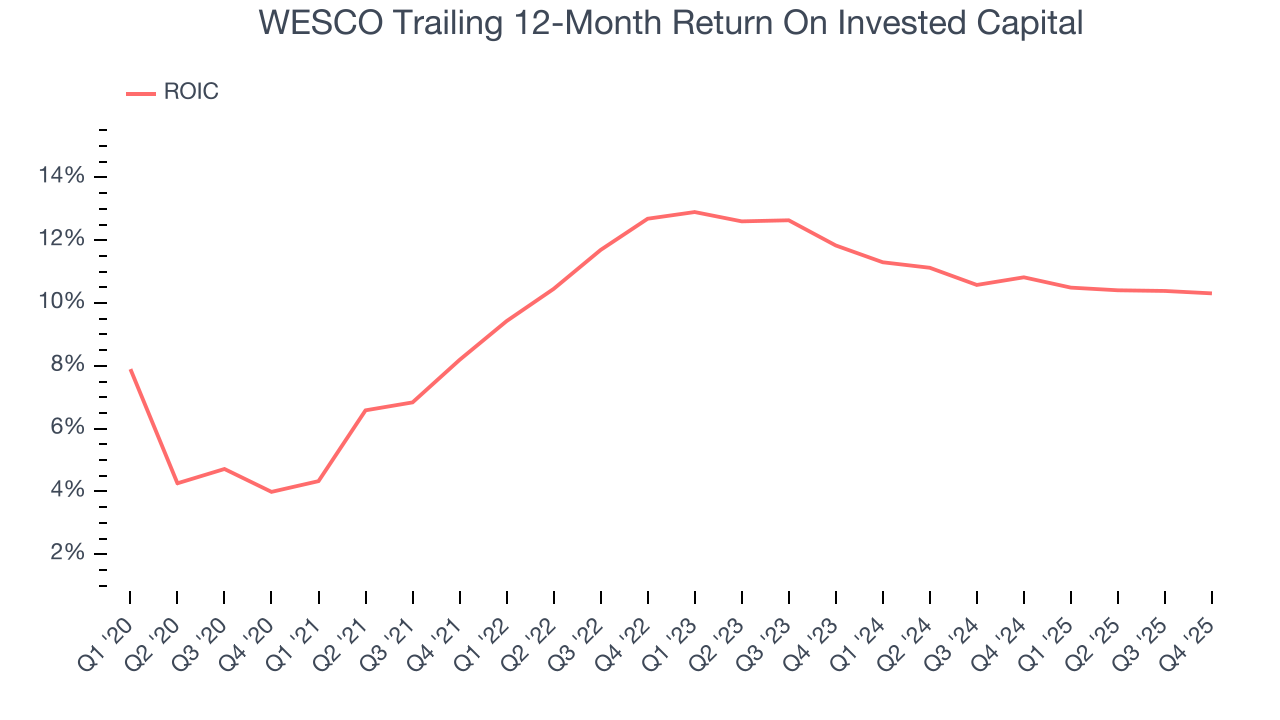
We like to invest in businesses with high returns, but the trend in a company’s ROIC is what often surprises the market and moves the stock price. Uneventfully, WESCO’s ROIC has stayed the same over the last few years. Given the company’s underwhelming financial performance in other areas, we’d like to see its returns improve before recommending the stock.
11. Balance Sheet Assessment
WESCO reported $604.8 million of cash and $5.78 billion of debt on its balance sheet in the most recent quarter. As investors in high-quality companies, we primarily focus on two things: 1) that a company’s debt level isn’t too high and 2) that its interest payments are not excessively burdening the business.
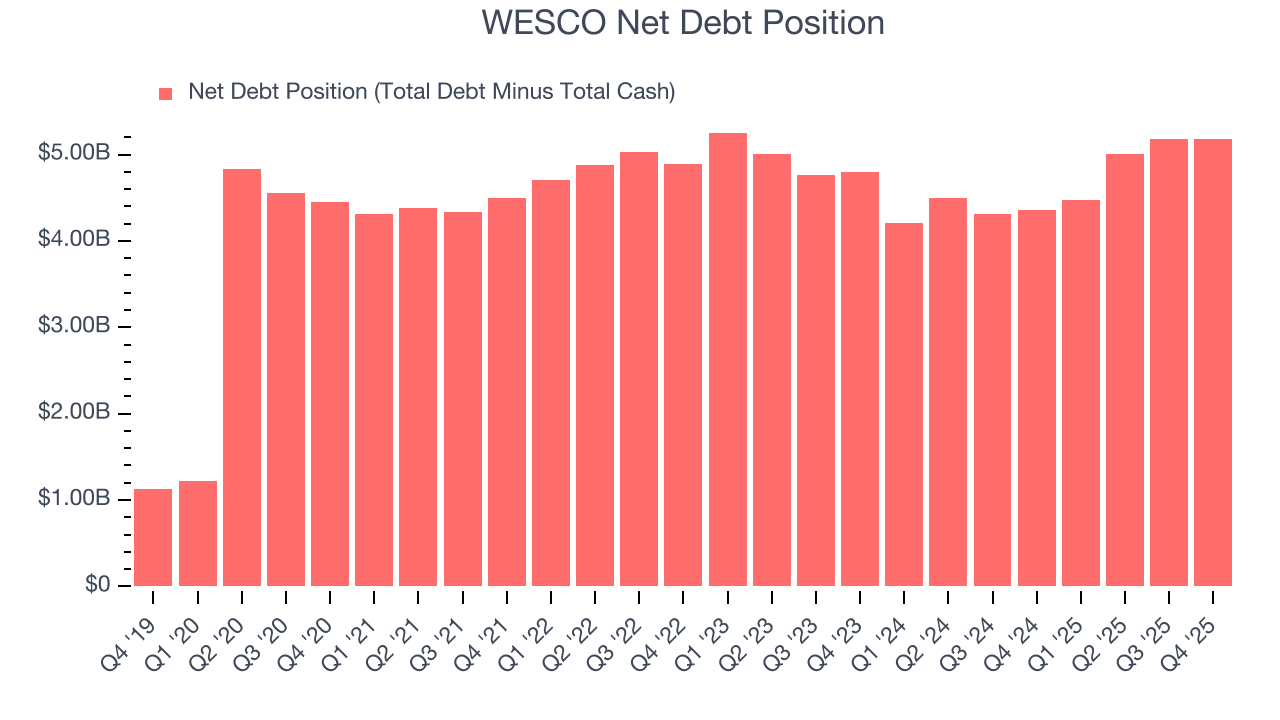
With $1.54 billion of EBITDA over the last 12 months, we view WESCO’s 3.4× net-debt-to-EBITDA ratio as safe. We also see its $169.6 million of annual interest expenses as appropriate. The company’s profits give it plenty of breathing room, allowing it to continue investing in growth initiatives.
12. Key Takeaways from WESCO’s Q4 Results
It was good to see WESCO meet analysts’ revenue expectations this quarter. On the other hand, its EPS missed and its EBITDA fell short of Wall Street’s estimates. Overall, this was a softer quarter. The stock traded down 6.4% to $282.31 immediately after reporting.
13. Is Now The Time To Buy WESCO?
Updated: February 10, 2026 at 6:33 AM EST
Before making an investment decision, investors should account for WESCO’s business fundamentals and valuation in addition to what happened in the latest quarter.
WESCO isn’t a terrible business, but it doesn’t pass our quality test. Although its revenue growth was exceptional over the last five years, it’s expected to deteriorate over the next 12 months and its low free cash flow margins give it little breathing room. And while the company’s astounding EPS growth over the last five years shows its profits are trickling down to shareholders, the downside is its low gross margins indicate some combination of competitive pressures and high production costs.
WESCO’s P/E ratio based on the next 12 months is 18.4x. While this valuation is fair, the upside isn’t great compared to the potential downside. We're fairly confident there are better stocks to buy right now.
Wall Street analysts have a consensus one-year price target of $296.75 on the company (compared to the current share price of $282.31).