
XPO (XPO)
XPO is in for a bumpy ride. Its low returns on capital and plummeting sales suggest it struggles to generate demand and profits, a red flag.― StockStory Analyst Team
1. News


2. Summary
Why We Think XPO Will Underperform
Owning a mobile game simulating freight operations for the Tour de France, XPO (NYSE:XPO) is a transportation company specializing in expedited shipping services.
- Customers postponed purchases of its products and services this cycle as its revenue declined by 1.4% annually over the last five years
- Gross margin of 14.7% is below its competitors, leaving less money to invest in areas like marketing and R&D
- Lacking free cash flow limits its freedom to invest in growth initiatives, execute share buybacks, or pay dividends


XPO falls short of our expectations. There are superior opportunities elsewhere.
Why There Are Better Opportunities Than XPO


XPO is trading at $150 per share, or 37.5x forward P/E. This multiple is higher than most industrials companies, and we think it’s quite expensive for the weaker revenue growth you get.
We’d rather invest in similarly-priced but higher-quality companies with more reliable earnings growth.
3. XPO (XPO) Research Report: Q3 CY2025 Update
Freight delivery company XPO (NYSE:XPO) reported Q3 CY2025 results topping the market’s revenue expectations, with sales up 2.8% year on year to $2.11 billion. Its non-GAAP profit of $1.07 per share was 5.3% above analysts’ consensus estimates.
XPO (XPO) Q3 CY2025 Highlights:
- Revenue: $2.11 billion vs analyst estimates of $2.07 billion (2.8% year-on-year growth, 1.9% beat)
- Adjusted EPS: $1.07 vs analyst estimates of $1.02 (5.3% beat)
- Adjusted EBITDA: $342 million vs analyst estimates of $334.4 million (16.2% margin, 2.3% beat)
- Operating Margin: 7.8%, in line with the same quarter last year
- Free Cash Flow Margin: 10.2%, up from 6.8% in the same quarter last year
- Market Capitalization: $14.69 billion
Company Overview
Owning a mobile game simulating freight operations for the Tour de France, XPO (NYSE:XPO) is a transportation company specializing in expedited shipping services.
The company was renamed from Express-1 to XPO in 2011 when it was acquired by a serial founder and investor, Brad Jacobs. XPO is the seventh billion-dollar company Jacobs has led, and a common theme tying his investments together is M&A.
XPO was no different, and when making acquisitions, the company originally targeted smaller companies to enhance its existing services and extract cost efficiencies. As it expanded, it began acquiring larger companies to enter new markets and geographic regions. Specifically, the $3.56 billion acquisition of Norbert Dentressangle (2015) expanded its presence in Europe and the $3 billion acquisition of Con-way (2015) strengthened XPO’s less-than-truckload (LTL), full truckload, and multimodal freight transportation services.
Today, XPO offers delivery services for various businesses across the United States and North America. On the less-than-truckload (LTL) side, deliveries are made by collecting smaller shipments from various customers, combining them at a central hub, and then transporting them with its own fleet of trucks. Conversely, its full truckload (FTL) business handles larger shipments from a single customer, filling an entire truck, and transporting it directly to the destination without consolidation or additional stops. Some other services include multimodal freight transport and last-mile delivery, which consist of using multiple forms of transportation like trucks, trains, and ships to move goods and deliver goods from a distribution center or hub directly to the customer's location.
The company engages in various types of contracts with its customers, which can include short-term agreements for specific shipments or longer-term contracts. These contracts are dependent on the mode of transportation. FTL contracts include fixed rates per mile or load with additional fuel surcharges while LTL contracts feature pricing based on factors like weight, volume, and distance. For multimodal transport contracts, pricing involves fees for coordinating different transportation modes. Last-mile delivery contracts on the other hand offer fixed pricing for standard routes and variable pricing based on urgency and distance.
4. Ground Transportation
The growth of e-commerce and global trade continues to drive demand for shipping services, especially last-mile delivery, presenting opportunities for ground transportation companies. The industry continues to invest in data, analytics, and autonomous fleets to optimize efficiency and find the most cost-effective routes. Despite the essential services this industry provides, ground transportation companies are still at the whim of economic cycles. Consumer spending, for example, can greatly impact the demand for these companies’ offerings while fuel costs can influence profit margins.
Competitors offering similar products include FedEx (NYSE:FDX), UPS (NYSE:UPS), and Old Dominion (NASDAQ:ODFL).
5. Revenue Growth
A company’s long-term sales performance can indicate its overall quality. Any business can put up a good quarter or two, but the best consistently grow over the long haul. Over the last five years, XPO’s demand was weak and its revenue declined by 1.4% per year. This wasn’t a great result and suggests it’s a low quality business.
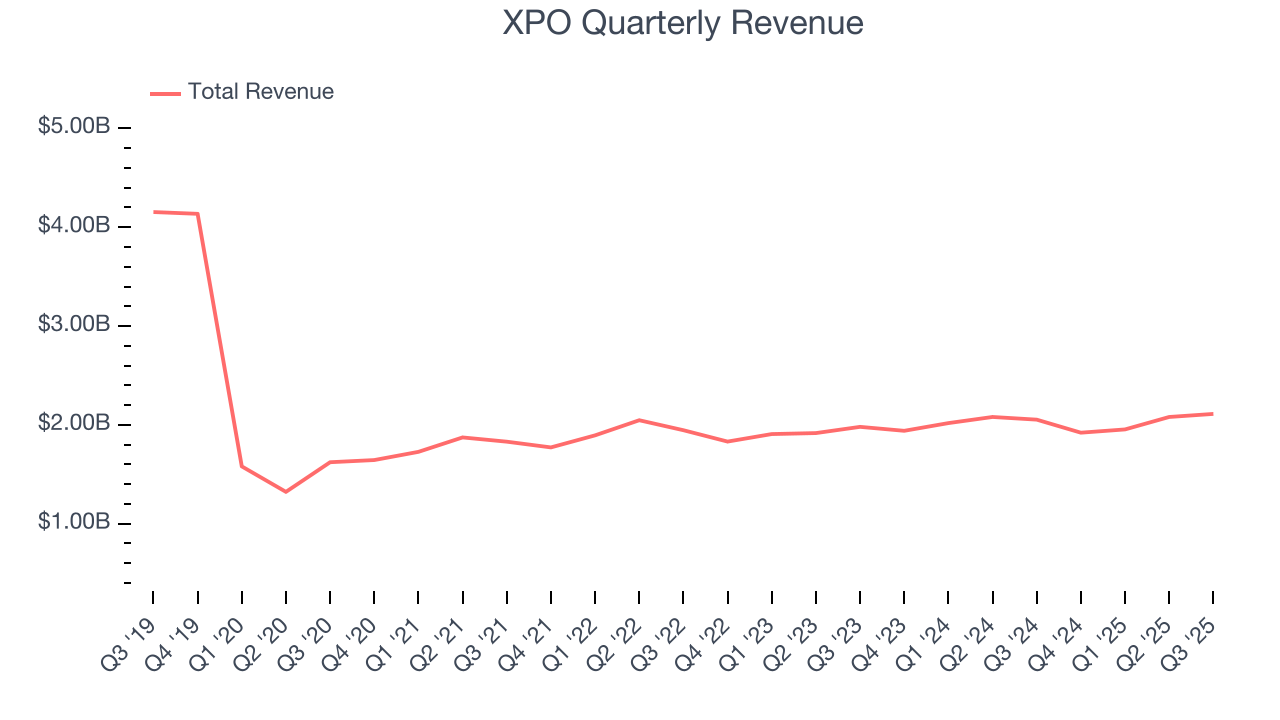
Long-term growth is the most important, but within industrials, a half-decade historical view may miss new industry trends or demand cycles. XPO’s annualized revenue growth of 2.8% over the last two years is above its five-year trend, but we were still disappointed by the results. We also note many other Ground Transportation businesses have faced declining sales because of cyclical headwinds. While XPO grew slower than we’d like, it did do better than its peers. 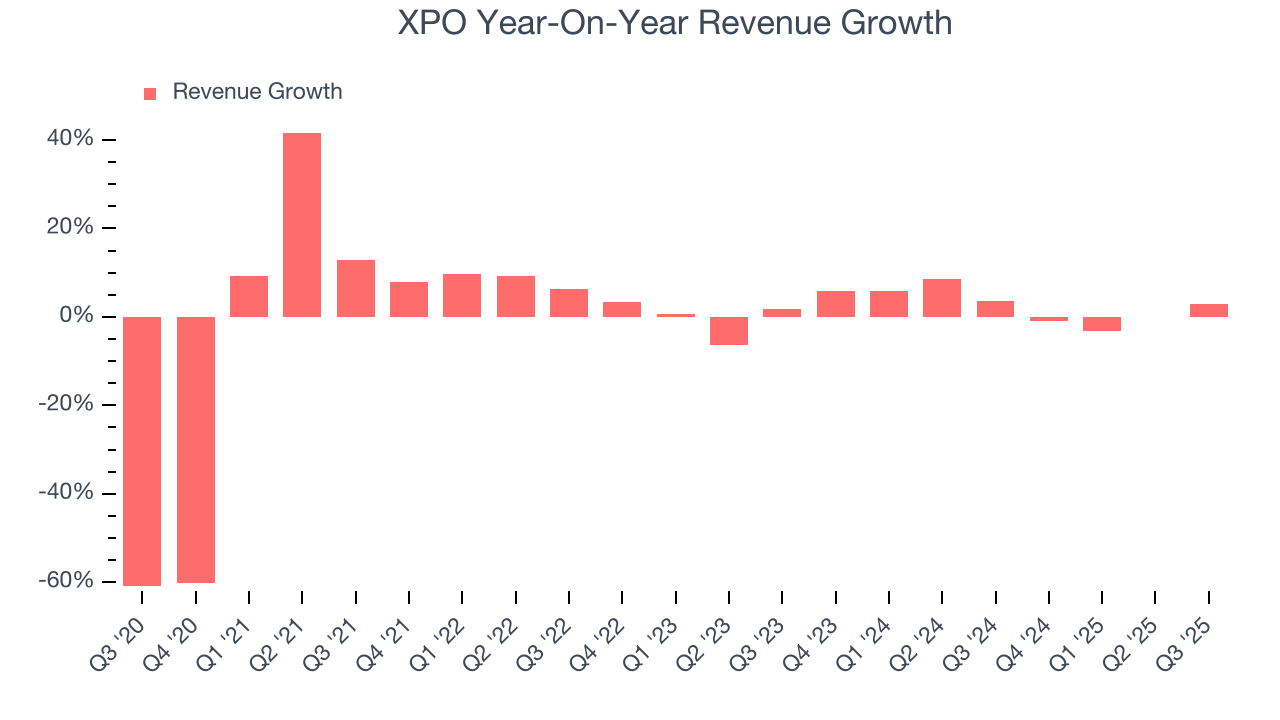
We can dig further into the company’s revenue dynamics by analyzing its most important segments, North American Less-Than-Truckload and European Transportation , which are 59.5% and 40.6% of revenue. Over the last two years, XPO’s North American Less-Than-Truckload revenue (freight services) averaged 2.8% year-on-year growth while its European Transportation revenue (truckload, less-than-truckload, and truck brokerage) averaged 3% growth. 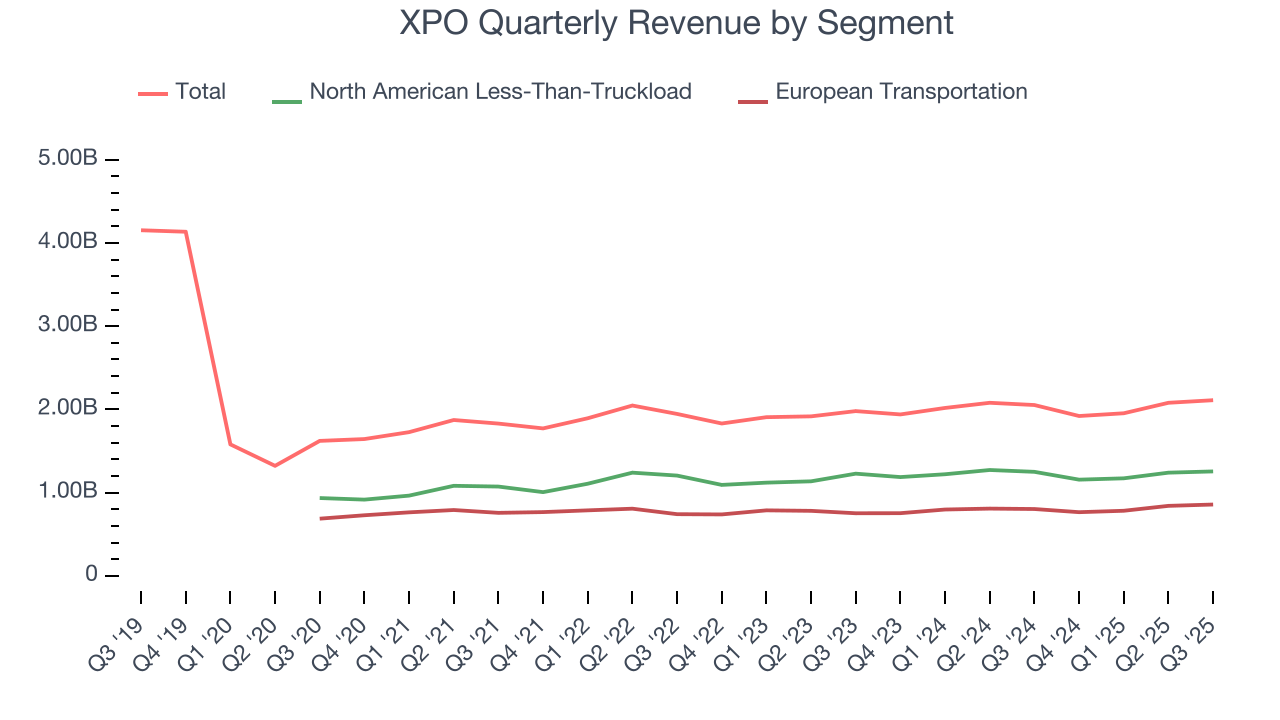
This quarter, XPO reported modest year-on-year revenue growth of 2.8% but beat Wall Street’s estimates by 1.9%.
Looking ahead, sell-side analysts expect revenue to grow 2.8% over the next 12 months, similar to its two-year rate. This projection is underwhelming and indicates its newer products and services will not accelerate its top-line performance yet.
6. Gross Margin & Pricing Power
All else equal, we prefer higher gross margins because they usually indicate that a company sells more differentiated products and commands stronger pricing power.
XPO has bad unit economics for an industrials business, signaling it operates in a competitive market. As you can see below, it averaged a 14.7% gross margin over the last five years. Said differently, XPO had to pay a chunky $85.33 to its suppliers for every $100 in revenue. 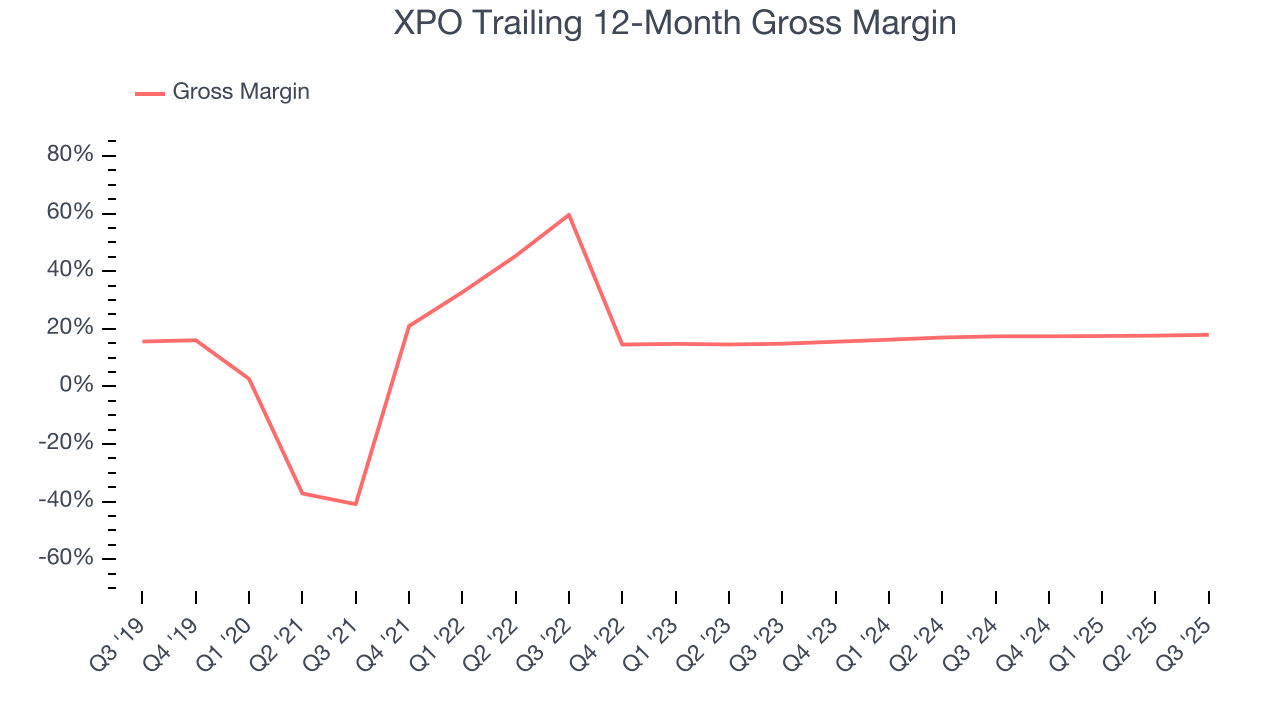
XPO’s gross profit margin came in at 19.2% this quarter, up 1.1 percentage points year on year. Zooming out, the company’s full-year margin has remained steady over the past 12 months, suggesting its input costs (such as raw materials and manufacturing expenses) have been stable and it isn’t under pressure to lower prices.
7. Operating Margin
Operating margin is an important measure of profitability as it shows the portion of revenue left after accounting for all core expenses – everything from the cost of goods sold to advertising and wages. It’s also useful for comparing profitability across companies with different levels of debt and tax rates because it excludes interest and taxes.
XPO was profitable over the last five years but held back by its large cost base. Its average operating margin of 6.2% was weak for an industrials business. This result isn’t too surprising given its low gross margin as a starting point.
On the plus side, XPO’s operating margin rose by 3.7 percentage points over the last five years. We’ll take XPO’s improvement as many Ground Transportation companies saw their margins fall (along with revenue, as mentioned above) because the cycle turned in the wrong direction.
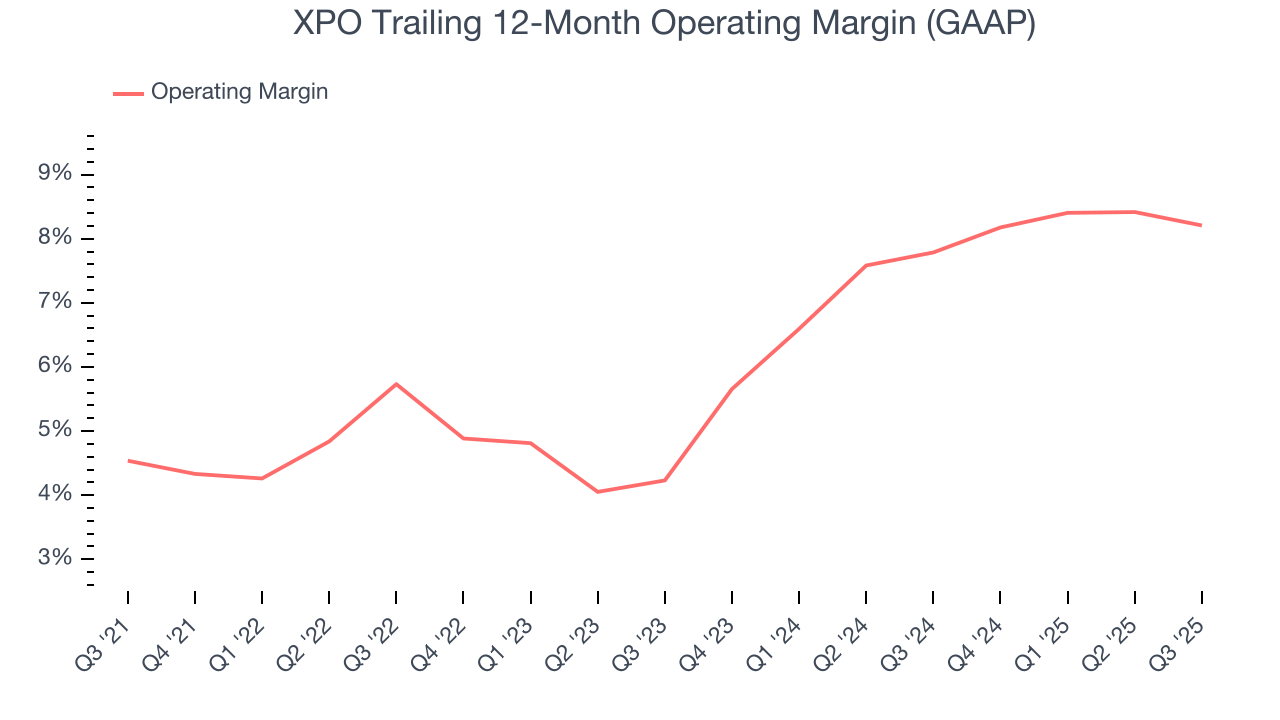
This quarter, XPO generated an operating margin profit margin of 7.8%, in line with the same quarter last year. This indicates the company’s cost structure has recently been stable.
8. Earnings Per Share
Revenue trends explain a company’s historical growth, but the long-term change in earnings per share (EPS) points to the profitability of that growth – for example, a company could inflate its sales through excessive spending on advertising and promotions.
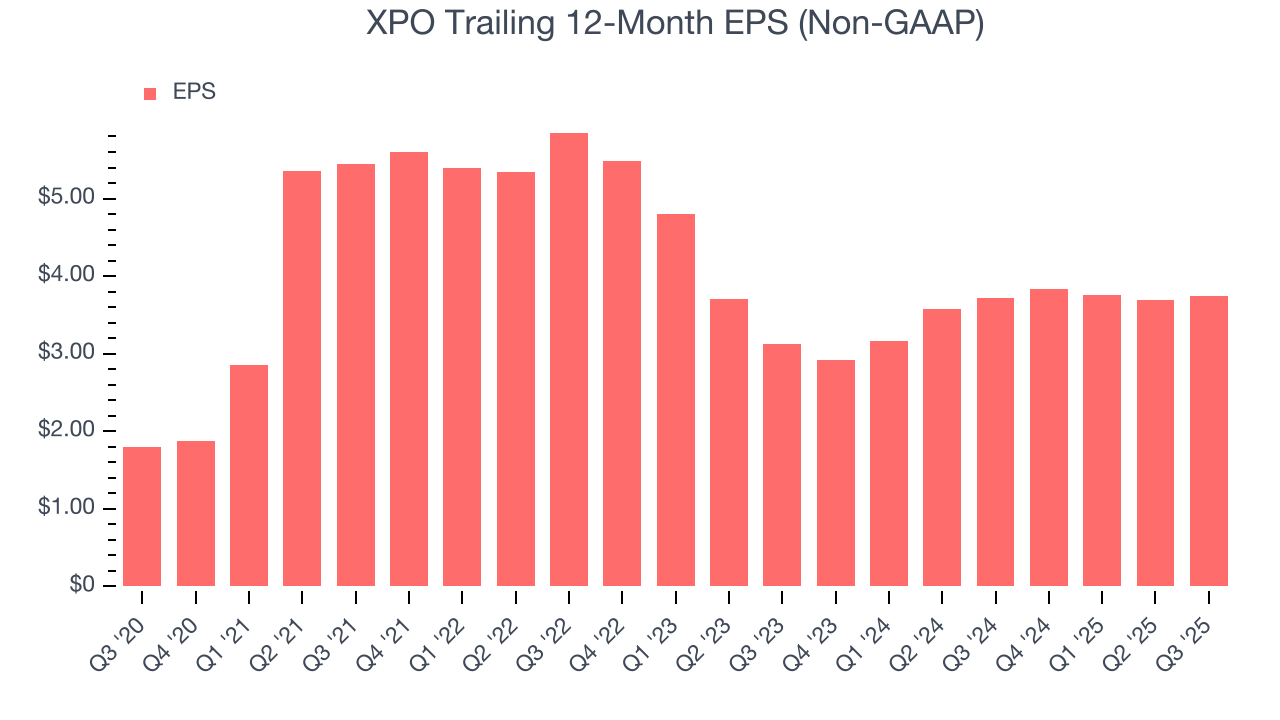
XPO’s EPS grew at a spectacular 15.7% compounded annual growth rate over the last five years, higher than its 1.4% annualized revenue declines. This tells us management adapted its cost structure in response to a challenging demand environment.
We can take a deeper look into XPO’s earnings quality to better understand the drivers of its performance. As we mentioned earlier, XPO’s operating margin was flat this quarter but expanded by 3.7 percentage points over the last five years. This was the most relevant factor (aside from the revenue impact) behind its higher earnings; interest expenses and taxes can also affect EPS but don’t tell us as much about a company’s fundamentals.
Like with revenue, we analyze EPS over a shorter period to see if we are missing a change in the business.
For XPO, its two-year annual EPS growth of 9.3% was lower than its five-year trend. We hope its growth can accelerate in the future.
In Q3, XPO reported adjusted EPS of $1.07, up from $1.02 in the same quarter last year. This print beat analysts’ estimates by 5.3%. Over the next 12 months, Wall Street expects XPO’s full-year EPS of $3.74 to grow 16%.
9. Cash Is King
If you’ve followed StockStory for a while, you know we emphasize free cash flow. Why, you ask? We believe that in the end, cash is king, and you can’t use accounting profits to pay the bills.
XPO has shown poor cash profitability over the last five years, giving the company limited opportunities to return capital to shareholders. Its free cash flow margin averaged 1.5%, lousy for an industrials business.
Taking a step back, we can see that XPO’s margin dropped by 5.1 percentage points during that time. It may have ticked higher more recently, but shareholders are likely hoping for its margin to at least revert to its historical level. Almost any movement in the wrong direction is undesirable because of its already low cash conversion. If the longer-term trend returns, it could signal it’s becoming a more capital-intensive business.
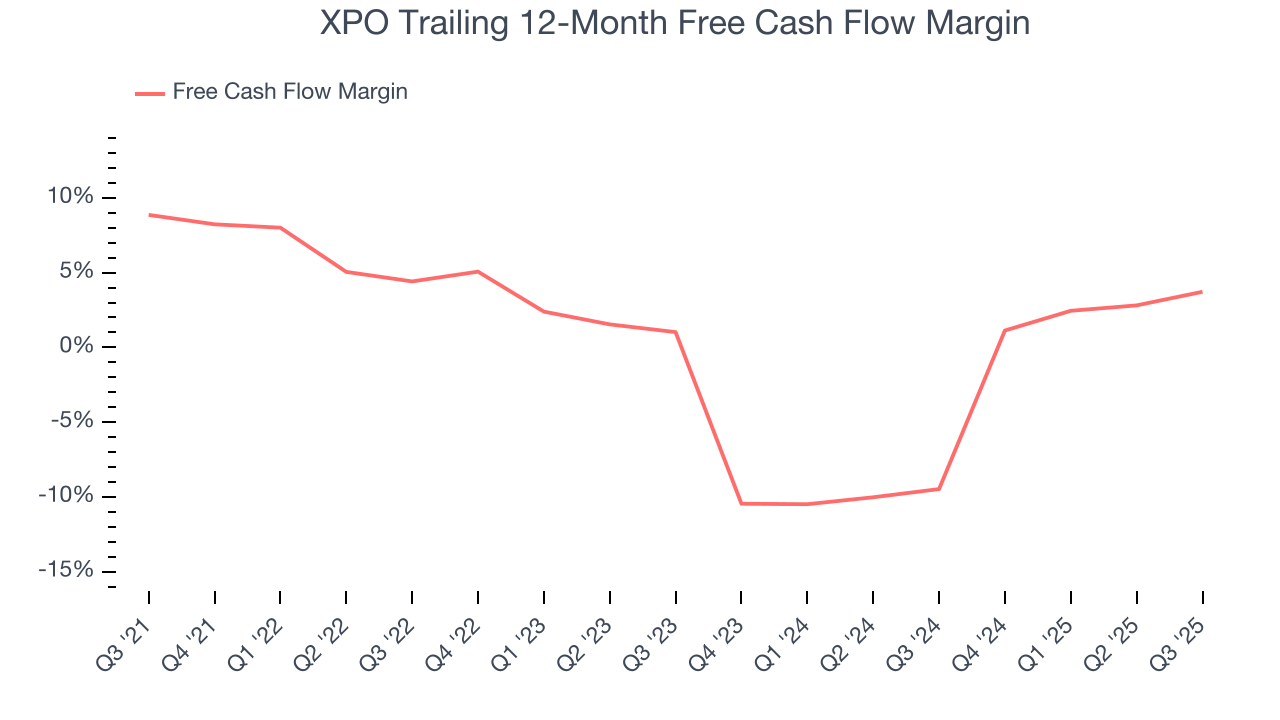
XPO’s free cash flow clocked in at $215 million in Q3, equivalent to a 10.2% margin. This result was good as its margin was 3.4 percentage points higher than in the same quarter last year, but we wouldn’t read too much into the short term because investment needs can be seasonal, leading to temporary swings. Long-term trends trump fluctuations.
10. Return on Invested Capital (ROIC)
EPS and free cash flow tell us whether a company was profitable while growing its revenue. But was it capital-efficient? A company’s ROIC explains this by showing how much operating profit it makes compared to the money it has raised (debt and equity).
XPO historically did a mediocre job investing in profitable growth initiatives. Its five-year average ROIC was 8%, somewhat low compared to the best industrials companies that consistently pump out 20%+.
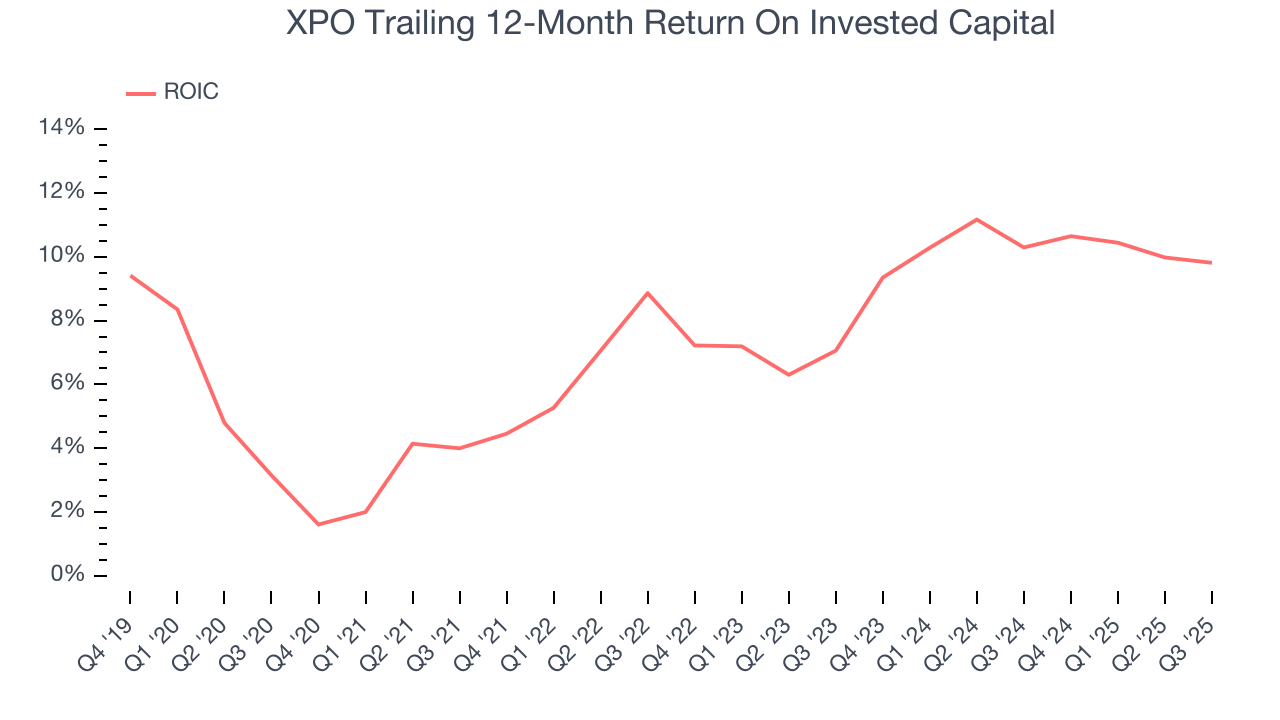
We like to invest in businesses with high returns, but the trend in a company’s ROIC is what often surprises the market and moves the stock price. Over the last few years, XPO’s ROIC averaged 3.6 percentage point increases each year. This is a good sign, and we hope the company can continue improving.
11. Balance Sheet Assessment
XPO reported $335 million of cash and $4.11 billion of debt on its balance sheet in the most recent quarter. As investors in high-quality companies, we primarily focus on two things: 1) that a company’s debt level isn’t too high and 2) that its interest payments are not excessively burdening the business.
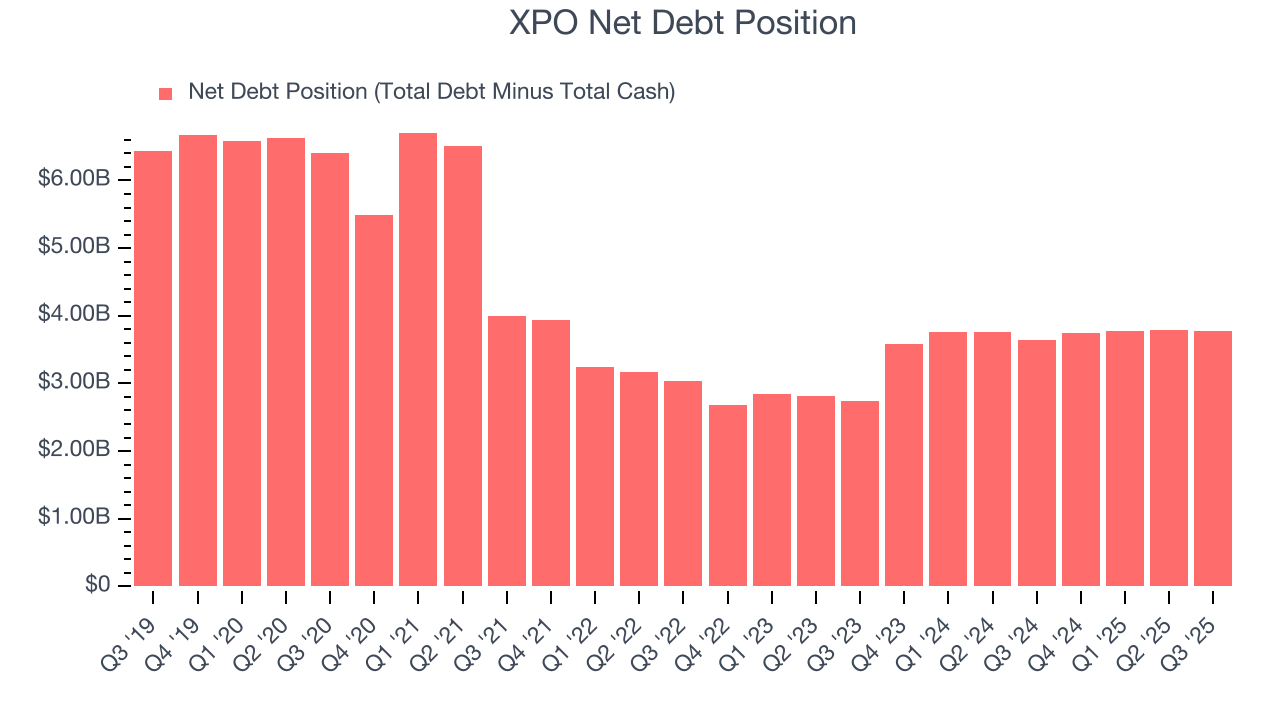
With $1.26 billion of EBITDA over the last 12 months, we view XPO’s 3.0× net-debt-to-EBITDA ratio as safe. We also see its $111 million of annual interest expenses as appropriate. The company’s profits give it plenty of breathing room, allowing it to continue investing in growth initiatives.
12. Key Takeaways from XPO’s Q3 Results
We were also glad its revenue and EPS outperformed Wall Street’s estimates. Overall, we think this was a solid quarter with some key areas of upside. The stock traded up 1.6% to $126.75 immediately after reporting.
13. Is Now The Time To Buy XPO?
Updated: January 24, 2026 at 10:12 PM EST
Before deciding whether to buy XPO or pass, we urge investors to consider business quality, valuation, and the latest quarterly results.
We see the value of companies helping their customers, but in the case of XPO, we’re out. For starters, its revenue has declined over the last five years. And while its spectacular EPS growth over the last five years shows its profits are trickling down to shareholders, the downside is its low gross margins indicate some combination of competitive pressures and high production costs. On top of that, its cash profitability fell over the last five years.
XPO’s P/E ratio based on the next 12 months is 37.5x. This valuation tells us a lot of optimism is priced in - you can find more timely opportunities elsewhere.
Wall Street analysts have a consensus one-year price target of $156.08 on the company (compared to the current share price of $150).