Xylem (XYL)
Xylem is interesting. It’s not only rapidly winning market share but also boasts impressive unit economics, a winning formula.― StockStory Analyst Team
1. News
2. Summary
Why Xylem Is Interesting
Formed through a spinoff, Xylem (NYSE:XYL) manufactures and services engineered products across a wide variety of applications primarily in the water sector.
- Earnings growth has massively outpaced its peers over the last five years as its EPS has compounded at 17.7% annually
- Market share has increased this cycle as its 12.8% annual revenue growth over the last five years was exceptional
- On the flip side, its estimated sales growth of 3.9% for the next 12 months implies demand will slow from its two-year trend


Xylem shows some signs of a high-quality business. If you’re a believer, the price looks fair.
Why Is Now The Time To Buy Xylem?


Xylem’s stock price of $140.18 implies a valuation ratio of 26.3x forward P/E. After scanning the names across industrials, we conclude that the multiple is deserved for the revenue growth you get.
If you think the market is undervaluing the company, now could be a good time to build a position.
3. Xylem (XYL) Research Report: Q4 CY2025 Update
Water technology company Xylem (NYSE:XYL) reported Q4 CY2025 results topping the market’s revenue expectations, with sales up 6.3% year on year to $2.40 billion. On the other hand, the company’s full-year revenue guidance of $9.15 billion at the midpoint came in 1.9% below analysts’ estimates. Its non-GAAP profit of $1.42 per share was 0.8% above analysts’ consensus estimates.
Xylem (XYL) Q4 CY2025 Highlights:
- Revenue: $2.40 billion vs analyst estimates of $2.37 billion (6.3% year-on-year growth, 1.1% beat)
- Adjusted EPS: $1.42 vs analyst estimates of $1.41 (0.8% beat)
- Adjusted EBITDA: $557 million vs analyst estimates of $545.9 million (23.2% margin, 2% beat)
- Adjusted EPS guidance for the upcoming financial year 2026 is $5.48 at the midpoint, missing analyst estimates by 1.3%
- Operating Margin: 14.7%, up from 11.8% in the same quarter last year
- Free Cash Flow Margin: 19.2%, down from 21.1% in the same quarter last year
- Organic Revenue rose 7% year on year (beat)
- Market Capitalization: $34.13 billion
Company Overview
Formed through a spinoff, Xylem (NYSE:XYL) manufactures and services engineered products across a wide variety of applications primarily in the water sector.
Xylem was established in 2011 when it was spun off from ITT Corporation, which had been a diversified manufacturer of critical components for the energy, transportation, and industrial markets. Named after the tissue in plants that transports water, Xylem was formed to focus specifically on the technology and equipment for water solutions and services. Over the years, the company has expanded its portfolio and global footprint through strategic acquisitions, including the notable purchase of Evoqua, which significantly enhanced its range of water treatment products and services.
Xylem plays a critical role in addressing the growing demands and challenges of water scarcity, quality, and affordability through solutions that span the entire water cycle, from the supply and treatment of drinking water to wastewater collection, and return to the environment. Xylem's offerings include transport, treatment, smart metering, digital software solutions, and infrastructure assessment services. These are directed towards a customer base that includes water and wastewater utilities, EPC firms, and third-party contractors involved in the design and construction of water infrastructure networks. For instance, an energy company might use Xylem’s remote monitoring and leak detection systems to quickly identify and solve any issues that may arise.
Xylem generates revenue through the sale of its water technology products and services. The company revenue streams also include recurring revenue from short-term deionization and maintenance contracts, as well as, long-term contracts such as build-own-operate agreements. Additionally Xylem has focused on increasing users on its digital platforms providing another source of recurring revenue. The company utilizes an acquisition strategy of acquiring high quality companies that will significantly increase operational value. This is exemplified by its acquisition of Sensus for $1.7 billion for its FlexNet communications network technology and its acquisition of Evoqua for $7.5 billion in 2023.
4. Water Infrastructure
Trends towards conservation and reducing groundwater depletion are putting water infrastructure and treatment products front and center. Companies that can innovate and create solutions–especially automated or connected solutions–to address these thematic trends will create incremental demand and speed up replacement cycles. On the other hand, water infrastructure and treatment companies are at the whim of economic cycles. Consumer spending and interest rates, for example, can greatly impact the industrial production that drives demand for these companies’ offerings.
Competitors offering similar products include Sulzer (SWX:SUN), Veolia (EPA:VIE), and Graco (NYSE:GGG).
5. Revenue Growth
Examining a company’s long-term performance can provide clues about its quality. Any business can put up a good quarter or two, but many enduring ones grow for years. Luckily, Xylem’s sales grew at an excellent 13.1% compounded annual growth rate over the last five years. Its growth beat the average industrials company and shows its offerings resonate with customers, a helpful starting point for our analysis.
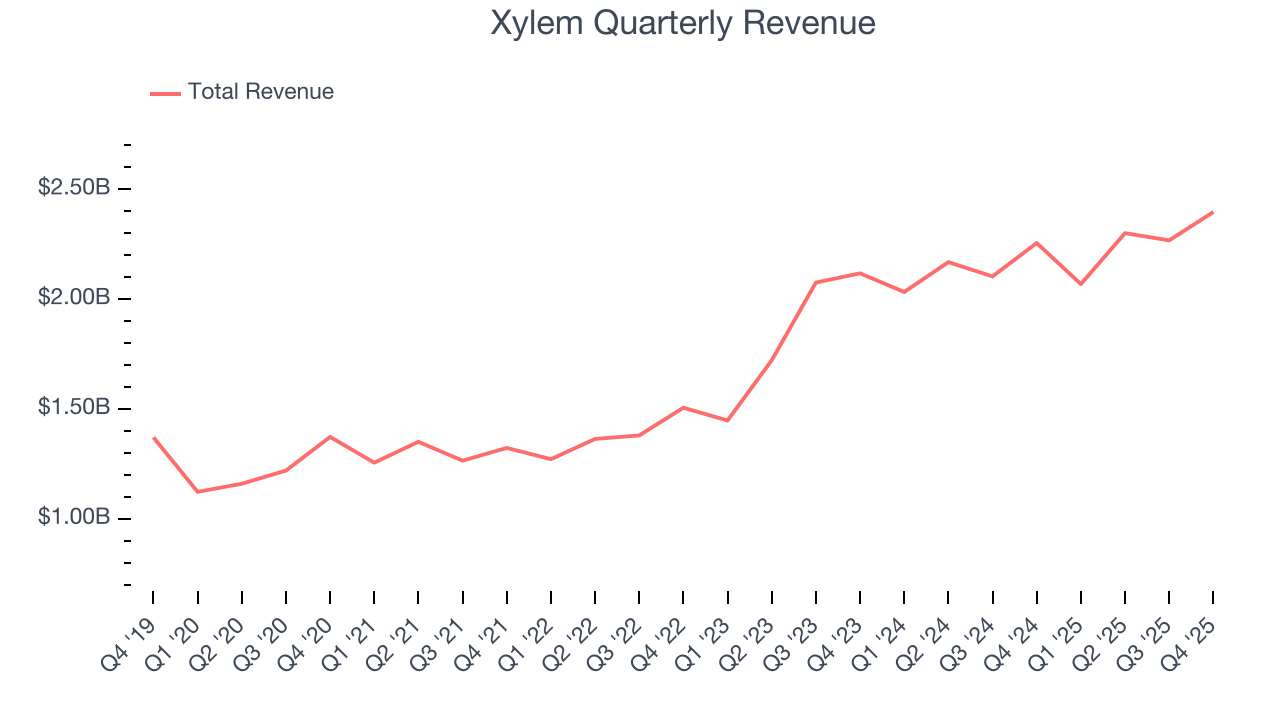
Long-term growth is the most important, but within industrials, a half-decade historical view may miss new industry trends or demand cycles. Xylem’s annualized revenue growth of 10.8% over the last two years is below its five-year trend, but we still think the results suggest healthy demand. 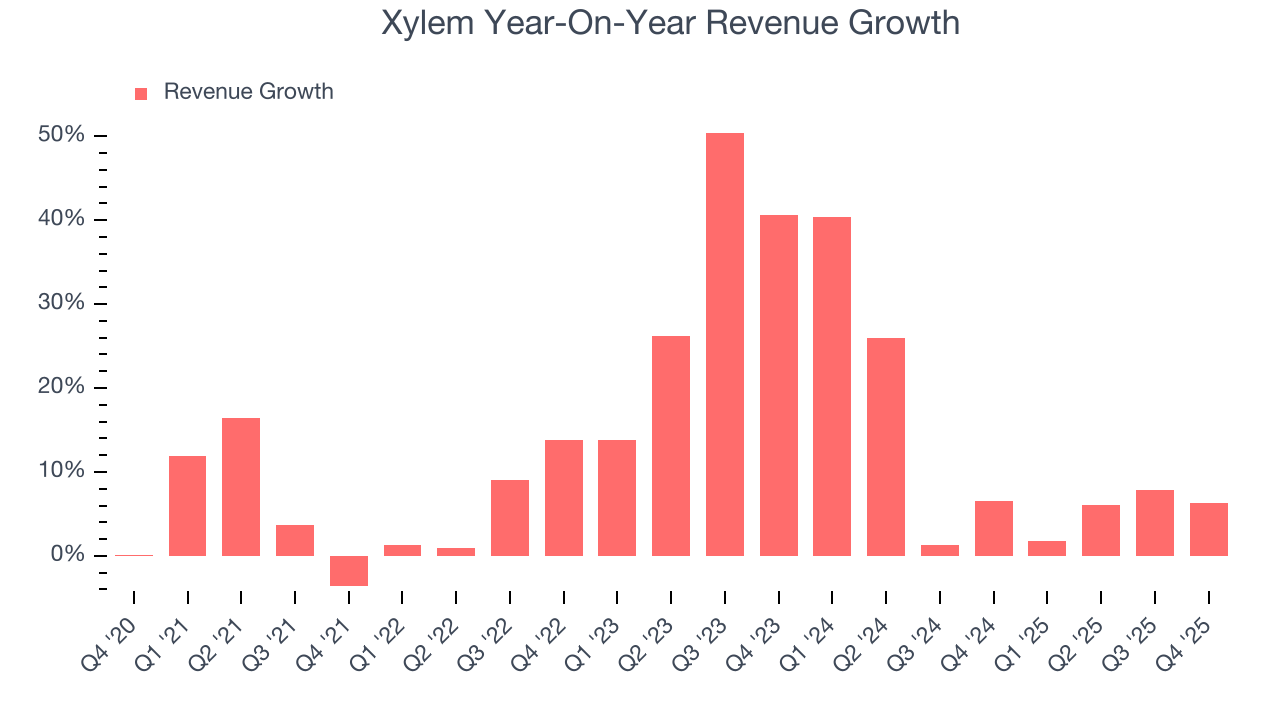
We can dig further into the company’s sales dynamics by analyzing its organic revenue, which strips out one-time events like acquisitions and currency fluctuations that don’t accurately reflect its fundamentals. Over the last two years, Xylem’s organic revenue averaged 5.8% year-on-year growth. Because this number is lower than its two-year revenue growth, we can see that some mixture of acquisitions and foreign exchange rates boosted its headline results. 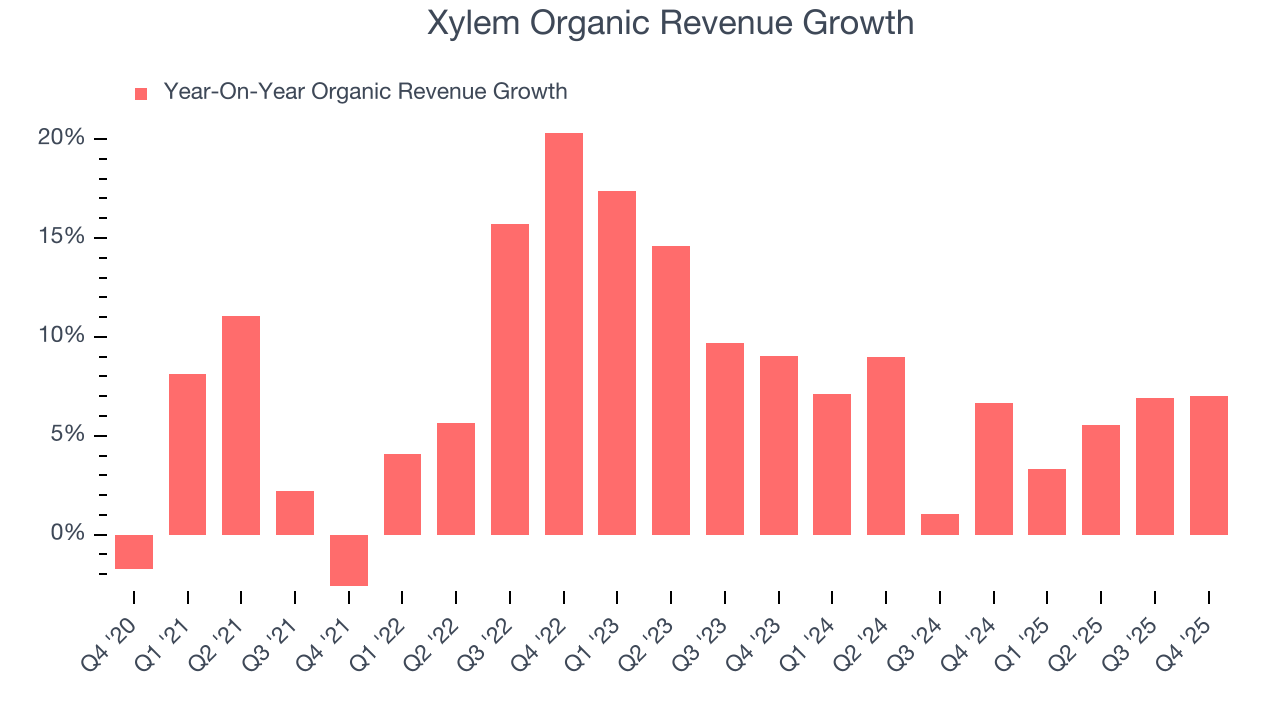
This quarter, Xylem reported year-on-year revenue growth of 6.3%, and its $2.40 billion of revenue exceeded Wall Street’s estimates by 1.1%.
Looking ahead, sell-side analysts expect revenue to grow 3.1% over the next 12 months, a deceleration versus the last two years. This projection is underwhelming and suggests its products and services will see some demand headwinds. At least the company is tracking well in other measures of financial health.
6. Gross Margin & Pricing Power
Xylem’s unit economics are great compared to the broader industrials sector and signal that it enjoys product differentiation through quality or brand. As you can see below, it averaged an excellent 37.7% gross margin over the last five years. That means Xylem only paid its suppliers $62.34 for every $100 in revenue. 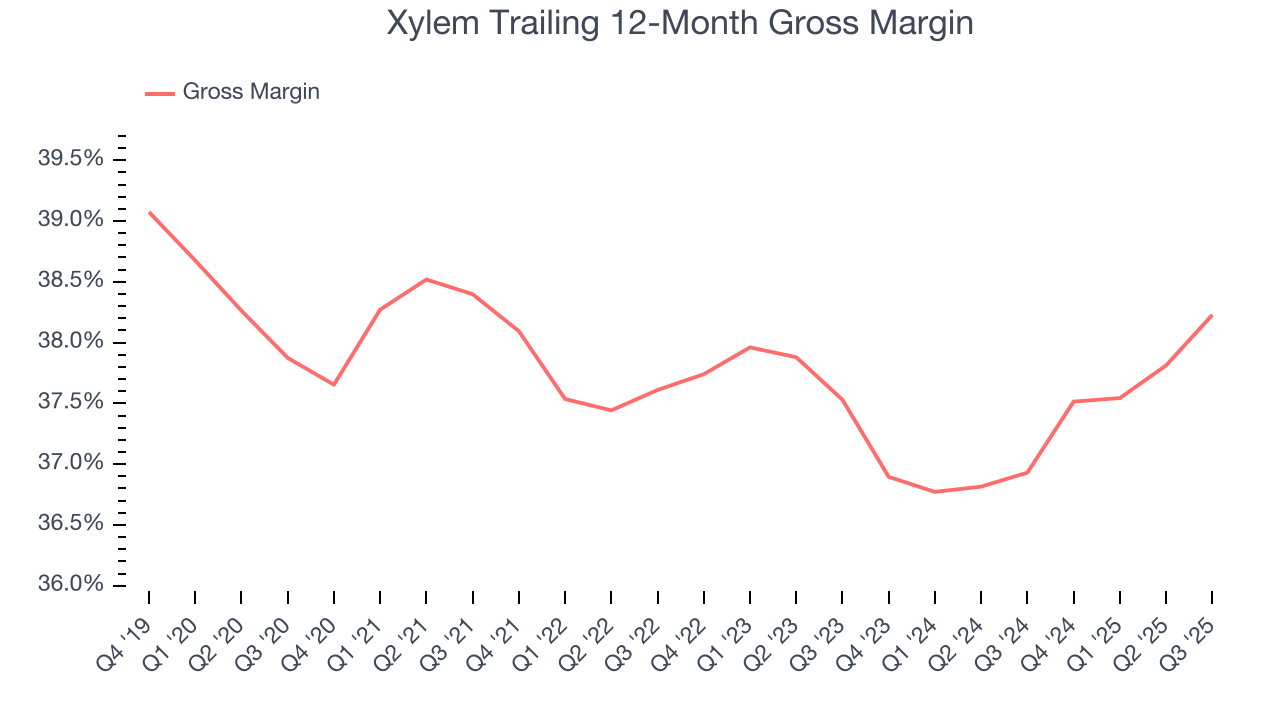
7. Operating Margin
Operating margin is an important measure of profitability as it shows the portion of revenue left after accounting for all core expenses – everything from the cost of goods sold to advertising and wages. It’s also useful for comparing profitability across companies with different levels of debt and tax rates because it excludes interest and taxes.
Xylem has managed its cost base well over the last five years. It demonstrated solid profitability for an industrials business, producing an average operating margin of 11.5%. This result isn’t surprising as its high gross margin gives it a favorable starting point.
Analyzing the trend in its profitability, Xylem’s operating margin rose by 2.3 percentage points over the last five years, as its sales growth gave it operating leverage.
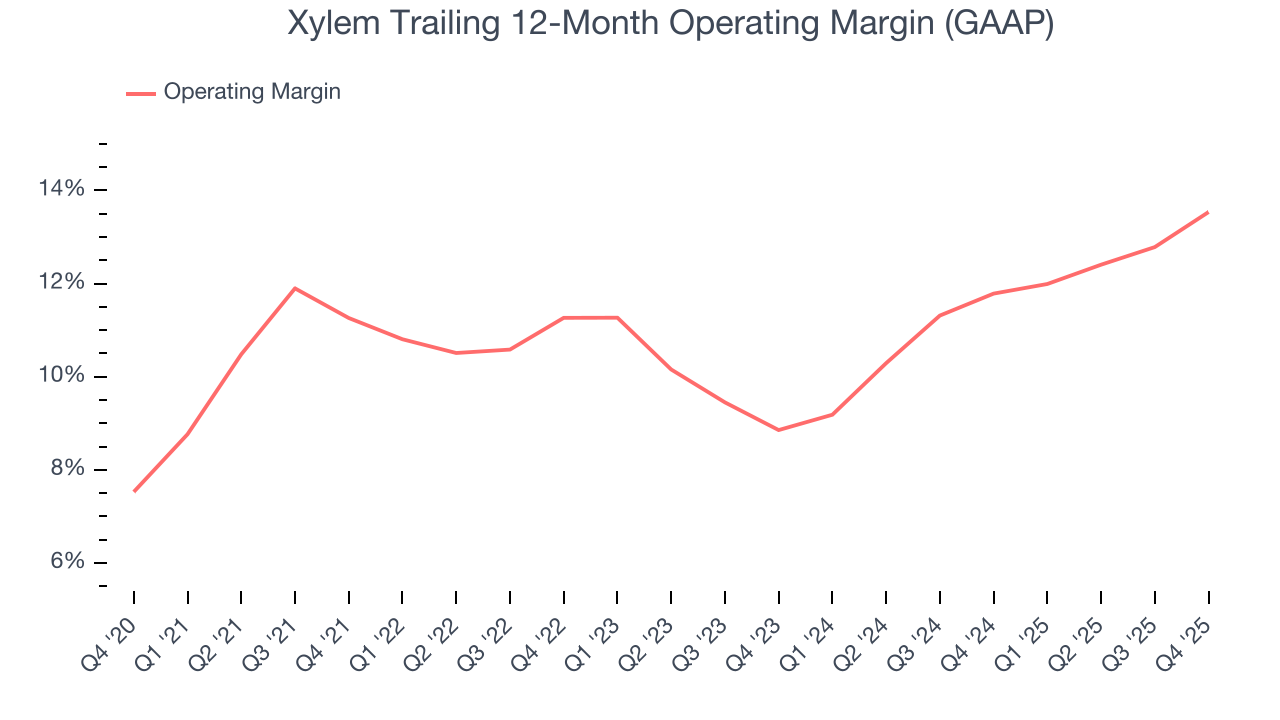
In Q4, Xylem generated an operating margin profit margin of 14.7%, up 2.9 percentage points year on year. The increase was a welcome development and shows its expenses recently grew slower than its revenue, leading to higher efficiency.
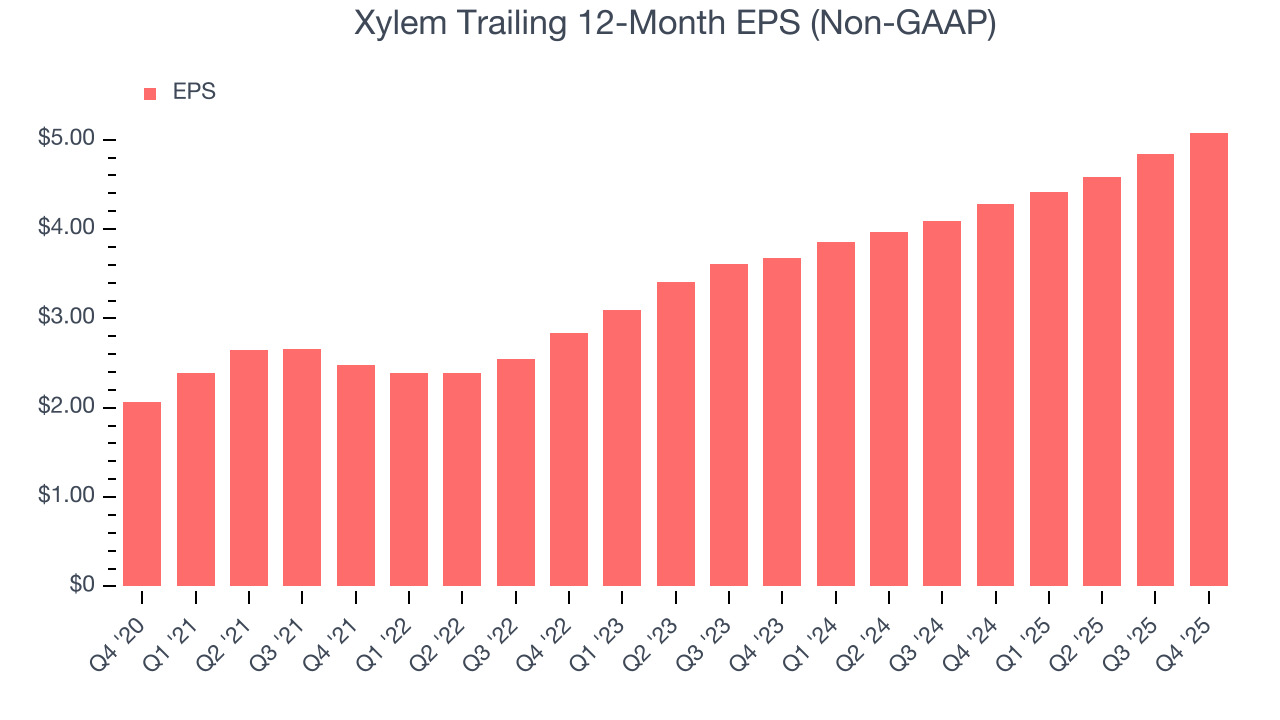
8. Earnings Per Share
Revenue trends explain a company’s historical growth, but the long-term change in earnings per share (EPS) points to the profitability of that growth – for example, a company could inflate its sales through excessive spending on advertising and promotions.
Xylem’s EPS grew at an astounding 19.8% compounded annual growth rate over the last five years, higher than its 13.1% annualized revenue growth. This tells us the company became more profitable on a per-share basis as it expanded.
Diving into the nuances of Xylem’s earnings can give us a better understanding of its performance. As we mentioned earlier, Xylem’s operating margin expanded by 2.3 percentage points over the last five years. This was the most relevant factor (aside from the revenue impact) behind its higher earnings; interest expenses and taxes can also affect EPS but don’t tell us as much about a company’s fundamentals.
Like with revenue, we analyze EPS over a shorter period to see if we are missing a change in the business.
For Xylem, its two-year annual EPS growth of 17.5% was lower than its five-year trend. We still think its growth was good and hope it can accelerate in the future.
In Q4, Xylem reported adjusted EPS of $1.42, up from $1.18 in the same quarter last year. This print was close to analysts’ estimates. Over the next 12 months, Wall Street expects Xylem’s full-year EPS of $5.08 to grow 9%.
9. Cash Is King
If you’ve followed StockStory for a while, you know we emphasize free cash flow. Why, you ask? We believe that in the end, cash is king, and you can’t use accounting profits to pay the bills.
Xylem has shown impressive cash profitability, enabling it to ride out cyclical downturns more easily while maintaining its investments in new and existing offerings. The company’s free cash flow margin averaged 8.8% over the last five years, better than the broader industrials sector.
Taking a step back, we can see that Xylem’s margin expanded by 3.7 percentage points during that time. This shows the company is heading in the right direction, and we can see it became a less capital-intensive business because its free cash flow profitability rose more than its operating profitability.
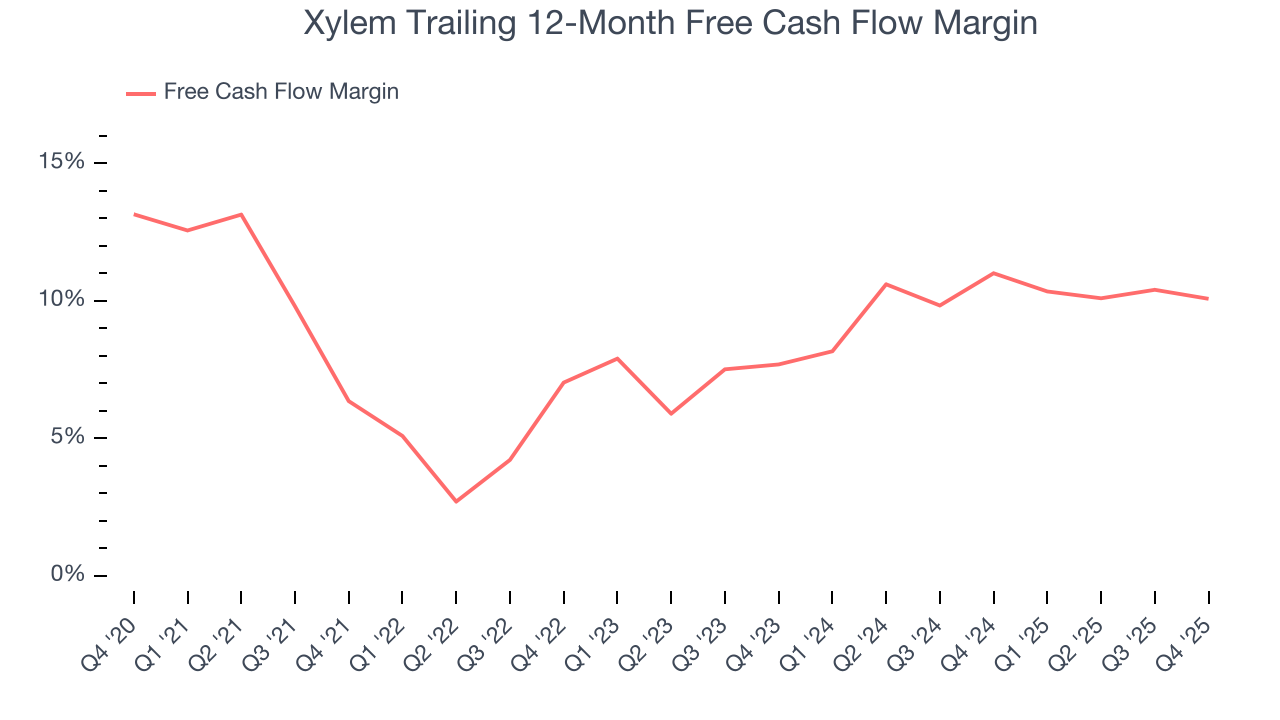
Xylem’s free cash flow clocked in at $460 million in Q4, equivalent to a 19.2% margin. The company’s cash profitability regressed as it was 1.9 percentage points lower than in the same quarter last year, but it’s still above its five-year average. We wouldn’t read too much into this quarter’s decline because investment needs can be seasonal, causing short-term swings. Long-term trends are more important.
10. Return on Invested Capital (ROIC)
EPS and free cash flow tell us whether a company was profitable while growing its revenue. But was it capital-efficient? Enter ROIC, a metric showing how much operating profit a company generates relative to the money it has raised (debt and equity).
Although Xylem has shown solid business quality lately, it historically did a mediocre job investing in profitable growth initiatives. Its five-year average ROIC was 8.2%, somewhat low compared to the best industrials companies that consistently pump out 20%+.
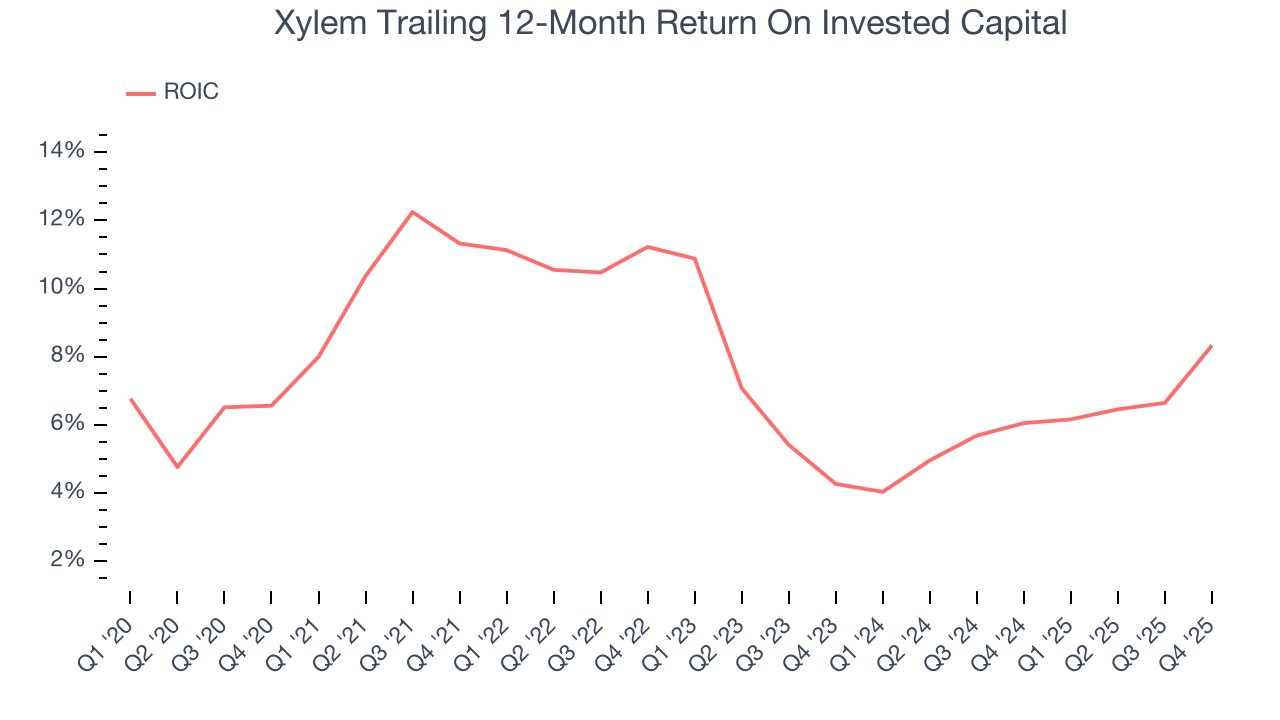
We like to invest in businesses with high returns, but the trend in a company’s ROIC is what often surprises the market and moves the stock price. On average, Xylem’s ROIC decreased by 4.1 percentage points annually each year over the last few years. If its returns keep falling, it could suggest its profitable growth opportunities are drying up. We’ll keep a close eye.
11. Balance Sheet Assessment
Xylem reported $1.48 billion of cash and $1.94 billion of debt on its balance sheet in the most recent quarter. As investors in high-quality companies, we primarily focus on two things: 1) that a company’s debt level isn’t too high and 2) that its interest payments are not excessively burdening the business.
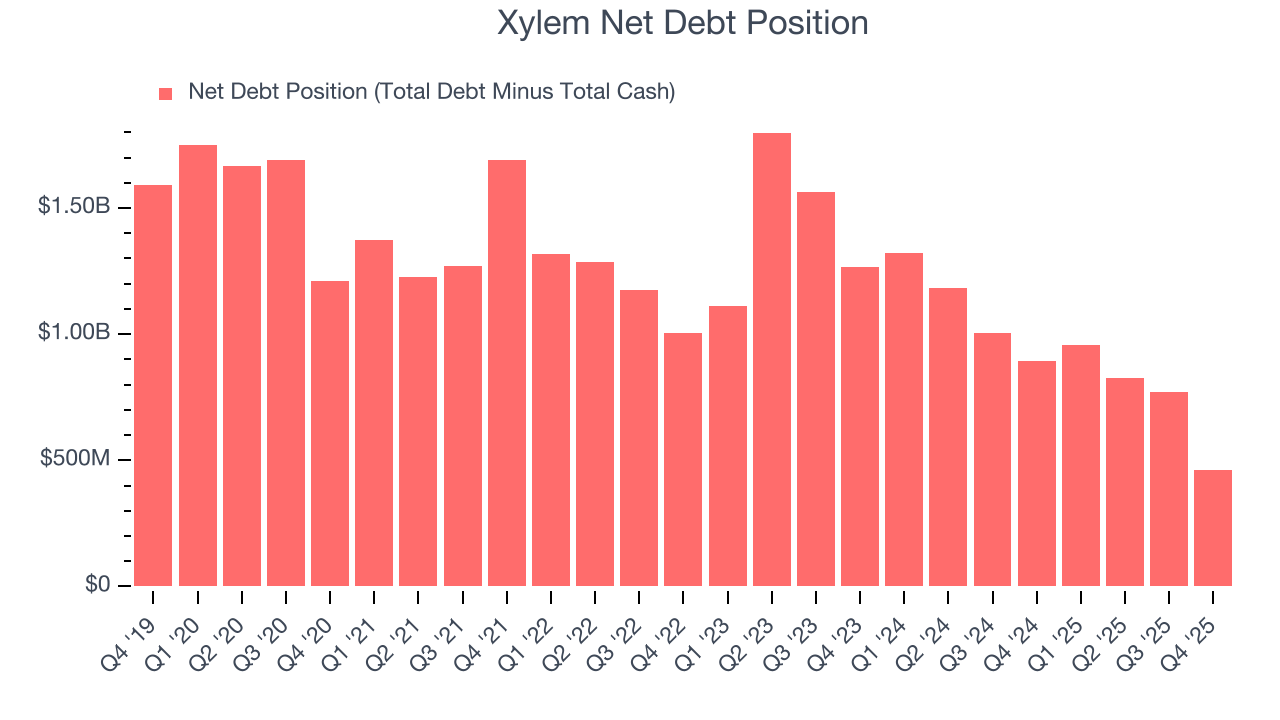
With $2.15 billion of EBITDA over the last 12 months, we view Xylem’s 0.2× net-debt-to-EBITDA ratio as safe. We also see its $29 million of annual interest expenses as appropriate. The company’s profits give it plenty of breathing room, allowing it to continue investing in growth initiatives.
12. Key Takeaways from Xylem’s Q4 Results
We were impressed by how significantly Xylem blew past analysts’ organic revenue expectations this quarter. We were also happy its revenue narrowly outperformed Wall Street’s estimates. On the other hand, its full-year revenue guidance missed and its full-year EPS guidance fell slightly short of Wall Street’s estimates. Overall, this print was mixed. Investors were likely hoping for more, and shares traded down 3.5% to $135.30 immediately after reporting.
13. Is Now The Time To Buy Xylem?
Updated: February 10, 2026 at 7:34 AM EST
A common mistake we notice when investors are deciding whether to buy a stock or not is that they simply look at the latest earnings results. Business quality and valuation matter more, so we urge you to understand these dynamics as well.
For starters, its revenue growth was impressive over the last five years. And while its diminishing returns show management's recent bets still have yet to bear fruit, its astounding EPS growth over the last five years shows its profits are trickling down to shareholders. On top of that, Xylem’s rising cash profitability gives it more optionality.
Xylem’s P/E ratio based on the next 12 months is 25.3x. When scanning the industrials space, Xylem trades at a fair valuation. If you trust the business and its direction, this is an ideal time to buy.
Wall Street analysts have a consensus one-year price target of $166.59 on the company (compared to the current share price of $135.30), implying they see 23.1% upside in buying Xylem in the short term.