
ThredUp (TDUP)
We wouldn’t recommend ThredUp. Its poor sales growth shows demand is soft and its negative returns on capital suggest it destroyed value.― StockStory Analyst Team
1. News


2. Summary
Why We Think ThredUp Will Underperform
Founded to revolutionize thrifting, ThredUp (NASDAQ:TDUP) is a leading online fashion resale marketplace offering a wide selection of gently-used clothing and accessories.
- Annual revenue growth of 7.6% over the last five years was below our standards for the consumer discretionary sector
- Poor expense management has led to operating margin losses
- Ability to fund investments or reward shareholders with increased buybacks or dividends is restricted by its weak free cash flow margin of -0.3% for the last two years


ThredUp falls below our quality standards. There are superior opportunities elsewhere.
Why There Are Better Opportunities Than ThredUp


ThredUp is trading at $3.41 per share, or 21.5x forward EV-to-EBITDA. Not only is ThredUp’s multiple richer than most consumer discretionary peers, but it’s also expensive for its revenue characteristics.
There are stocks out there featuring similar valuation multiples with better fundamentals. We prefer to invest in those.
3. ThredUp (TDUP) Research Report: Q4 CY2025 Update
Online fashion resale marketplace ThredUp (NASDAQ:TDUP) announced better-than-expected revenue in Q4 CY2025, with sales up 18.5% year on year to $79.7 million. The company expects next quarter’s revenue to be around $80 million, close to analysts’ estimates. Its GAAP loss of $0.04 per share was in line with analysts’ consensus estimates.
ThredUp (TDUP) Q4 CY2025 Highlights:
- Revenue: $79.7 million vs analyst estimates of $77.18 million (18.5% year-on-year growth, 3.3% beat)
- EPS (GAAP): -$0.04 vs analyst estimates of -$0.04 (in line)
- Adjusted EBITDA: $2.93 million vs analyst estimates of $2.3 million (3.7% margin, relatively in line)
- Revenue Guidance for Q1 CY2026 is $80 million at the midpoint, roughly in line with what analysts were expecting
- Operating Margin: -8.4%, up from -12.1% in the same quarter last year
- Free Cash Flow was -$3.19 million compared to -$1.8 million in the same quarter last year
- Orders: 1.65 million, up 376,000 year on year
- Market Capitalization: $610.7 million
Company Overview
Founded to revolutionize thrifting, ThredUp (NASDAQ:TDUP) is a leading online fashion resale marketplace offering a wide selection of gently-used clothing and accessories.
The company addresses a large problem in fashion: people often have wardrobes filled with items they rarely wear. ThredUp solves this by creating a market to buy and sell used fashion goods, promoting a circular fashion economy that minimizes waste and reduces the environmental footprint of the industry.
Given the used nature of products listed on its marketplace, the company places a strong emphasis on quality control. Every item is inspected to ensure secondhand shopping on its platform is as reliable as buying new. Combined with a user-friendly interface and transparent pricing, ThredUp makes the thrifting experience accessible and convenient.
The company generates revenue by charging sellers a commission or processing fee for each item they sell on the platform. This fee varies depending on the selling price of the item, typically ranging from 5% to 20% of the sale price.
4. Consumer Discretionary - Apparel and Accessories
The Consumer Discretionary sector, by definition, is made up of companies selling non-essential goods and services. When economic conditions deteriorate or tastes shift, consumers can easily cut back or eliminate these purchases. For long-term investors with five-year holding periods, this creates a structural challenge: the sector is inherently hit-driven, with low switching costs and fickle customers. As a result, only a handful of companies can reliably grow demand and compound earnings over long periods, which is why our bar is high and High Quality ratings are rare.
Apparel and accessories companies design, brand, and distribute clothing, handbags, jewelry, and related lifestyle products, often spanning multiple price tiers. Tailwinds include premiumization trends (consumers trading up for perceived quality), international expansion into emerging markets, and growing digital commerce penetration. However, these businesses face headwinds from highly cyclical demand, intense promotional environments, and counterfeit competition undermining brand equity. Tariff volatility and sourcing concentration in a handful of countries add risk. Additionally, rapidly changing fashion cycles and the rise of ultra-fast-fashion digital competitors compress product life cycles and make demand forecasting exceptionally difficult.
ThredUp’s main competitors are Poshmark (owned by Naver Corporation, KRX:035420), The RealReal (NASDAQ:REAL), Depop (owned by Etsy NASDAQ:ETSY), and Mercari (OTCMKTS:MCARY).
5. Revenue Growth
Examining a company’s long-term performance can provide clues about its quality. Any business can have short-term success, but a top-tier one grows for years. Regrettably, ThredUp’s sales grew at a weak 7.6% compounded annual growth rate over the last five years. This fell short of our benchmark for the consumer discretionary sector and is a poor baseline for our analysis.
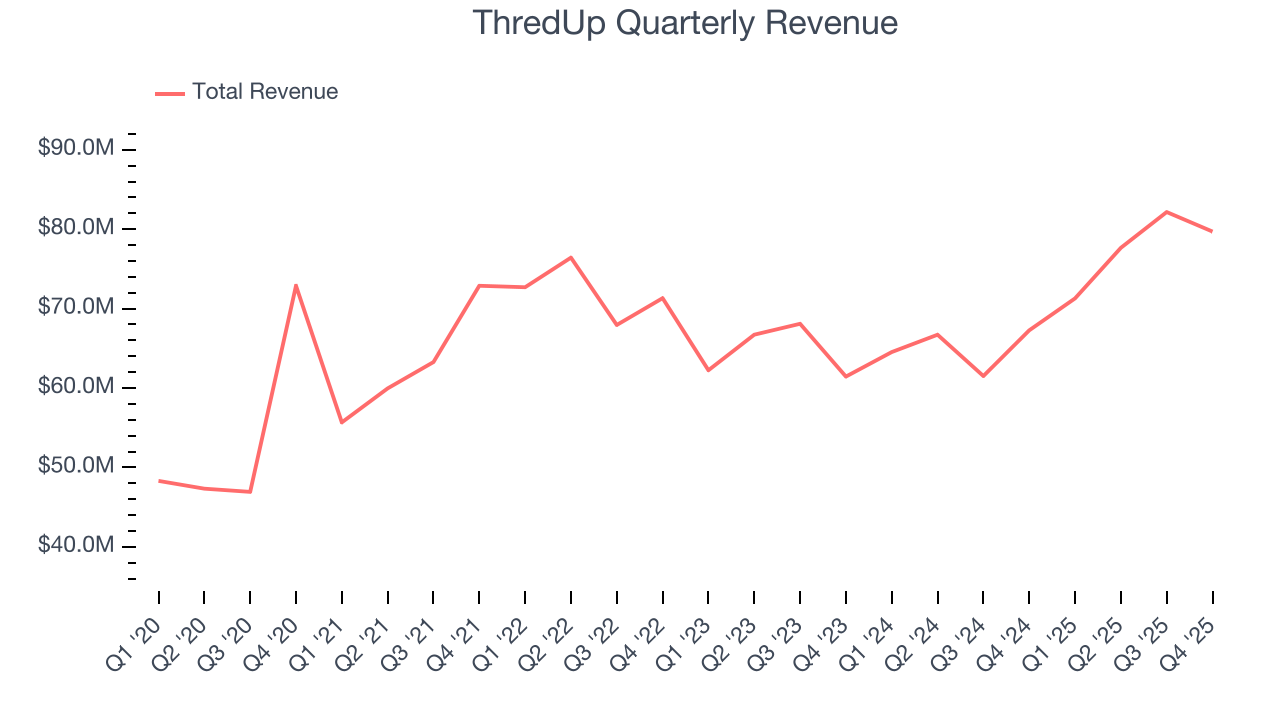
Long-term growth is the most important, but within consumer discretionary, product cycles are short and revenue can be hit-driven due to rapidly changing trends and consumer preferences. ThredUp’s annualized revenue growth of 9.7% over the last two years is above its five-year trend, which is encouraging. 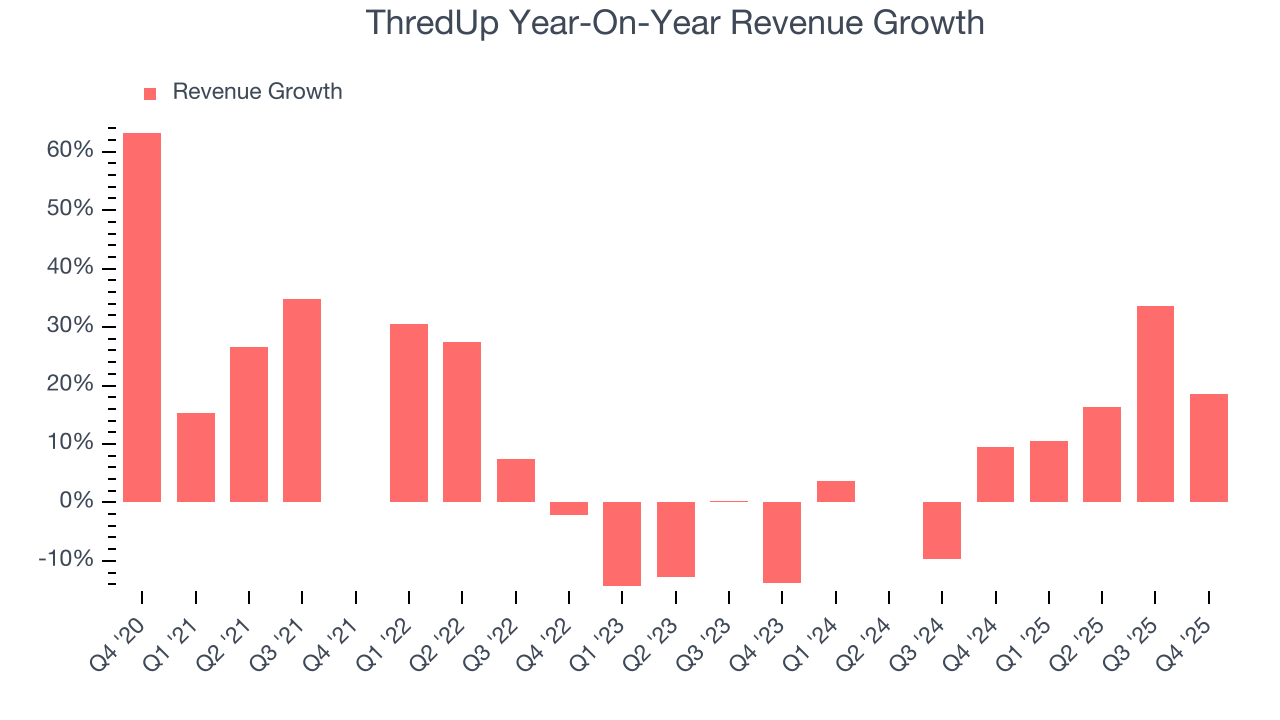
We can dig further into the company’s revenue dynamics by analyzing its number of orders, which reached 1.65 million in the latest quarter. Over the last two years, ThredUp’s orders averaged 7.6% year-on-year declines. Because this number is lower than its revenue growth during the same period, we can see the company’s monetization has risen. 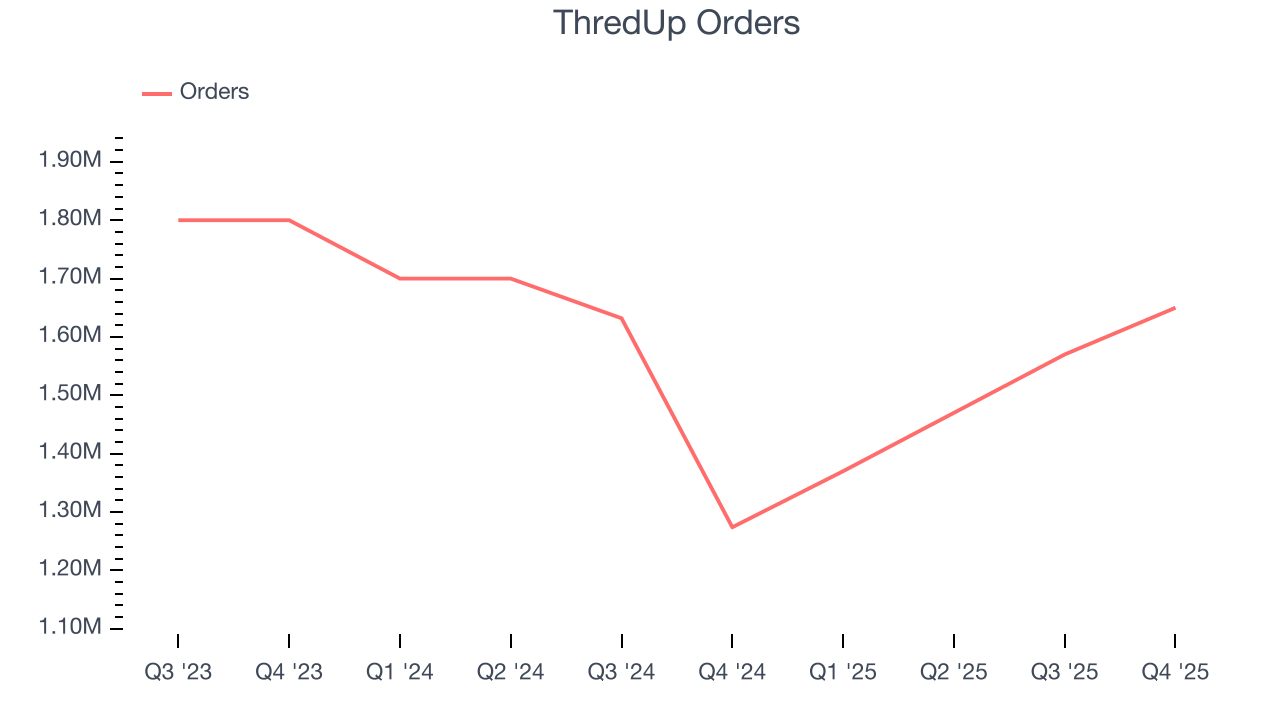
This quarter, ThredUp reported year-on-year revenue growth of 18.5%, and its $79.7 million of revenue exceeded Wall Street’s estimates by 3.3%. Company management is currently guiding for a 12.2% year-on-year increase in sales next quarter.
Looking further ahead, sell-side analysts expect revenue to grow 11% over the next 12 months, similar to its two-year rate. While this projection implies its newer products and services will fuel better top-line performance, it is still below average for the sector.
6. Operating Margin
Operating margin is a key measure of profitability. Think of it as net income - the bottom line - excluding the impact of taxes and interest on debt, which are less connected to business fundamentals.
ThredUp’s operating margin has risen over the last 12 months, but it still averaged negative 10.9% over the last two years. This is due to its large expense base and inefficient cost structure.
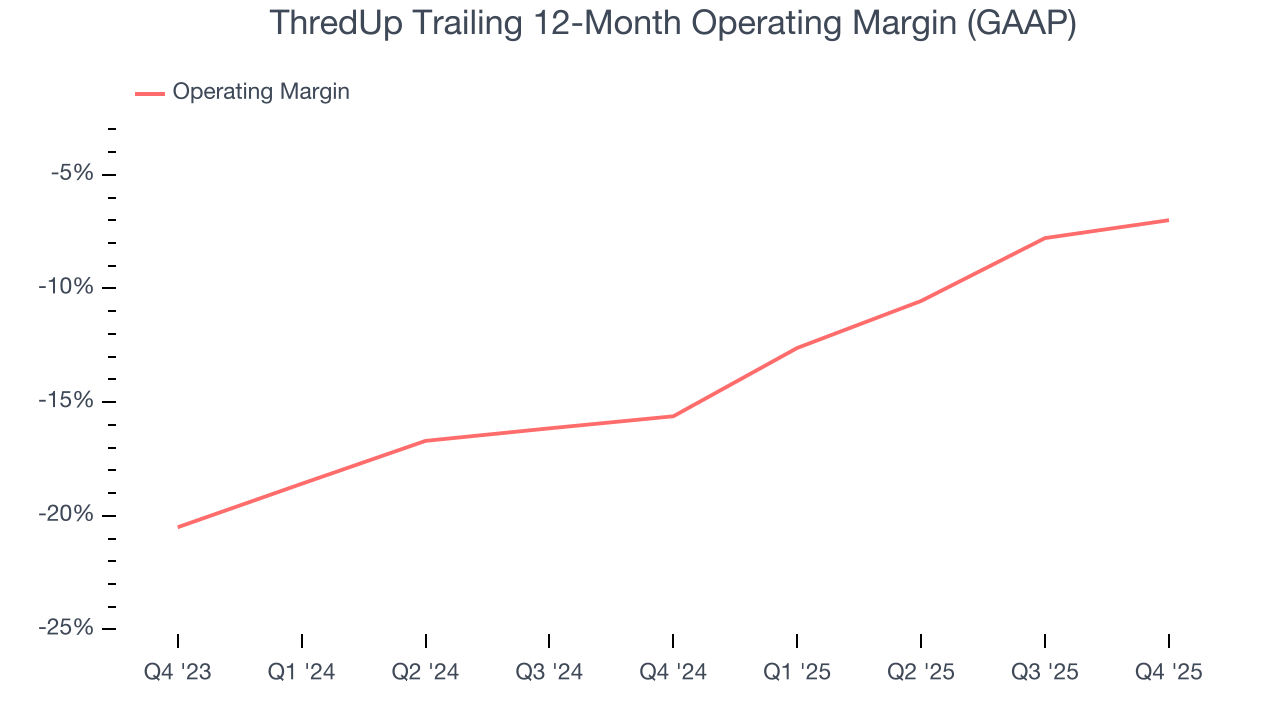
This quarter, ThredUp generated a negative 8.4% operating margin. The company's consistent lack of profits raise a flag.
7. Earnings Per Share
We track the long-term change in earnings per share (EPS) for the same reason as long-term revenue growth. Compared to revenue, however, EPS highlights whether a company’s growth is profitable.
Although ThredUp’s full-year earnings are still negative, it reduced its losses and improved its EPS by 47.9% annually over the last five years. The next few quarters will be critical for assessing its long-term profitability.
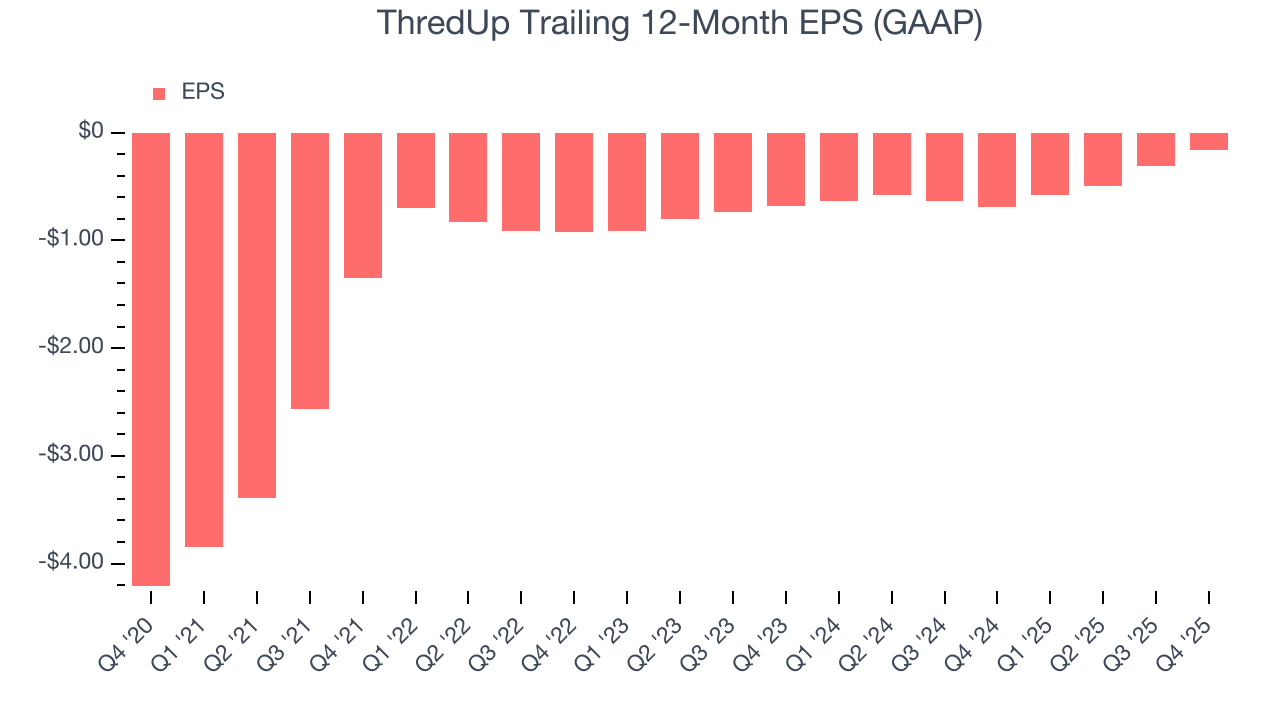
In Q4, ThredUp reported EPS of negative $0.04, up from negative $0.19 in the same quarter last year. This print was close to analysts’ estimates. Over the next 12 months, Wall Street expects ThredUp to improve its earnings losses. Analysts forecast its full-year EPS of negative $0.16 will advance to negative $0.09.
8. Cash Is King
Free cash flow isn't a prominently featured metric in company financials and earnings releases, but we think it's telling because it accounts for all operating and capital expenses, making it tough to manipulate. Cash is king.
ThredUp broke even from a free cash flow perspective over the last two years, giving the company limited opportunities to return capital to shareholders.
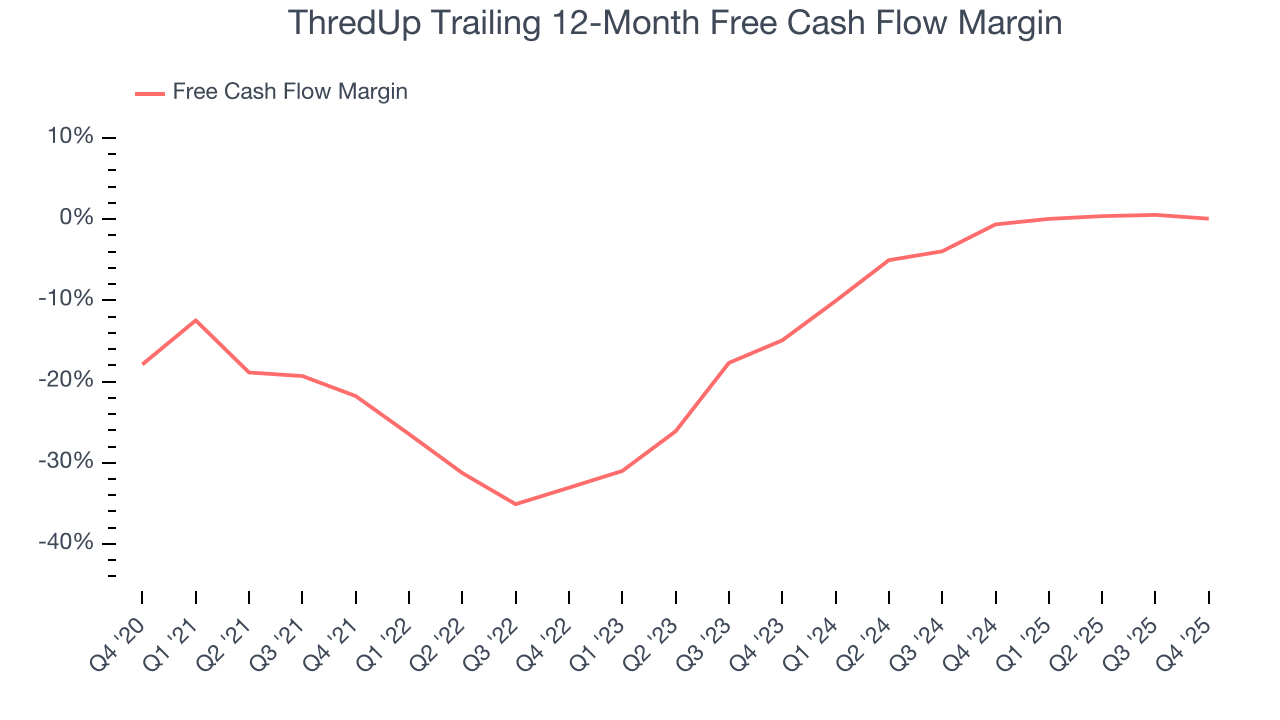
ThredUp burned through $3.19 million of cash in Q4, equivalent to a negative 4% margin. The company’s cash burn was similar to its $1.8 million of lost cash in the same quarter last year.
Over the next year, analysts predict ThredUp’s cash conversion will improve. Their consensus estimates imply its breakeven free cash flow margin for the last 12 months will increase to 5.2%, giving it more optionality.
9. Return on Invested Capital (ROIC)
EPS and free cash flow tell us whether a company was profitable while growing its revenue. But was it capital-efficient? Enter ROIC, a metric showing how much operating profit a company generates relative to the money it has raised (debt and equity).
ThredUp’s four-year average ROIC was negative 50.4%, meaning management lost money while trying to expand the business. Its returns were among the worst in the consumer discretionary sector.
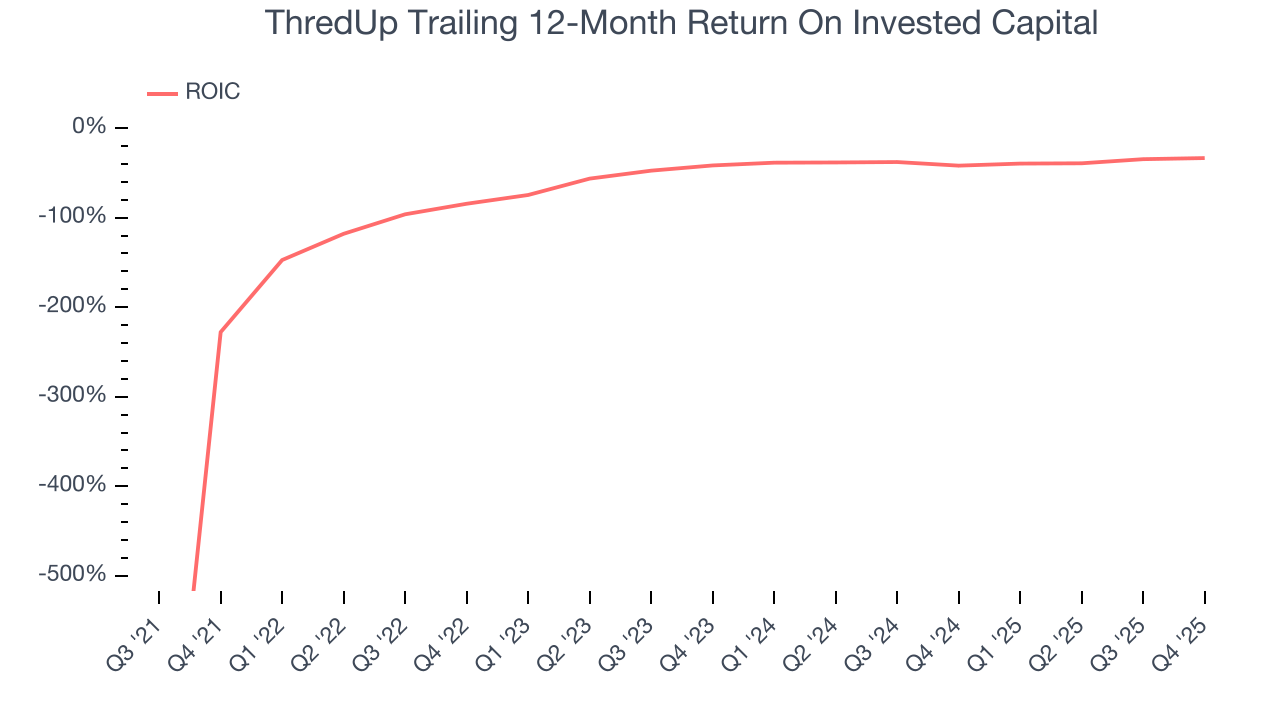
We like to invest in businesses with high returns, but the trend in a company’s ROIC is what often surprises the market and moves the stock price. Over the last few years, ThredUp’s ROIC has increased. This is a good sign, but we recognize its lack of profitable growth during the COVID era was the primary reason for the change.
10. Balance Sheet Assessment
ThredUp reported $48.13 million of cash and $52.13 million of debt on its balance sheet in the most recent quarter. As investors in high-quality companies, we primarily focus on two things: 1) that a company’s debt level isn’t too high and 2) that its interest payments are not excessively burdening the business.
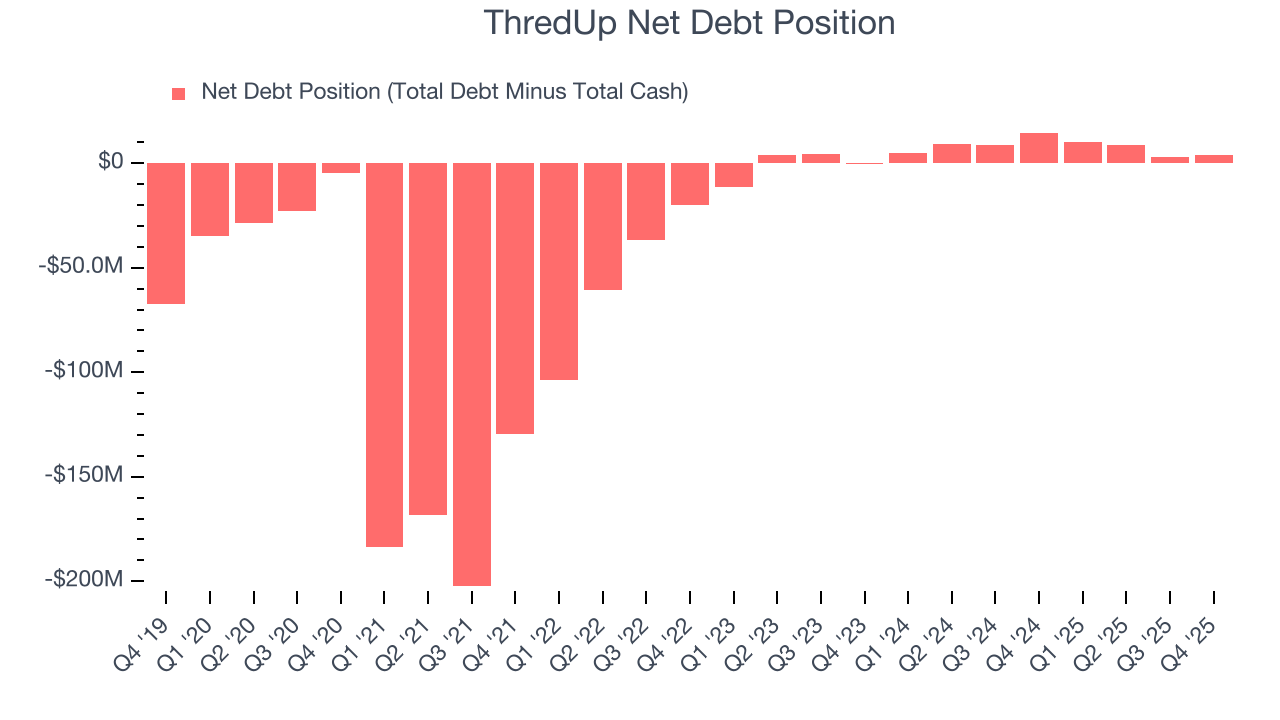
With $13.52 million of EBITDA over the last 12 months, we view ThredUp’s 0.3× net-debt-to-EBITDA ratio as safe. We also see its $1.06 million of annual interest expenses as appropriate. The company’s profits give it plenty of breathing room, allowing it to continue investing in growth initiatives.
11. Key Takeaways from ThredUp’s Q4 Results
We were impressed by how significantly ThredUp blew past analysts’ EBITDA expectations this quarter. We were also glad its full-year revenue guidance exceeded Wall Street’s estimates. Overall, we think this was still a solid quarter with some key areas of upside. The market seemed to be hoping for more, and the stock traded down 1.2% to $4.95 immediately after reporting.
12. Is Now The Time To Buy ThredUp?
Updated: March 15, 2026 at 10:28 PM EDT
The latest quarterly earnings matters, sure, but we actually think longer-term fundamentals and valuation matter more. Investors should consider all these pieces before deciding whether or not to invest in ThredUp.
We cheer for all companies serving everyday consumers, but in the case of ThredUp, we’ll be cheering from the sidelines. On top of that, ThredUp’s number of orders has disappointed, and its relatively low ROIC suggests management has struggled to find compelling investment opportunities.
ThredUp’s EV-to-EBITDA ratio based on the next 12 months is 21.5x. At this valuation, there’s a lot of good news priced in - you can find more timely opportunities elsewhere.
Wall Street analysts have a consensus one-year price target of $9.63 on the company (compared to the current share price of $3.41).
Although the price target is bullish, readers should exercise caution because analysts tend to be overly optimistic. The firms they work for, often big banks, have relationships with companies that extend into fundraising, M&A advisory, and other rewarding business lines. As a result, they typically hesitate to say bad things for fear they will lose out. We at StockStory do not suffer from such conflicts of interest, so we’ll always tell it like it is.