Royalty Pharma (RPRX)
We’re not sold on Royalty Pharma. Its sluggish sales growth shows demand is soft, a worrisome sign for investors in high-quality stocks.― StockStory Analyst Team
1. News


2. Summary
Why Royalty Pharma Is Not Exciting
Pioneering a unique business model in the pharmaceutical industry since 1996, Royalty Pharma (NASDAQ:RPRX) acquires rights to receive portions of sales from successful biopharmaceutical products, providing funding to drug developers without conducting research itself.
- Muted 2.3% annual revenue growth over the last five years shows its demand lagged behind its healthcare peers
- Subscale operations are evident in its revenue base of $2.38 billion, meaning it has fewer distribution channels than its larger rivals
- A consolation is that its projected revenue growth of 44.4% for the next 12 months is above its two-year trend, pointing to accelerating demand


Royalty Pharma’s quality is insufficient. There are more appealing investments to be made.
Why There Are Better Opportunities Than Royalty Pharma


Royalty Pharma is trading at $45.25 per share, or 8.7x forward P/E. This certainly seems like a cheap stock, but we think there are valid reasons why it trades this way.
We’d rather pay up for companies with elite fundamentals than get a bargain on weak ones. Cheap stocks can be value traps, and as their performance deteriorates, they will stay cheap or get even cheaper.
3. Royalty Pharma (RPRX) Research Report: Q4 CY2025 Update
Healthcare royalties company Royalty Pharma (NASDAQ:RPRX) beat Wall Street’s revenue expectations in Q4 CY2025 as sales rose to $874 million.
Correction note:
The previous version of this report had incorrect analysts' sales and EPS estimates. This has been updated in the current version.
Royalty Pharma (RPRX) Q4 CY2025 Highlights:
- Revenue: $874 million vs analyst estimates of $753.9 million
- Adjusted EPS: $1.47 vs analyst estimates of $1.33 (10% beat)
- Operating Margin: 62.4%, up from 60.9% in the same quarter last year
- Free Cash Flow Margin: 133%, up from 37.4% in the same quarter last year
- Market Capitalization: $18.89 billion
Company Overview
Pioneering a unique business model in the pharmaceutical industry since 1996, Royalty Pharma (NASDAQ:RPRX) acquires rights to receive portions of sales from successful biopharmaceutical products, providing funding to drug developers without conducting research itself.
Royalty Pharma operates at the intersection of finance and pharmaceuticals, creating a win-win arrangement for both drug developers and investors. The company purchases royalty interests in medications, which entitles it to receive a percentage of a drug's sales revenue over time. This model allows Royalty Pharma to benefit from pharmaceutical innovation without bearing the direct risks of drug development and clinical trials.
The company's portfolio spans more than 35 commercial products treating various conditions including cystic fibrosis, multiple sclerosis, cancer, and rare diseases. When a pharmaceutical company or research institution needs capital—whether to fund late-stage clinical trials, launch a new drug, or monetize an existing royalty stream—Royalty Pharma can step in with financing in exchange for future royalty rights.
For example, a university that developed a promising cancer treatment might sell its royalty rights to Royalty Pharma for an upfront payment, allowing the institution to immediately fund new research while Royalty Pharma collects the ongoing royalties as the drug generates sales. Similarly, a biotech company might partner with Royalty Pharma to fund a Phase 3 clinical trial in exchange for a percentage of future sales.
Royalty Pharma maintains a therapeutic-agnostic approach, focusing instead on products with strong clinical data or proven commercial success. The company employs scientific and financial experts who analyze potential acquisitions, tracking development programs across the industry to identify promising opportunities.
The company generates revenue entirely through the royalty payments it receives based on the sales performance of drugs in its portfolio. These royalties typically continue until patent expiration or for a contractually specified period. Royalty Pharma's largest revenue source comes from Vertex Pharmaceuticals' cystic fibrosis treatments, including Trikafta, which has patent protection extending to 2037.
4. Branded Pharmaceuticals
Looking ahead, the branded pharmaceutical industry is positioned for tailwinds from advancements in precision medicine, increasing adoption of AI to enhance drug development efficiency, and growing global demand for treatments addressing chronic and rare diseases. However, headwinds include heightened regulatory scrutiny, pricing pressures from governments and insurers, and the looming patent cliffs for key blockbuster drugs. Patent cliffs bring about competition from generics, forcing branded pharmaceutical companies back to the drawing board to find the next big thing.
Royalty Pharma's competitors include other healthcare royalty investors such as HealthCare Royalty Partners, Oberland Capital, and OrbiMed Advisors, as well as specialized investment firms like Drug Royalty Corporation and Ligand Pharmaceuticals (NASDAQ:LGND).
5. Revenue Scale
Larger companies benefit from economies of scale, where fixed costs like infrastructure, technology, and administration are spread over a higher volume of goods or services, reducing the cost per unit. Scale can also lead to bargaining power with suppliers, greater brand recognition, and more investment firepower. A virtuous cycle can ensue if a scaled company plays its cards right.
With just $2.38 billion in revenue over the past 12 months, Royalty Pharma lacks scale in an industry where it matters. This makes it difficult to build trust with customers because healthcare is heavily regulated, complex, and resource-intensive.
6. Revenue Growth
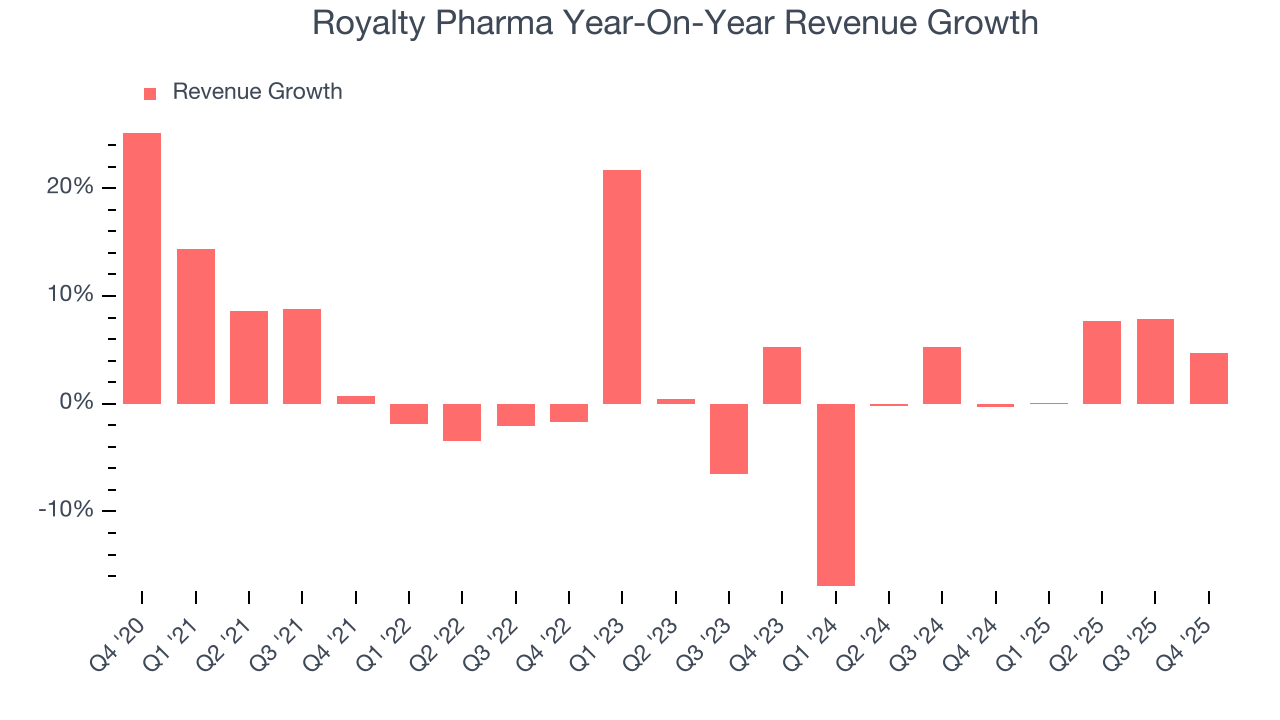
A company’s long-term performance is an indicator of its overall quality. Any business can put up a good quarter or two, but the best consistently grow over the long haul. Regrettably, Royalty Pharma’s sales grew at a tepid 2.3% compounded annual growth rate over the last five years. This fell short of our benchmarks and is a poor baseline for our analysis.
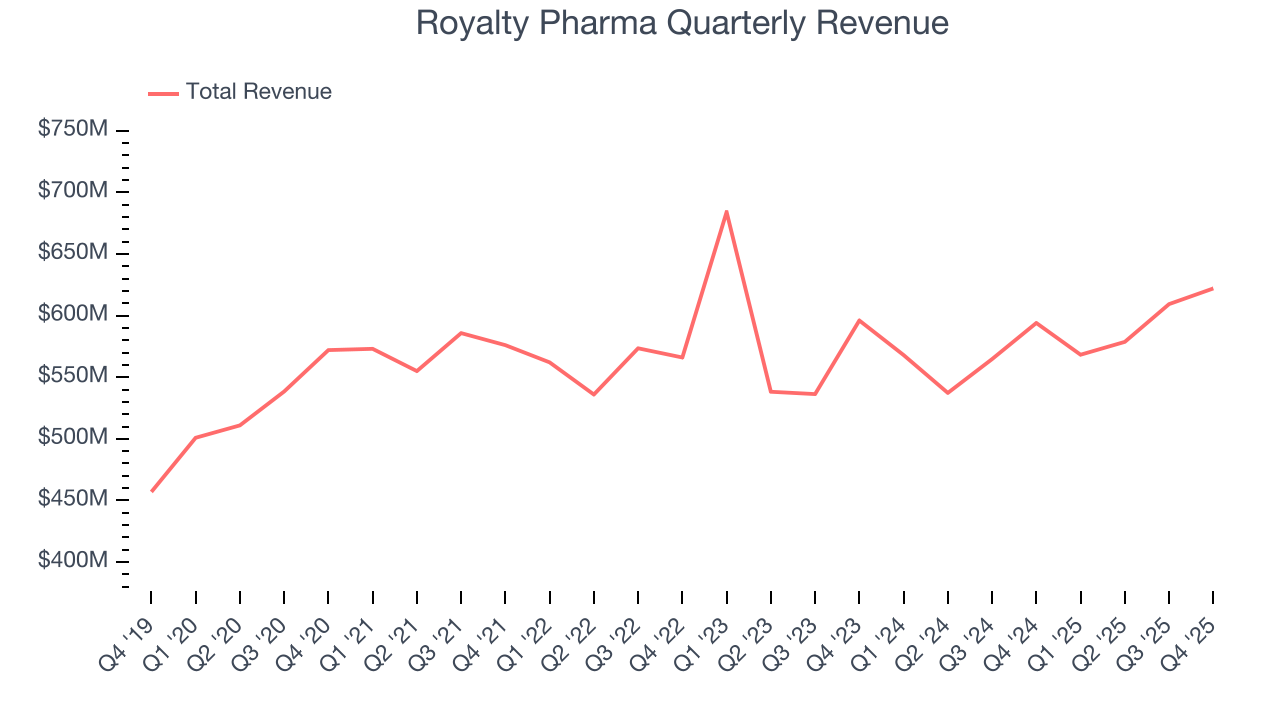
We at StockStory place the most emphasis on long-term growth, but within healthcare, a half-decade historical view may miss recent innovations or disruptive industry trends. Royalty Pharma’s recent performance shows its demand has slowed as its revenue was flat over the last two years.
We can better understand the company’s revenue dynamics by analyzing its most important segment, Portfolio Receipts. Over the last two years, Royalty Pharma’s Portfolio Receipts revenue averaged 11.5% year-on-year growth. This segment has outperformed its total sales during the same period, lifting the company’s performance.
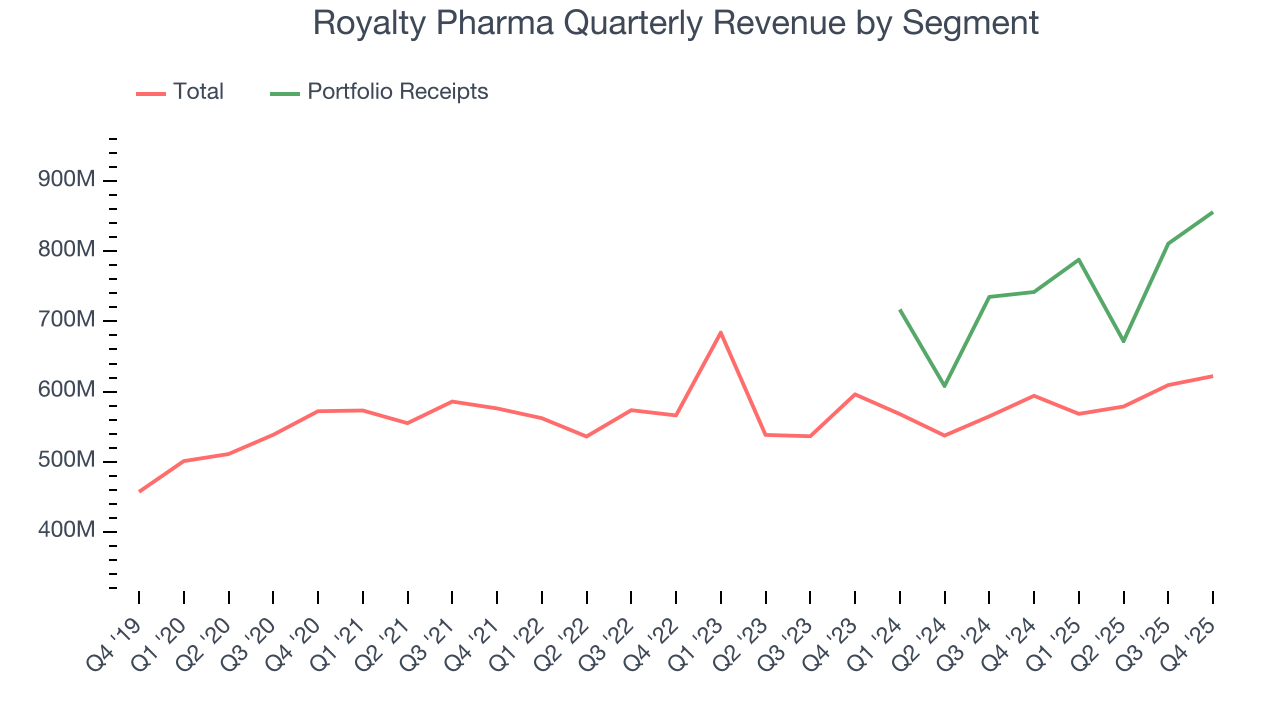
Looking ahead, sell-side analysts expect revenue to grow 13.9% over the next 12 months, an improvement versus the last two years. This projection is commendable and suggests its newer products and services will spur better top-line performance.
7. Operating Margin
Royalty Pharma has been a well-oiled machine over the last five years. It demonstrated elite profitability for a healthcare business, boasting an average operating margin of 52.8%.
Looking at the trend in its profitability, Royalty Pharma’s operating margin rose by 3.1 percentage points over the last five years, as its sales growth gave it operating leverage. The company’s two-year trajectory shows its performance was mostly driven by its recent improvements.
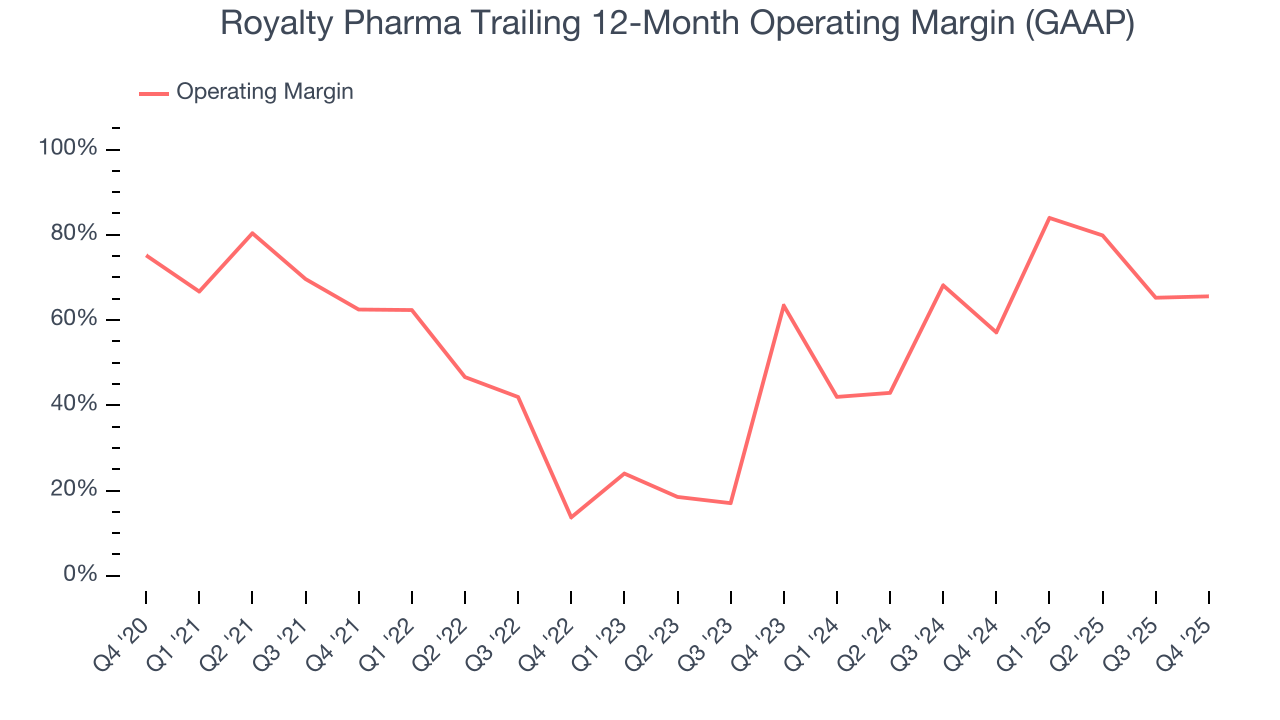
In Q4, Royalty Pharma generated an operating margin profit margin of 62.4%, up 1.4 percentage points year on year. This increase was a welcome development and shows it was more efficient.
8. Earnings Per Share
We track the long-term change in earnings per share (EPS) for the same reason as long-term revenue growth. Compared to revenue, however, EPS highlights whether a company’s growth is profitable.
Sadly for Royalty Pharma, its EPS declined by 8.5% annually over the last five years while its revenue grew by 2.3%. However, its operating margin actually improved during this time, telling us that non-fundamental factors such as interest expenses and taxes affected its ultimate earnings.
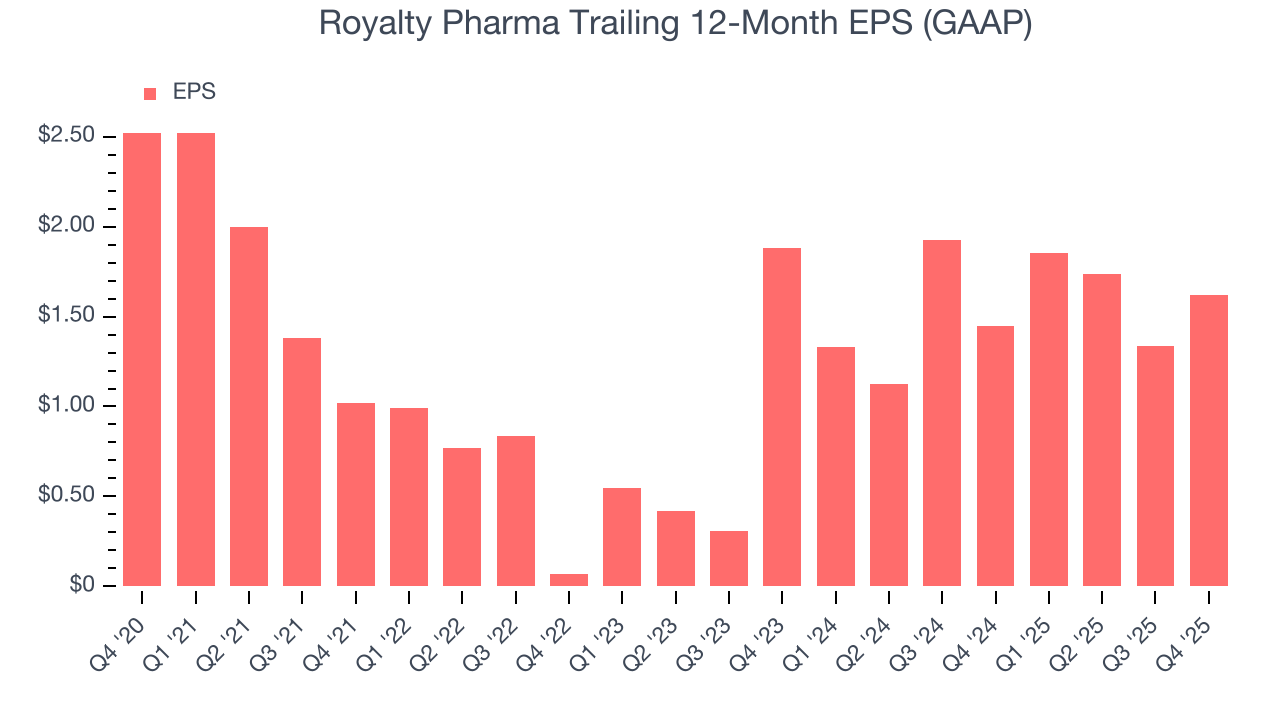
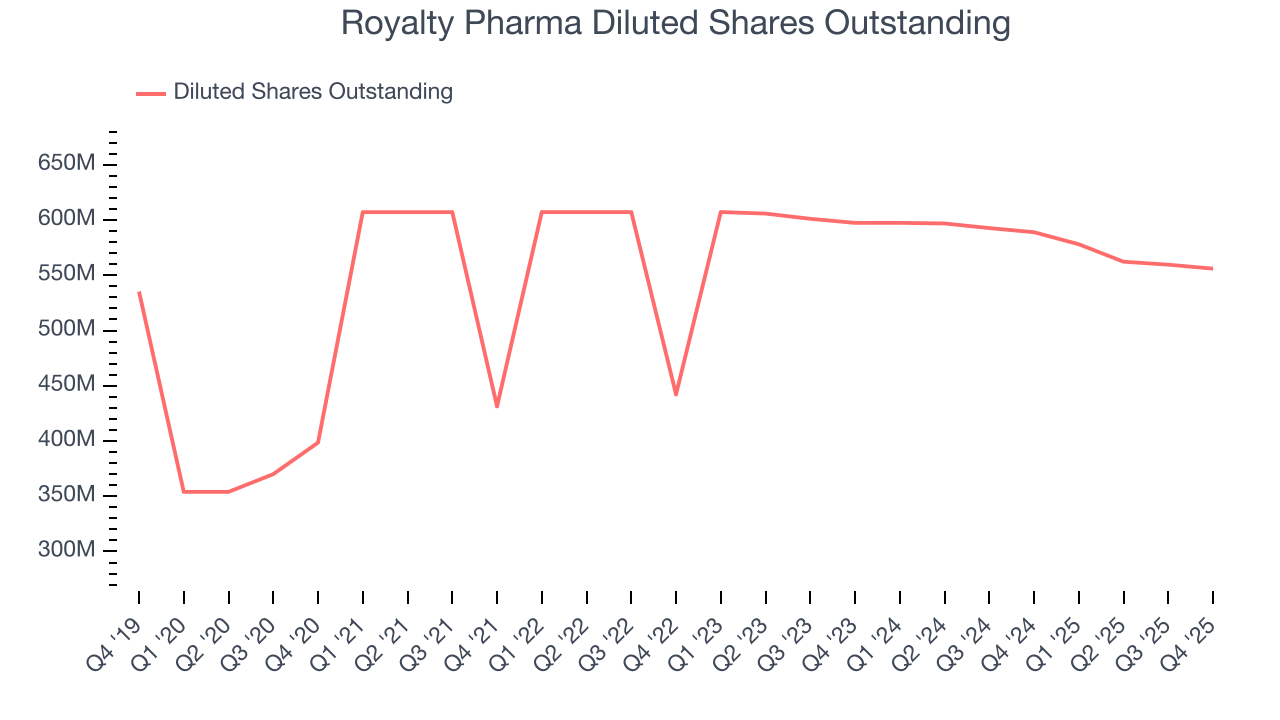
We can take a deeper look into Royalty Pharma’s earnings to better understand the drivers of its performance. A five-year view shows Royalty Pharma has diluted its shareholders, growing its share count by 39.5%. This dilution overshadowed its increased operational efficiency and has led to lower per share earnings. Taxes and interest expenses can also affect EPS but don’t tell us as much about a company’s fundamentals.
9. Cash Is King
Free cash flow isn't a prominently featured metric in company financials and earnings releases, but we think it's telling because it accounts for all operating and capital expenses, making it tough to manipulate. Cash is king.
Royalty Pharma has shown robust cash profitability, giving it an edge over its competitors and the ability to reinvest or return capital to investors. The company’s free cash flow margin averaged 21.8% over the last five years, quite impressive for a healthcare business.
Taking a step back, we can see that Royalty Pharma’s margin expanded by 61.3 percentage points during that time. This is encouraging, and we can see it became a less capital-intensive business because its free cash flow profitability rose more than its operating profitability.
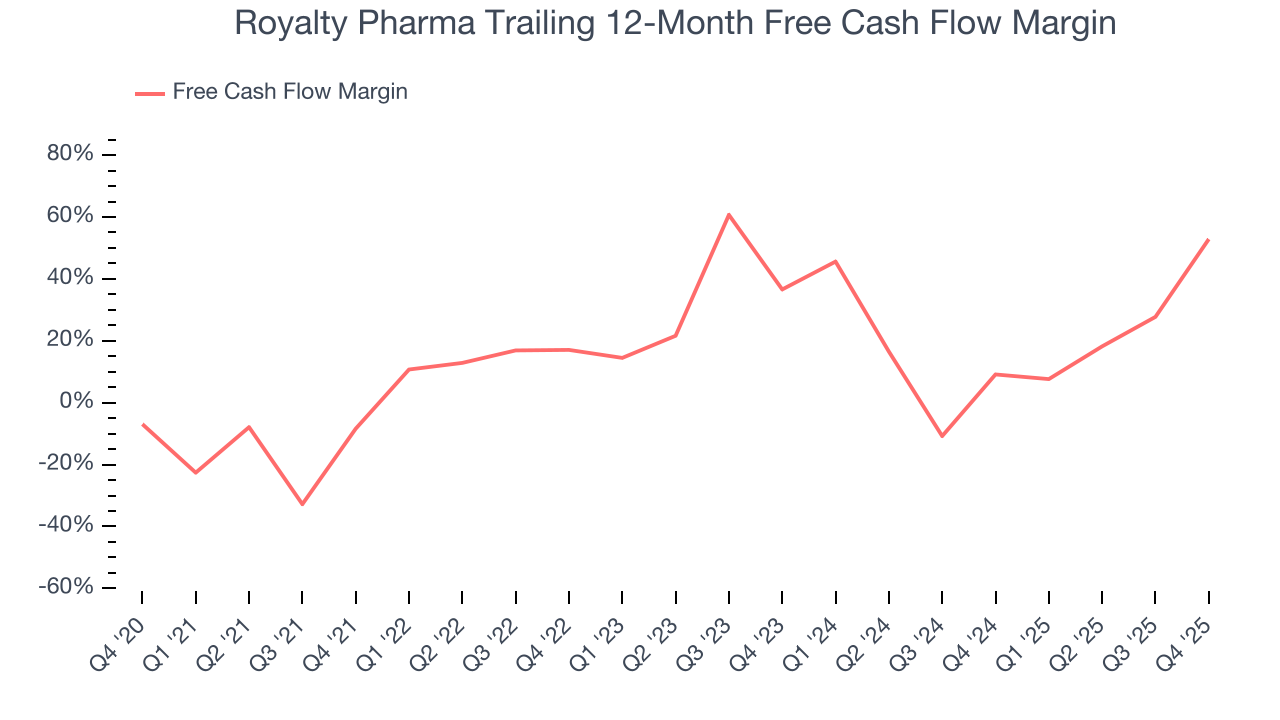
Royalty Pharma’s free cash flow clocked in at $827 million in Q4, equivalent to a 133% margin. This result was good as its margin was 95.6 percentage points higher than in the same quarter last year, building on its favorable historical trend.
10. Balance Sheet Assessment
Royalty Pharma reported $619 million of cash and $8.95 billion of debt on its balance sheet in the most recent quarter. As investors in high-quality companies, we primarily focus on two things: 1) that a company’s debt level isn’t too high and 2) that its interest payments are not excessively burdening the business.
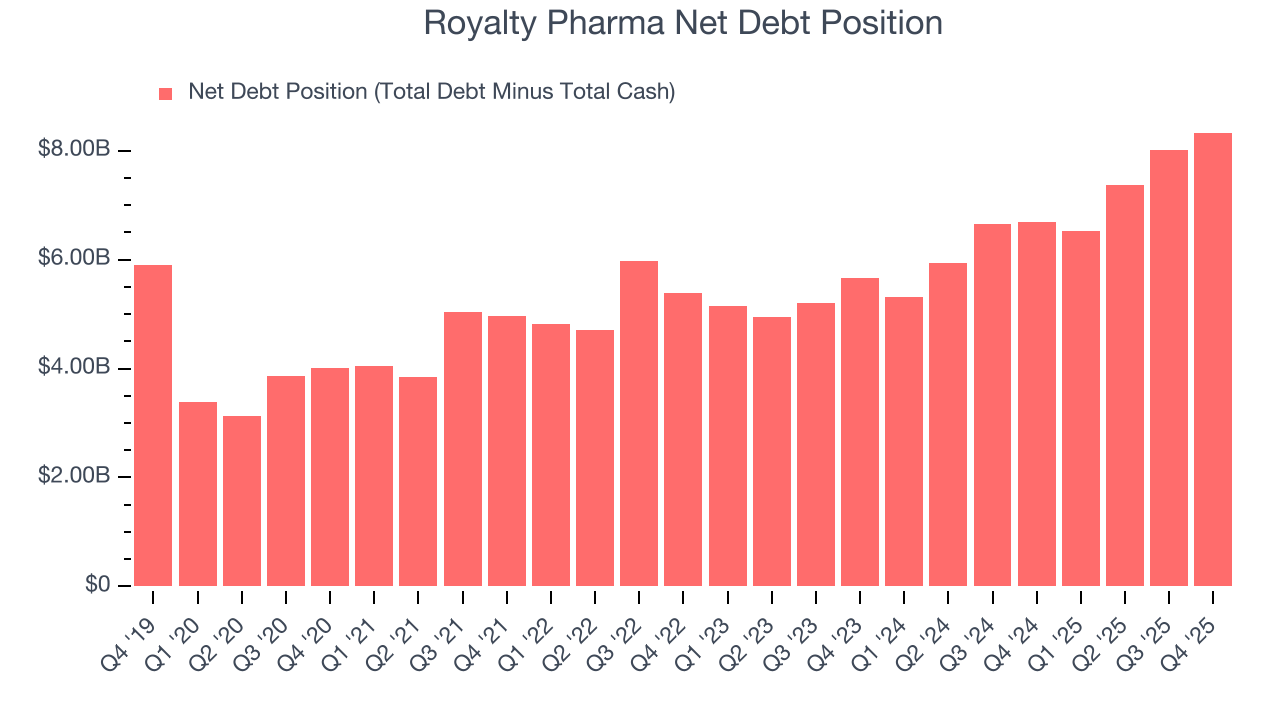
With $2.97 billion of EBITDA over the last 12 months, we view Royalty Pharma’s 2.8× net-debt-to-EBITDA ratio as safe. We also see its $92.97 million of annual interest expenses as appropriate. The company’s profits give it plenty of breathing room, allowing it to continue investing in growth initiatives.
11. Key Takeaways from Royalty Pharma’s Q4 Results
We struggled to find many positives in these results. Overall, this was a weaker quarter. The stock remained flat at $44.22 immediately after reporting.
12. Is Now The Time To Buy Royalty Pharma?
Updated: March 24, 2026 at 12:26 AM EDT
Before making an investment decision, investors should account for Royalty Pharma’s business fundamentals and valuation in addition to what happened in the latest quarter.
There are some bright spots in Royalty Pharma’s fundamentals, but its business quality ultimately falls short. Although its revenue growth was uninspiring over the last five years, its growth over the next 12 months is expected to be higher. Plus, Royalty Pharma’s impressive operating margins show it has a highly efficient business model.
Royalty Pharma’s P/E ratio based on the next 12 months is 8.7x. This valuation is reasonable, but the company’s shakier fundamentals present too much downside risk. We're pretty confident there are more exciting stocks to buy at the moment.
Wall Street analysts have a consensus one-year price target of $51.56 on the company (compared to the current share price of $45.25).