
Oxford Industries (OXM)
Oxford Industries keeps us up at night. Its sales have underperformed and its low returns on capital show it has few growth opportunities.― StockStory Analyst Team
1. News


2. Summary
Why We Think Oxford Industries Will Underperform
The parent company of Tommy Bahama, Oxford Industries (NYSE:OXM) is a lifestyle fashion conglomerate with brands that embody outdoor happiness.
- 12.6% annual revenue growth over the last five years was slower than its consumer discretionary peers
- Projected sales for the next 12 months are flat and suggest demand will be subdued
- Operating margin falls short of the industry average, and the smaller profit dollars make it harder to react to unexpected market developments


Oxford Industries doesn’t measure up to our expectations. There are more promising prospects in the market.
Why There Are Better Opportunities Than Oxford Industries


Oxford Industries is trading at $35.76 per share, or 15.1x forward P/E. This multiple is cheaper than most consumer discretionary peers, but we think this is justified.
It’s better to pay up for high-quality businesses with higher long-term earnings potential rather than to buy lower-quality stocks because they appear cheap. These challenged businesses often don’t re-rate, a phenomenon known as a “value trap”.
3. Oxford Industries (OXM) Research Report: Q3 CY2025 Update
Fashion conglomerate Oxford Industries (NYSE:OXM) reported Q3 CY2025 results exceeding the market’s revenue expectations, but sales were flat year on year at $307.3 million. On the other hand, next quarter’s revenue guidance of $375 million was less impressive, coming in 4.4% below analysts’ estimates. Its non-GAAP loss of $0.92 per share was 2.4% above analysts’ consensus estimates.
Oxford Industries (OXM) Q3 CY2025 Highlights:
- Revenue: $307.3 million vs analyst estimates of $305.6 million (flat year on year, 0.6% beat)
- Adjusted EPS: -$0.92 vs analyst estimates of -$0.94 (2.4% beat)
- Revenue Guidance for Q4 CY2025 is $375 million at the midpoint, below analyst estimates of $392.1 million
- Management lowered its full-year Adjusted EPS guidance to $2.30 at the midpoint, a 23.3% decrease
- Operating Margin: -27.7%, down from -2% in the same quarter last year
- Free Cash Flow was -$47.92 million compared to -$56.93 million in the same quarter last year
- Market Capitalization: $591.4 million
Company Overview
The parent company of Tommy Bahama, Oxford Industries (NYSE:OXM) is a lifestyle fashion conglomerate with brands that embody outdoor happiness.
Over the decades, Oxford Industries has established itself with its wide range of premium lifestyle brands including Lilly Pulitzer, Southern Tide, The Beaufort Bonnet Company, Johnny Was, and Duck Head.
Tommy Bahama, Oxford Industries's largest brand, embodies the laid-back luxury lifestyle, offering men's and women's sportswear, swimwear, accessories, and home furnishings. Lilly Pulitzer sports a similar style as it's known for its vibrant, colorful designs and resort wear while Southern Tide brings Southern charm to classic American sportswear.
Oxford Industries grew its portfolio of brands through acquisitions, selectively buying companies with loyal customer bases. The company's distribution strategy leverages a mix of wholesale and direct-to-consumer channels, including branded retail stores, e-commerce platforms, and department store partnerships. This multi-channel approach allows Oxford to reach a wide audience, adapting to the shifting retail landscape and consumer buying habits.
4. Apparel and Accessories
Thanks to social media and the internet, not only are styles changing more frequently today than in decades past but also consumers are shifting the way they buy their goods, favoring omnichannel and e-commerce experiences. Some apparel and accessories companies have made concerted efforts to adapt while those who are slower to move may fall behind.
Oxford Industries's primary competitors include PVH Corp (NYSE: PVH), Ralph Lauren (NYSE: RL), VF Corp (NYSE: VFC), Perry Ellis (NASDAQ: PERY), and Columbia Sportswear (NASDAQ: COLM).
5. Revenue Growth
A company’s long-term sales performance can indicate its overall quality. Any business can put up a good quarter or two, but the best consistently grow over the long haul. Over the last five years, Oxford Industries grew its sales at a 12.6% annual rate. Although this growth is acceptable on an absolute basis, it fell short of our standards for the consumer discretionary sector, which enjoys a number of secular tailwinds.
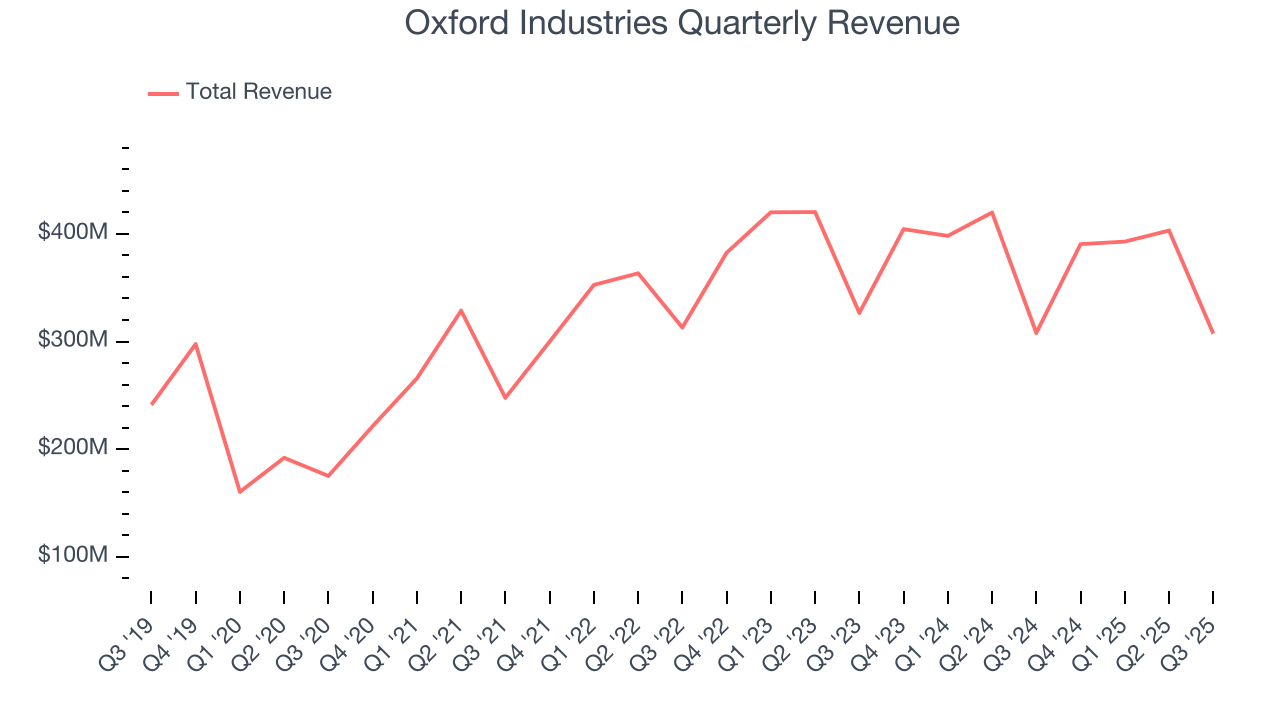
Long-term growth is the most important, but within consumer discretionary, product cycles are short and revenue can be hit-driven due to rapidly changing trends and consumer preferences. Oxford Industries’s performance shows it grew in the past but relinquished its gains over the last two years, as its revenue fell by 1.8% annually. 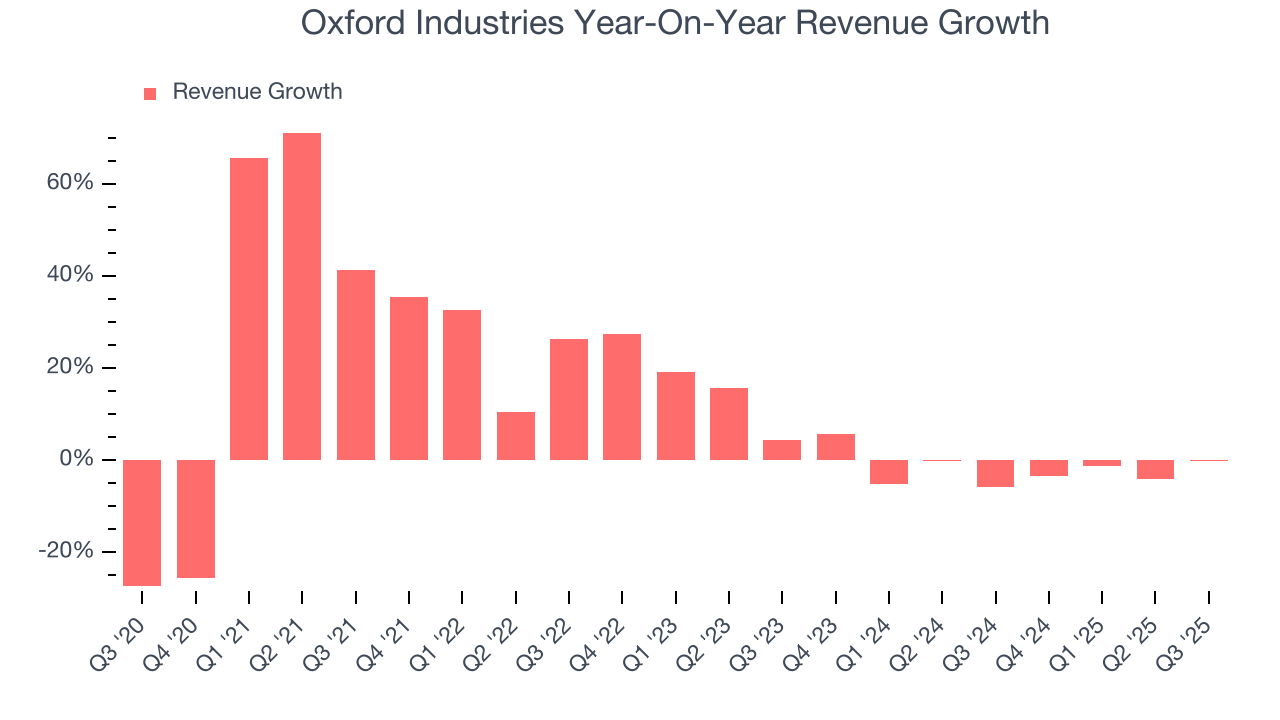
This quarter, Oxford Industries’s $307.3 million of revenue was flat year on year but beat Wall Street’s estimates by 0.6%. Company management is currently guiding for a 4% year-on-year decline in sales next quarter.
Looking further ahead, sell-side analysts expect revenue to grow 2% over the next 12 months. Although this projection suggests its newer products and services will catalyze better top-line performance, it is still below average for the sector.
6. Operating Margin
Operating margin is a key measure of profitability. Think of it as net income - the bottom line - excluding the impact of taxes and interest on debt, which are less connected to business fundamentals.
Oxford Industries’s operating margin has shrunk over the last 12 months, and it ended up breaking even over the last two years. The company’s performance was inadequate, showing its operating expenses were rising and it couldn’t pass those costs onto its customers.
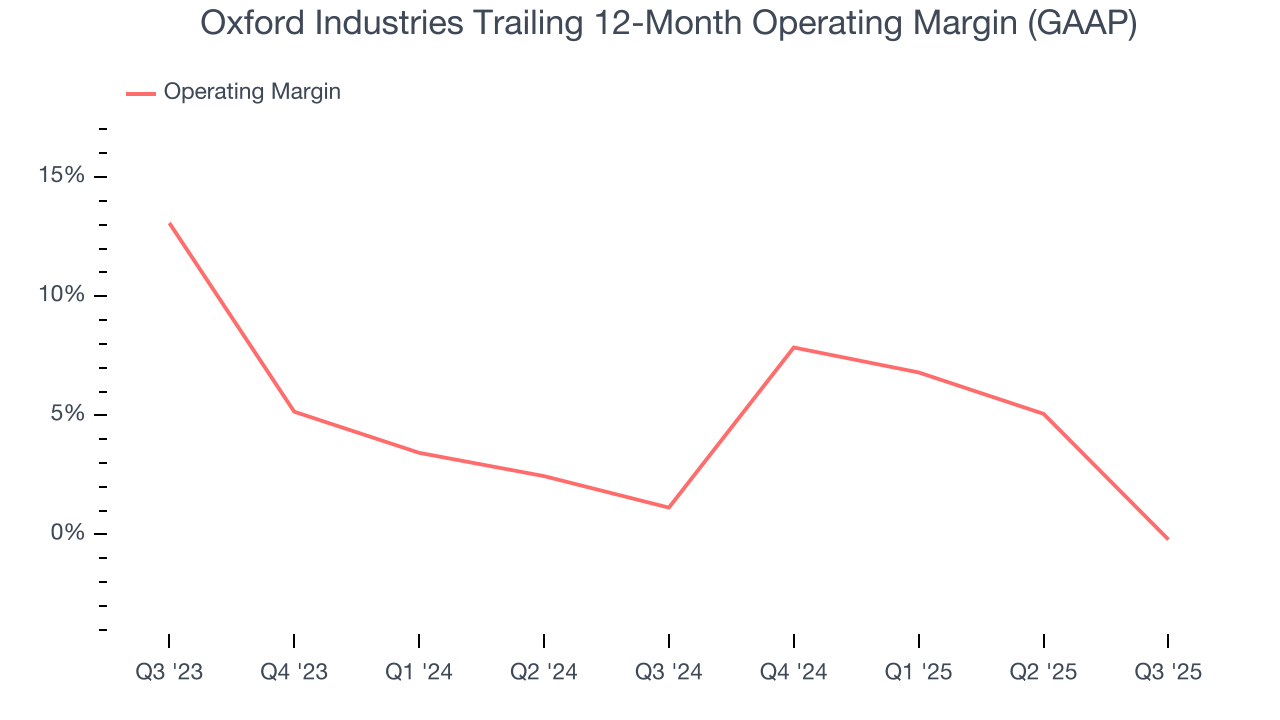
This quarter, Oxford Industries generated an operating margin profit margin of negative 27.7%, down 25.7 percentage points year on year. This contraction shows it was less efficient because its expenses increased relative to its revenue.
7. Earnings Per Share
We track the long-term change in earnings per share (EPS) for the same reason as long-term revenue growth. Compared to revenue, however, EPS highlights whether a company’s growth is profitable.
Oxford Industries’s full-year EPS flipped from negative to positive over the last five years. This is encouraging and shows it’s at a critical moment in its life.
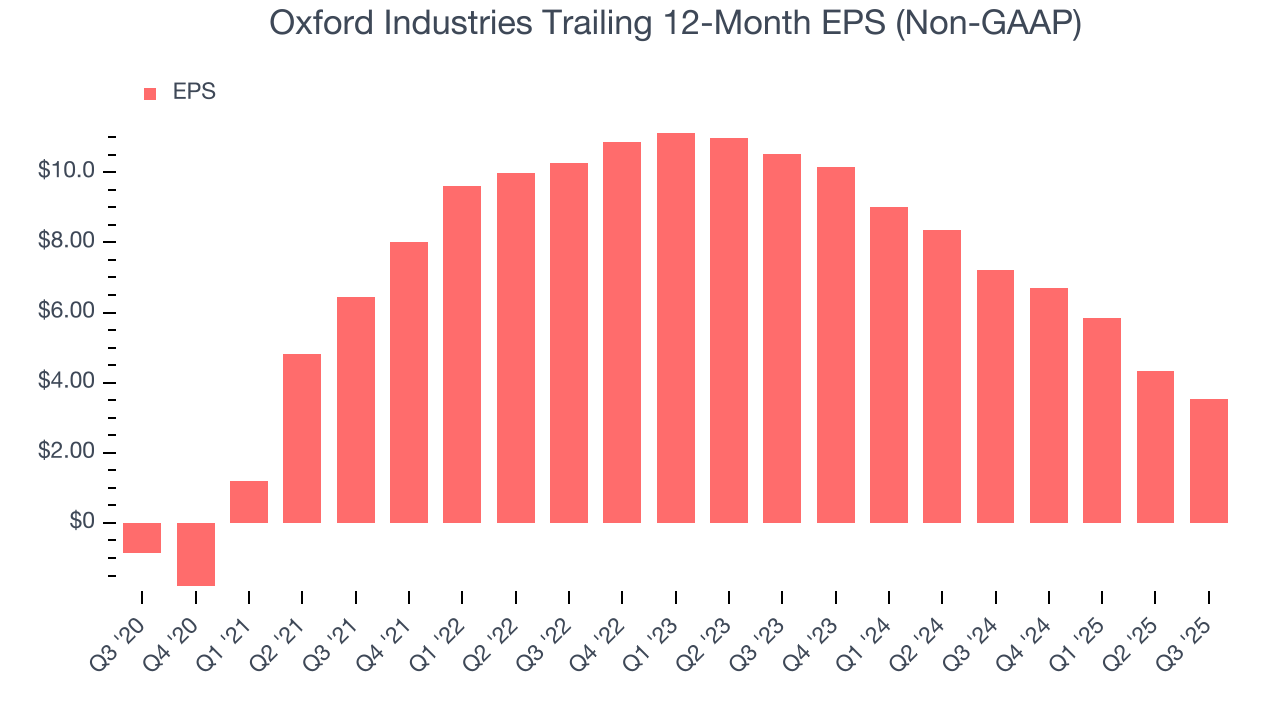
In Q3, Oxford Industries reported adjusted EPS of negative $0.92, down from negative $0.11 in the same quarter last year. Despite falling year on year, this print beat analysts’ estimates by 2.4%. Over the next 12 months, Wall Street expects Oxford Industries’s full-year EPS of $3.53 to grow 2.3%.
8. Cash Is King
Although earnings are undoubtedly valuable for assessing company performance, we believe cash is king because you can’t use accounting profits to pay the bills.
Oxford Industries has shown poor cash profitability over the last two years, giving the company limited opportunities to return capital to shareholders. Its free cash flow margin averaged 3%, lousy for a consumer discretionary business.
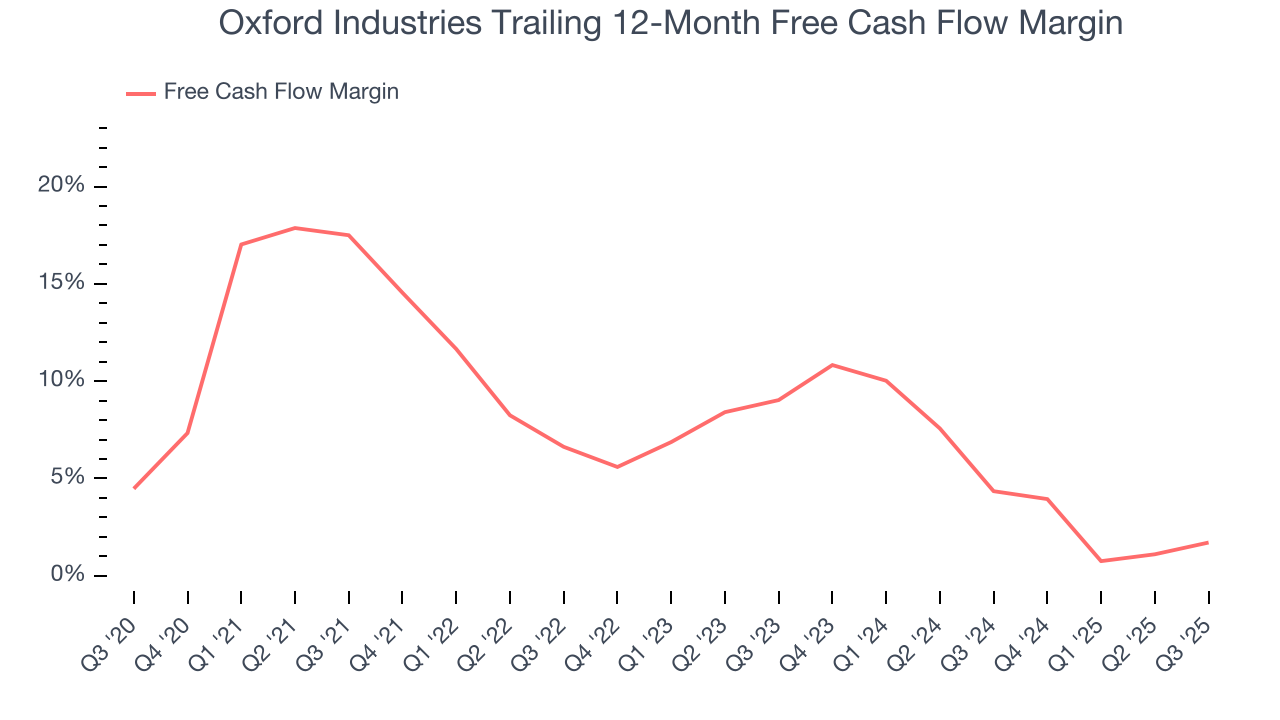
Oxford Industries burned through $47.92 million of cash in Q3, equivalent to a negative 15.6% margin. The company’s cash burn was similar to its $56.93 million of lost cash in the same quarter last year. These numbers deviate from its longer-term margin, indicating it is a seasonal business that must build up inventory during certain quarters.
9. Return on Invested Capital (ROIC)
EPS and free cash flow tell us whether a company was profitable while growing its revenue. But was it capital-efficient? Enter ROIC, a metric showing how much operating profit a company generates relative to the money it has raised (debt and equity).
Oxford Industries historically did a mediocre job investing in profitable growth initiatives. Its five-year average ROIC was 14.9%, somewhat low compared to the best consumer discretionary companies that consistently pump out 25%+.
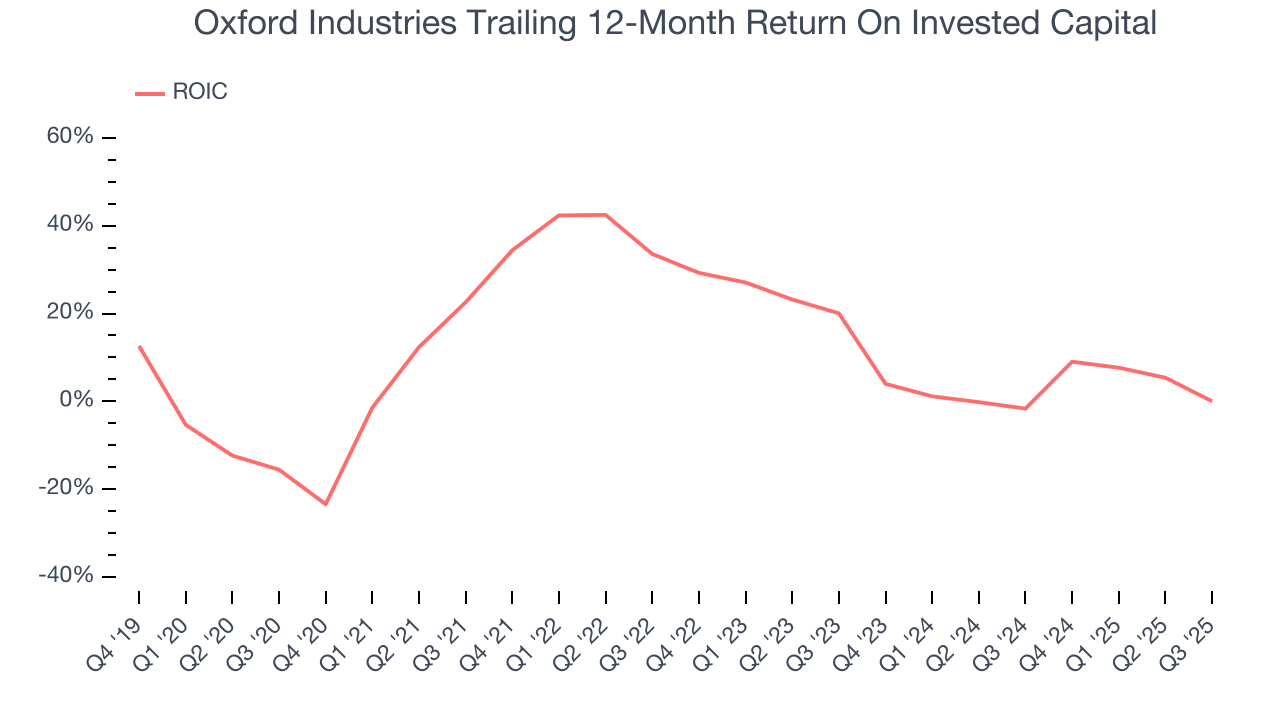
We like to invest in businesses with high returns, but the trend in a company’s ROIC is what often surprises the market and moves the stock price. Unfortunately, Oxford Industries’s ROIC has decreased significantly over the last few years. Paired with its already low returns, these declines suggest its profitable growth opportunities are few and far between.
10. Balance Sheet Assessment
Oxford Industries reported $7.98 million of cash and $566.2 million of debt on its balance sheet in the most recent quarter. As investors in high-quality companies, we primarily focus on two things: 1) that a company’s debt level isn’t too high and 2) that its interest payments are not excessively burdening the business.
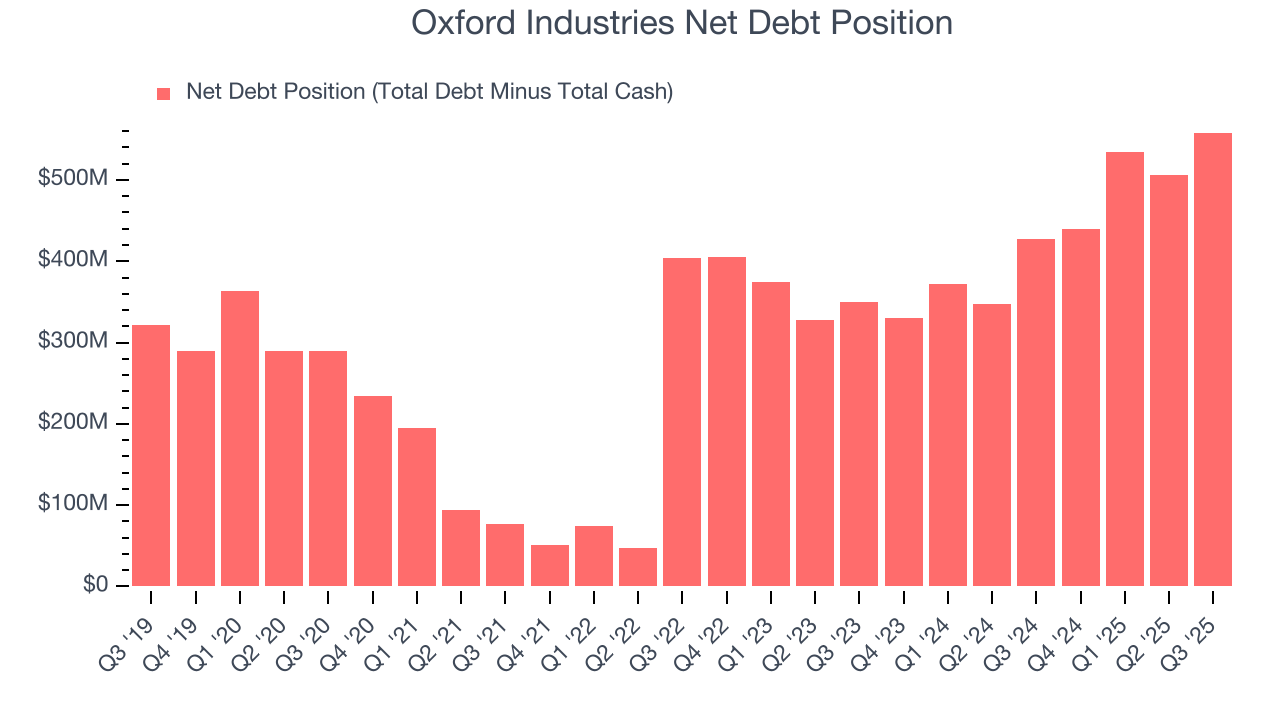
With $138.5 million of EBITDA over the last 12 months, we view Oxford Industries’s 4.0× net-debt-to-EBITDA ratio as safe. We also see its $5.81 million of annual interest expenses as appropriate. The company’s profits give it plenty of breathing room, allowing it to continue investing in growth initiatives.
11. Key Takeaways from Oxford Industries’s Q3 Results
We struggled to find many positives in these results. Its full-year EPS guidance missed and its EPS guidance for next quarter fell short of Wall Street’s estimates. Overall, this quarter could have been better. The stock traded down 19.7% to $32.50 immediately following the results.
12. Is Now The Time To Buy Oxford Industries?
Updated: March 17, 2026 at 11:00 PM EDT
A common mistake we notice when investors are deciding whether to buy a stock or not is that they simply look at the latest earnings results. Business quality and valuation matter more, so we urge you to understand these dynamics as well.
Oxford Industries falls short of our quality standards. While its solid EPS growth over the last five years shows its profits are trickling down to shareholders, the downside is its projected EPS for the next year is lacking. On top of that, its relatively low ROIC suggests management has struggled to find compelling investment opportunities.
Oxford Industries’s P/E ratio based on the next 12 months is 15.1x. While this valuation is fair, the upside isn’t great compared to the potential downside. There are better stocks to buy right now.
Wall Street analysts have a consensus one-year price target of $36.75 on the company (compared to the current share price of $35.76).