
Chord Energy (CHRD)
Chord Energy sets the gold standard. Its combination of extraordinary growth and robust profitability makes it a beloved asset.― StockStory Analyst Team
1. News


2. Summary
Why We Like Chord Energy
Holding the largest acreage position in the Williston Basin, Chord Energy (NASDAQ:CHRD) drills for and produces crude oil, natural gas liquids, and natural gas in North Dakota's Williston Basin.
- Market share has increased this cycle as its 20% annual revenue growth over the last ten years was exceptional
- Powerful free cash flow generation enables it to reinvest its profits or return capital to investors consistently
- exceptional earning stability allow investors to sleep easy at night, positioning as a consolidator during commodity price downturns


We see a bright future for Chord Energy. The valuation seems reasonable relative to its quality, and we think now is an opportune time to buy.
Why Is Now The Time To Buy Chord Energy?


At $123.98 per share, Chord Energy trades at 20.9x forward P/E. This valuation is fair - even cheap depending on how much you like the story - for the quality you get.
Where you buy a stock impacts returns. Our analysis shows that business quality is a much bigger determinant of market outperformance over the long term compared to entry price, but getting a good deal on a stock certainly isn’t a bad thing.
3. Chord Energy (CHRD) Research Report: Q4 CY2025 Update
Oil and gas producer Chord Energy (NASDAQ:CHRD) reported revenue ahead of Wall Street’s expectations in Q4 CY2025, but sales fell by 19.6% year on year to $1.17 billion. Its non-GAAP profit of $1.28 per share was 3.6% above analysts’ consensus estimates.
Chord Energy (CHRD) Q4 CY2025 Highlights:
- Revenue: $1.17 billion vs analyst estimates of $1.09 billion (19.6% year-on-year decline, 7% beat)
- Adjusted EPS: $1.28 vs analyst estimates of $1.24 (3.6% beat)
- Adjusted EBITDA: $506.4 million vs analyst estimates of $493.1 million (43.3% margin, 2.7% beat)
- Operating Margin: 7.9%, down from 18.2% in the same quarter last year
- Free Cash Flow Margin: 8.7%, down from 18.2% in the same quarter last year
- Market Capitalization: $6.9 billion
Company Overview
Holding the largest acreage position in the Williston Basin, Chord Energy (NASDAQ:CHRD) drills for and produces crude oil, natural gas liquids, and natural gas in North Dakota's Williston Basin.
The company operates as an independent exploration and production outfit, meaning it searches for underground oil and gas reserves, drills wells to access them, and then extracts and sells these resources. Its operations are concentrated in the Williston Basin, a geological formation spanning North Dakota and Montana known for its oil-rich Middle Bakken and Three Forks rock layers. With over 1.2 million net acres under lease, Chord Energy runs one of the most extensive drilling programs in the region, typically operating four to five drilling rigs simultaneously.
The production process involves drilling wells deep into underground rock formations, using techniques to fracture the rock and release trapped hydrocarbons. Once extracted, the crude oil, natural gas liquids (which are components like ethane and propane separated from natural gas), and natural gas flow through gathering systems—networks of pipelines that collect product from multiple wells. These gathering systems connect to larger pipeline networks and rail facilities that transport the commodities to refineries and other buyers. For example, a refinery in the Midwest might purchase Chord Energy's crude oil delivered via pipeline to process into gasoline and diesel fuel.
The company generates revenue by selling these extracted commodities to refiners, marketers, and other purchasers at prevailing market prices, typically under short-term contracts. Chord Energy manages its own marketing operations, allowing it to negotiate sales with various buyers and optimize where its production is delivered. The company also maintains delivery commitments requiring it to transport or deliver minimum quantities of oil and gas through specific infrastructure within defined timeframes.
4. U.S. Shale E&P
US shale oil producers extract crude from tight rock formations using horizontal drilling and hydraulic fracturing (fracking) techniques, primarily in basins like the Permian, Bakken, and Eagle Ford. Tailwinds include short-cycle investment flexibility allowing rapid production adjustments, technological improvements enhancing well productivity, and proximity to refining and export infrastructure. Capital discipline has improved financial returns. Headwinds include commodity price sensitivity affecting drilling economics, accelerating well decline rates requiring continuous capital investment, and increasing regulatory and ESG scrutiny. Water usage, induced seismicity concerns, and evolving environmental regulations present ongoing operational challenges.
Chord Energy competes with other Williston Basin-focused producers including Continental Resources (NYSE:CLR), Ovintiv (NYSE:OVV), and Hess (NYSE:HES), along with numerous private exploration and production companies operating in the region.
5. Economies of Scale
In Energy, scale separates fragile single-asset producers from platform-style businesses that generate revenue across entire basins and infrastructure networks. Chord Energy’s $4.88 billion of revenue in the last year is mid-sized for the industry.
6. Revenue Growth
Cyclical industries such as Energy can make mediocre companies look great for a time, but a long-term view reveals which businesses can actually withstand and adapt to changing conditions. Over the last five years, Chord Energy grew its sales at an excellent 20.4% compounded annual growth rate. Its growth surpassed the average energy upstream and integrated energy company and shows its offerings resonate with customers, a great starting point for our analysis.
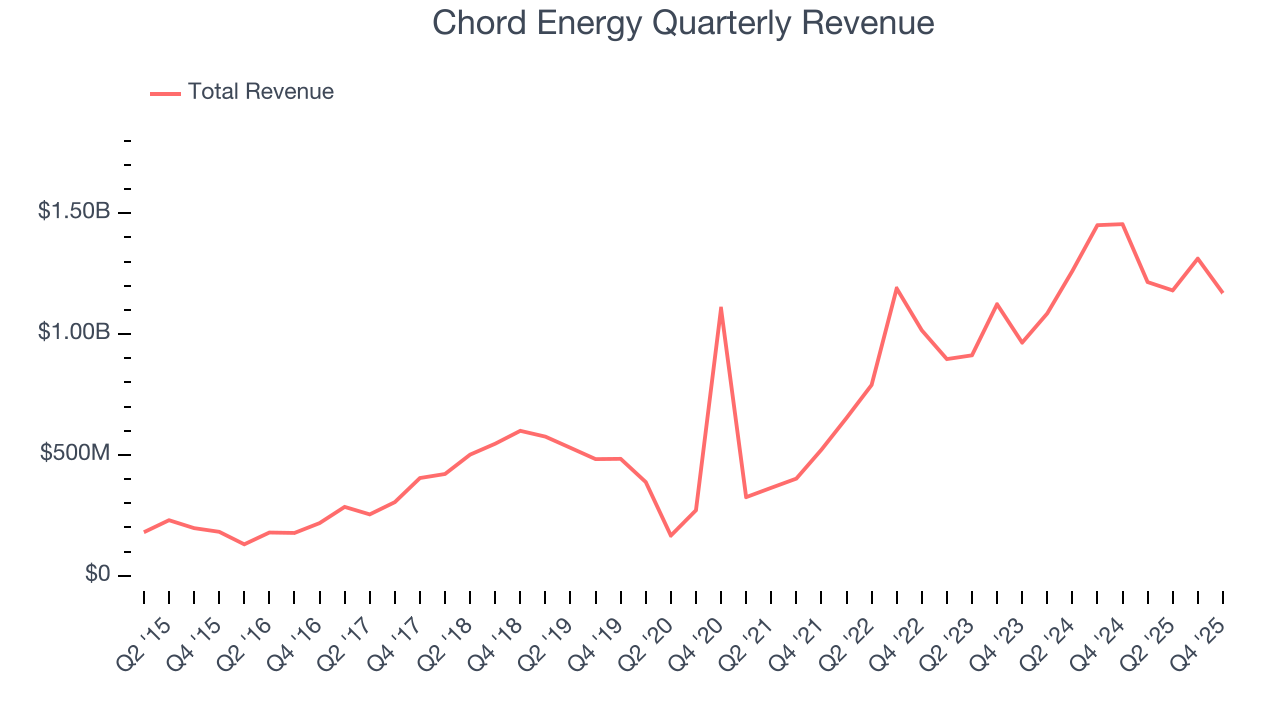
Even a long stretch in Energy can be shaped by a single commodity cycle, so extending the view to ten years adds another perspective and reveals which companies are built to grow regardless of the pricing regime. Chord Energy’s annualized revenue growth of 20% over the last ten years aligns with its five-year trend, suggesting its demand was predictably strong.
Revenue provides useful context, but it is heavily influenced by commodity prices and acquisitions. Production volumes, by contrast, reveal whether the underlying asset base is actually growing. Over the last two years, Chord Energy’s total oil volume per day - Upstream averaged 26.7% year-on-year growth while natural gas volume per day - Upstream averaged 22.3% year-on-year growth, which was good. 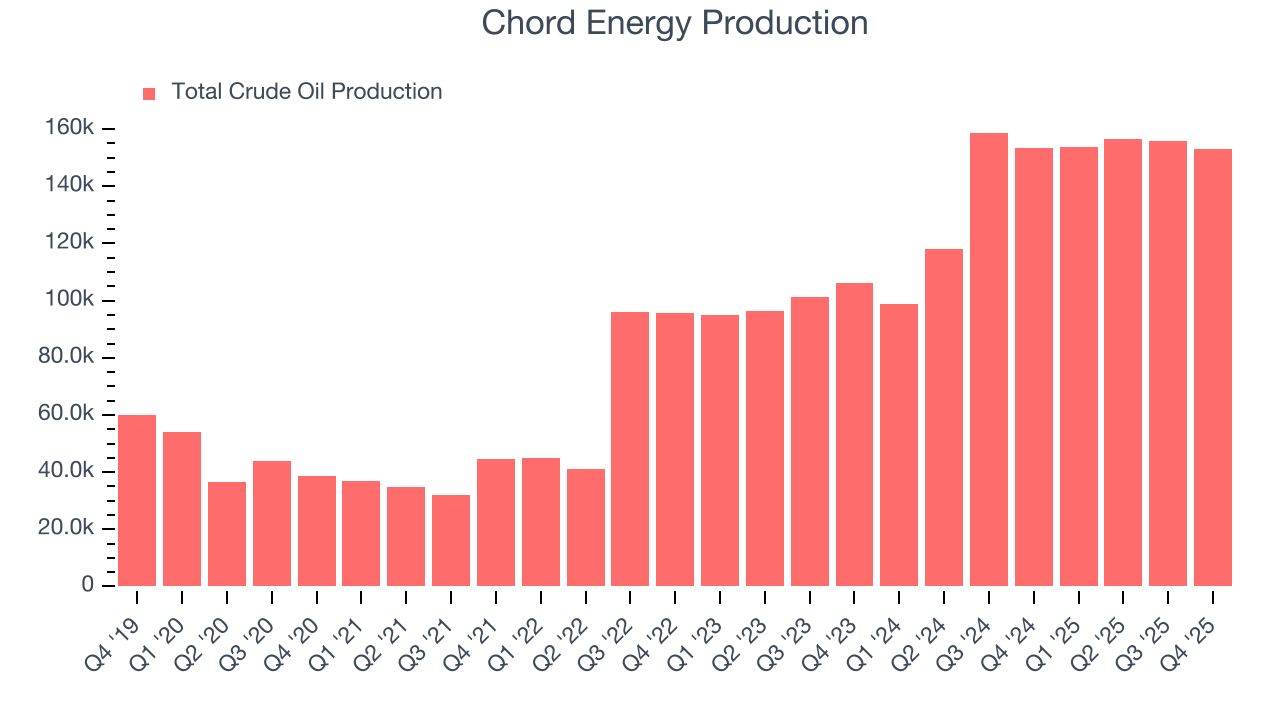
This quarter, Chord Energy’s revenue fell by 19.6% year on year to $1.17 billion but beat Wall Street’s estimates by 7%. This quarter, Chord Energy’s 153 Mboe (thousand barrels of oil equivalent) of production was flat year on year but beat Wall Street’s estimates by 1.2%.
7. Gross Margin
In any given year, energy gross margins are heavily influenced by prices, hedging, and cost inflation, but over a full cycle these gross margins reveal which producers are structurally advantaged through superior “rock” quality, infrastructure access, and cost position.
Chord Energy, which averaged 56.9% gross margin over the last five years, exhibits good unit economics in the sector. It means the company will remain profitable at lower commodity prices than peers with inferior gross margins and serves as an encouraging starting point for ultimate operating profits and free cash flow generation. 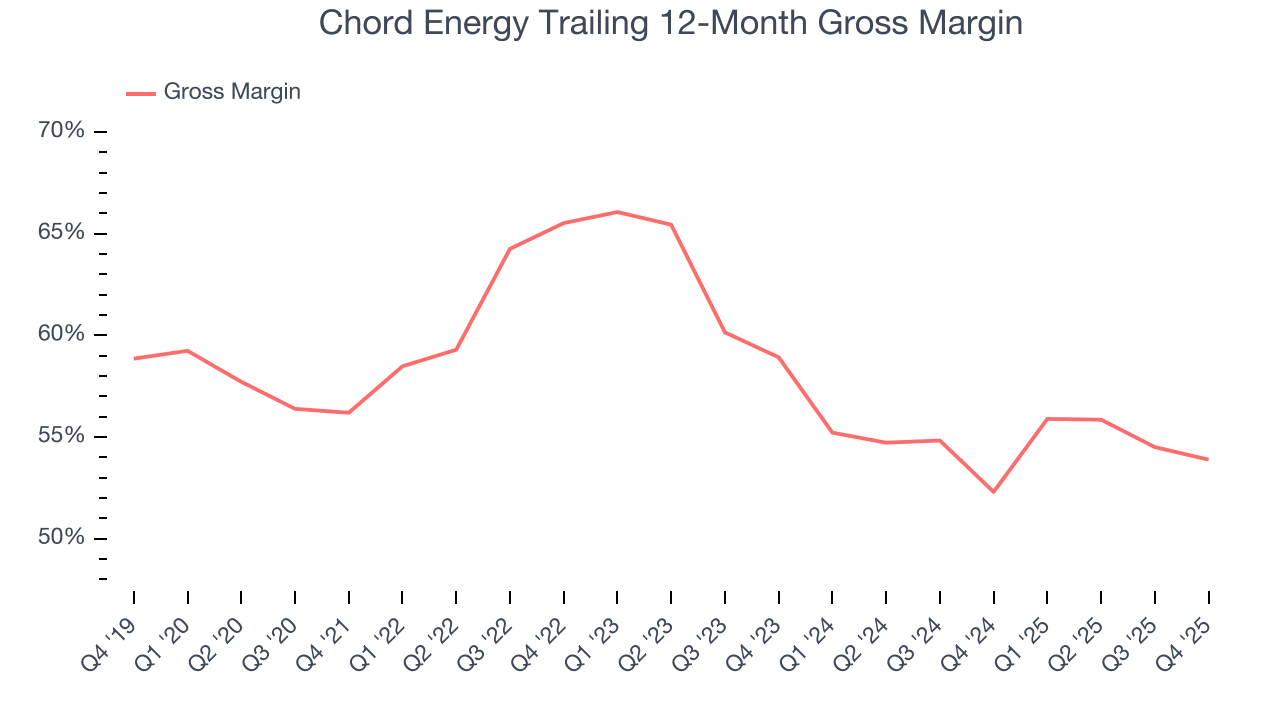
This quarter, Chord Energy’s gross profit margin was 48.2% , marking a 3.3 percentage point decrease from 51.5% in the same quarter last year. Note that energy margins can be volatile due to commodity price changes.
8. Adjusted EBITDA Margin
Adjusted EBITDA margin strips out accounting distortions tied to depletion and historical drilling spend, providing a clearer view of the cash-generating power of the underlying asset base before financing and reinvestment decisions.
Chord Energy has been an efficient company over the last five years. It was one of the more profitable businesses in the energy upstream and integrated energy sector, boasting an average EBITDA margin of 45.1%.
Analyzing the trend in its profitability, Chord Energy’s EBITDA margin rose by 4.6 percentage points over the last year, as its sales growth gave it operating leverage.
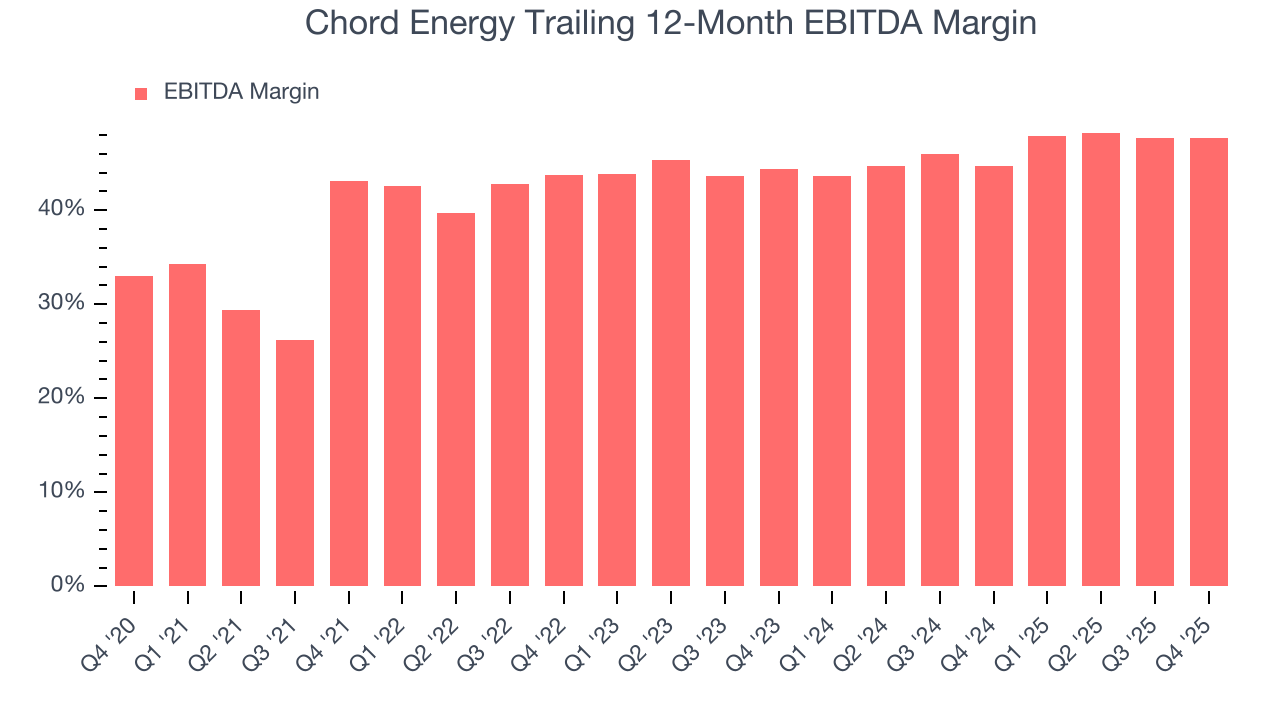
This quarter, Chord Energy generated an EBITDA margin profit margin of 43.3%, in line with the same quarter last year. This indicates the company’s overall cost structure has been relatively stable. This adjusted EBITDA beat Wall Street’s estimates by 2.7%.
9. Cash Is King
As mentioned above, adjusted EBITDA ignores capital structure and drilling expenditure decisions. These are two huge aspects of an Energy producer, so in order to understand a comprehensive picture of business quality, an investor needs to account for these. Said differently, adjusted EBITDA margins could be solid but free cash flow is abysmal because decline rates of the asset are extreme and the drilling is expensive. Free cash flow tells you about not only the economics of the production that has happened but how much it costs to stay in business as well (further drilling or extraction).
Chord Energy has shown terrific cash profitability, driven by its lucrative business model that enables it to reinvest, return capital to investors, and stay ahead of the competition. The company’s free cash flow margin was among the best in the energy upstream and integrated energy sector, averaging 24% over the last five years.
The level of free cash flow is important, but its durability across cycles is just as critical. Consistent margins are far more valuable than volatile swings driven by commodity prices.
Chord Energy’s ratio of quarterly free cash flow volatility to WTI Crude price volatility over the past five years was 3.2 (lower is better), indicating unusually strong insulation from commodity swings. This stability supports superior capital access in downturns and positions Chord Energy to act as a consolidator when weaker peers are forced to retrench.
You may be asking why we wait until the free cash flow line to perform this stability analysis versus commodity prices. Why not compare revenue or EBITDA to WTI Crude prices in the case of Chord Energy? Because what ultimately matters is not how much revenue or profit you earn when prices are high but how much cash you can generate when prices are low. Free cash flow is the superior metric because it includes everything from hedging prowess to growth and maintenance capex to management behavior during good times and bad.
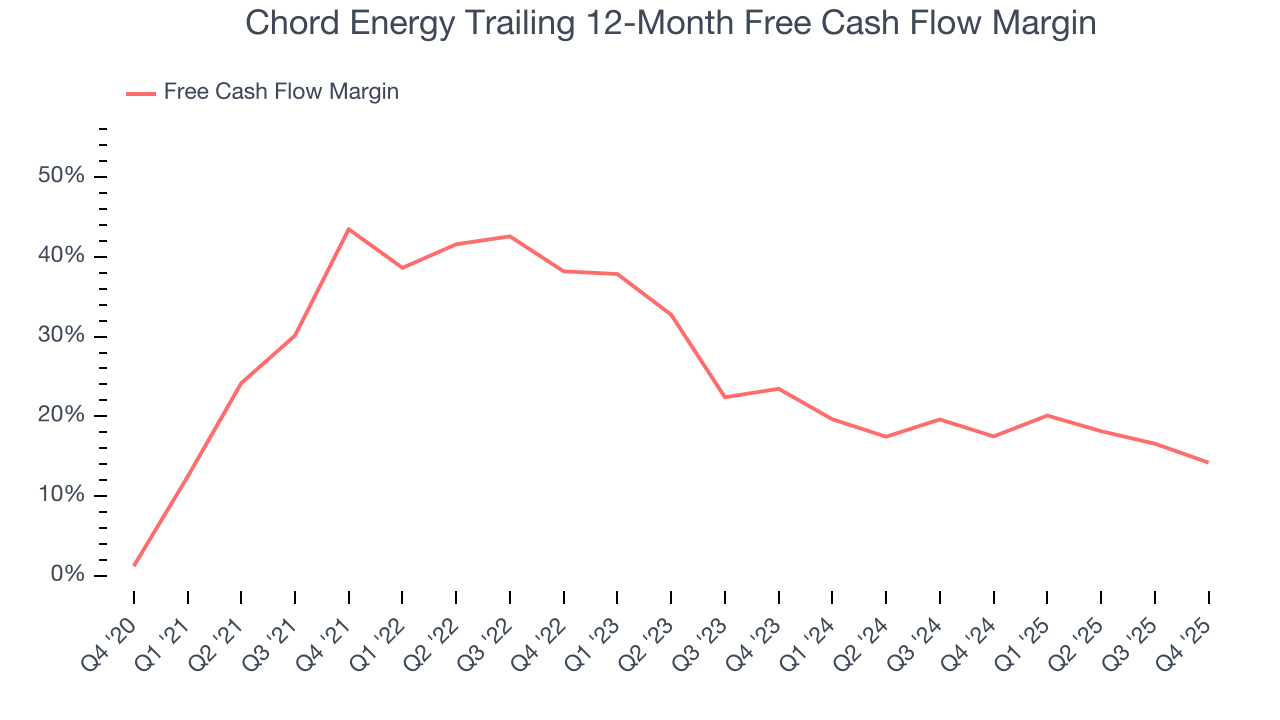
Chord Energy’s free cash flow clocked in at $101.9 million in Q4, equivalent to a 8.7% margin. The company’s cash profitability regressed as it was 9.5 percentage points lower than in the same quarter last year, which isn’t ideal considering its longer-term trend.
10. Return on Invested Capital (ROIC)
Free cash flow shows how much money a producer generated, while ROIC shows how efficiently that money was earned. ROIC measures the operating profit produced for each dollar of capital invested, whether from debt or equity. Cash generation measures quantity while ROIC measures the quality of value creation.
We at StockStory like to look at ROIC over a ten-year period because energy investment cycles can involve up to five years of ramping production and another five years of harvesting. A decade view captures buying, extracting, and monetizing rather than just part of that picture. Chord Energy’s management team makes decent investment decisions and generates value for shareholders. Its ten-year average ROIC was 9.1%, slightly better than typical energy upstream and integrated energy business.
We like to invest in businesses with high returns, but the trend in a company’s ROIC is what often surprises the market and moves the stock price. Unfortunately, Chord Energy’s ROIC has decreased significantly over the last few years. Only time will tell if its new bets can bear fruit and potentially reverse the trend.
11. Balance Sheet Assessment
Chord Energy reported $189.5 million of cash and $1.49 billion of debt on its balance sheet in the most recent quarter. As investors in high-quality companies, we primarily focus on two things: 1) that a company’s debt level isn’t too high and 2) that its interest payments are not excessively burdening the business.
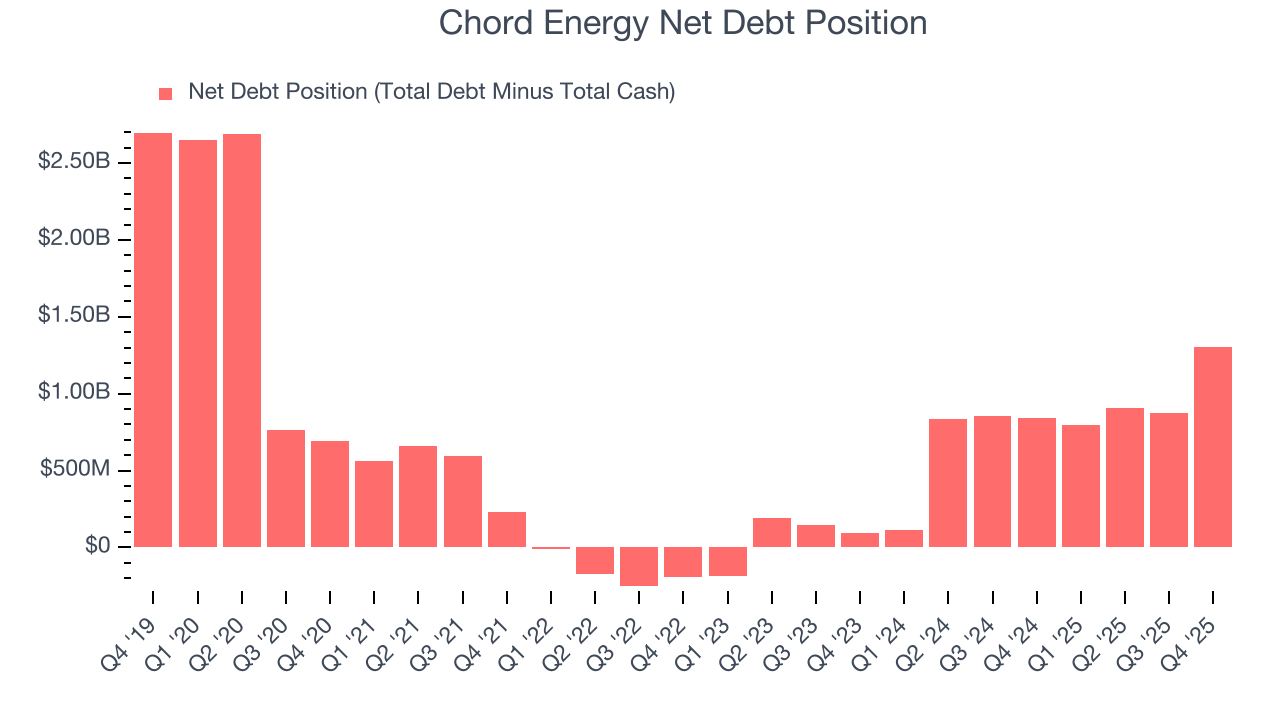
With $2.33 billion of EBITDA over the last 12 months, we view Chord Energy’s 0.6× net-debt-to-EBITDA ratio as safe. We also see its $80.15 million of annual interest expenses as appropriate. The company’s profits give it plenty of breathing room, allowing it to continue investing in growth initiatives.
12. Key Takeaways from Chord Energy’s Q4 Results
We were impressed by how significantly Chord Energy blew past analysts’ revenue expectations this quarter. We were also happy its production narrowly outperformed Wall Street’s estimates. Overall, we think this was a solid quarter with some key areas of upside. The stock traded up 3.5% to $125.58 immediately following the results.
13. Is Now The Time To Buy Chord Energy?
Updated: March 12, 2026 at 12:53 AM EDT
A common mistake we notice when investors are deciding whether to buy a stock or not is that they simply look at the latest earnings results. Business quality and valuation matter more, so we urge you to understand these dynamics as well.
Chord Energy is a cream-of-the-crop energy upstream and integrated energy company. First of all, the company’s revenue growth over the last five years was impressive for the sector. On top of that, its revenue growth over the last ten years was top-tier for the sector, and its powerful free cash flow generation enables it to stay ahead of the competition through consistent reinvestment of profits.
Chord Energy’s P/E ratio based on the next 12 months is 20.9x. Looking across the spectrum of energy upstream and integrated energy businesses, Chord Energy’s fundamentals clearly illustrate it’s a special business. We like the stock at this price.
Wall Street analysts have a consensus one-year price target of $132.35 on the company (compared to the current share price of $123.98), implying they see 6.8% upside in buying Chord Energy in the short term.