Northern Oil and Gas (NOG)
We see solid potential in Northern Oil and Gas. Its marriage of growth and profitability makes it a financial powerhouse with attractive upside.― StockStory Analyst Team
1. News
2. Summary
Why We Like Northern Oil and Gas
Taking the path less traveled in the oil industry by choosing not to operate its own wells, Northern Oil and Gas (NYSE:NOG) acquires minority stakes in oil and gas wells operated by other companies across major U.S. shale basins.
- Annual revenue growth of 28.9% over the past ten years was outstanding, reflecting market share gains this cycle
- Attractive asset base leads to wonderful unit economics and a best-in-class gross margin of 81%
- Healthy EBITDA margin shows it’s a well-run company with efficient processes, and its rise over the last five years was fueled by some leverage on its fixed costs


We’re optimistic about Northern Oil and Gas. The valuation seems fair when considering its quality, so this might be a favorable time to buy some shares.
Why Is Now The Time To Buy Northern Oil and Gas?


At $27.78 per share, Northern Oil and Gas trades at 9.6x forward P/E. The stock’s multiple sure seems like a bargain relative to its business quality and fundamentals.
We jump for joy when high-quality companies trade at bargain prices because shareholders can benefit from both earnings growth and a positive re-rating - a powerful one-two punch.
3. Northern Oil and Gas (NOG) Research Report: Q4 CY2025 Update
Non-operated oil producer Northern Oil and Gas (NYSE:NOG) reported revenue ahead of Wall Street’s expectations in Q4 CY2025, but sales fell by 8.9% year on year to $523.8 million. Its non-GAAP profit of $0.83 per share was 7.6% above analysts’ consensus estimates.
Northern Oil and Gas (NOG) Q4 CY2025 Highlights:
- Revenue: $523.8 million vs analyst estimates of $515.4 million (8.9% year-on-year decline, 1.6% beat)
- Adjusted EPS: $0.83 vs analyst estimates of $0.77 (7.6% beat)
- Adjusted EBITDA: $170.2 million vs analyst estimates of $356.5 million (32.5% margin, 52.3% miss)
- Operating Margin: -6.5%, down from 23.1% in the same quarter last year
- Free Cash Flow Margin: 8.4%, down from 16.9% in the same quarter last year
- Market Capitalization: $2.79 billion
Company Overview
Taking the path less traveled in the oil industry by choosing not to operate its own wells, Northern Oil and Gas (NYSE:NOG) acquires minority stakes in oil and gas wells operated by other companies across major U.S. shale basins.
Northern Oil and Gas pursues a distinctive business model in the oil and gas sector. Rather than drilling and operating its own wells, the company purchases non-operated working interests and mineral rights in properties across the United States. This approach allows it to participate in thousands of wells without bearing the operational responsibilities or concentrated risks that come with being the operator. As of late 2024, the company held interests in over 10,000 producing wells, with an average working interest of about 10% per well, spread across more than 90 different operating partners.
The company concentrates its investments in four major producing regions: the Permian Basin in West Texas and New Mexico, the Williston Basin in North Dakota (known for the Bakken formation), the Appalachian Basin in the northeastern United States (primarily natural gas from the Marcellus and Utica shales), and the Uinta Basin in Utah. By diversifying across multiple basins and numerous operators, Northern Oil and Gas reduces its exposure to any single well failure, operational mishap, or regional downturn.
The company generates revenue by selling its proportional share of oil and natural gas production from these wells. For example, if Northern Oil and Gas owns a 10% working interest in a well that produces 1,000 barrels of oil per day, it receives 100 barrels of oil to sell. The operating partners handle the actual drilling, production, and marketing of the hydrocarbons, while Northern Oil and Gas receives its share of the proceeds minus its proportionate share of operating costs. The company typically hedges a significant portion of its anticipated production to protect against price volatility in commodity markets.
4. U.S. Shale E&P
US shale oil producers extract crude from tight rock formations using horizontal drilling and hydraulic fracturing (fracking) techniques, primarily in basins like the Permian, Bakken, and Eagle Ford. Tailwinds include short-cycle investment flexibility allowing rapid production adjustments, technological improvements enhancing well productivity, and proximity to refining and export infrastructure. Capital discipline has improved financial returns. Headwinds include commodity price sensitivity affecting drilling economics, accelerating well decline rates requiring continuous capital investment, and increasing regulatory and ESG scrutiny. Water usage, induced seismicity concerns, and evolving environmental regulations present ongoing operational challenges.
Northern Oil and Gas competes with other non-operated oil and gas companies like Sitio Royalties (NYSE:STR) and Kimbell Royalty Partners (NYSE:KRP), as well as traditional exploration and production companies that also acquire non-operated interests.
5. Economies of Scale
The size of the revenue base is a way to assess topline, and it tells an investor whether an Energy producer has crossed the line between being a more vulnerable commodity taker and a durable operating platform. Scaled businesses tend to produce and generate revenue from many wells, pads, takeaway routes, and geographies, not just a single field or drilling program. Northern Oil and Gas’s $2.3 billion of revenue in the last year lacks scale in an industry where it matters.
6. Revenue Growth
A company’s long-term performance can give signals about its business quality. Even a bad business, especially in a cyclical industry, can shine for a year or so, but a top-tier one should exhibit resilience through cycles. Thankfully, Northern Oil and Gas’s 35% annualized revenue growth over the last five years was incredible. Its growth surpassed the average energy upstream and integrated energy company and shows its offerings resonate with customers, a great starting point for our analysis.
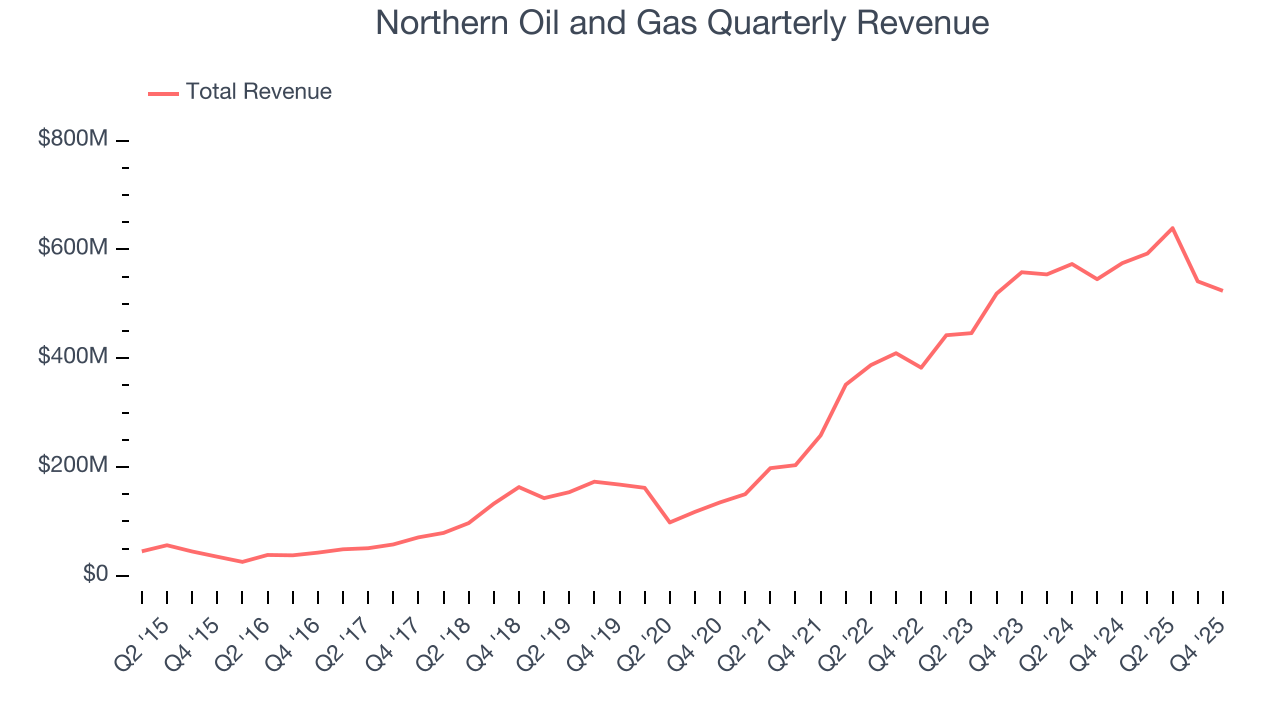
Energy cycles can be long enough that a single five-year period can still reflect one price environment, which is why an additional, decade-long view can help capture through-cycle performance. Northern Oil and Gas’s annualized revenue growth of 28.9% over the last ten years is below its five-year trend, but we still think the results suggest decent demand.
While looking at revenue is important, it can also introduce noise around commodity prices and M&A. Analyzing production, on the other hand, highlights what is happening inside the asset base and whether the economic footprint of a company is expanding. Over the last two years, Northern Oil and Gas’s total oil volume per day - Upstream averaged 25.4% year-on-year growth while natural gas volume per day - Upstream averaged 12.9% year-on-year growth, which was good. 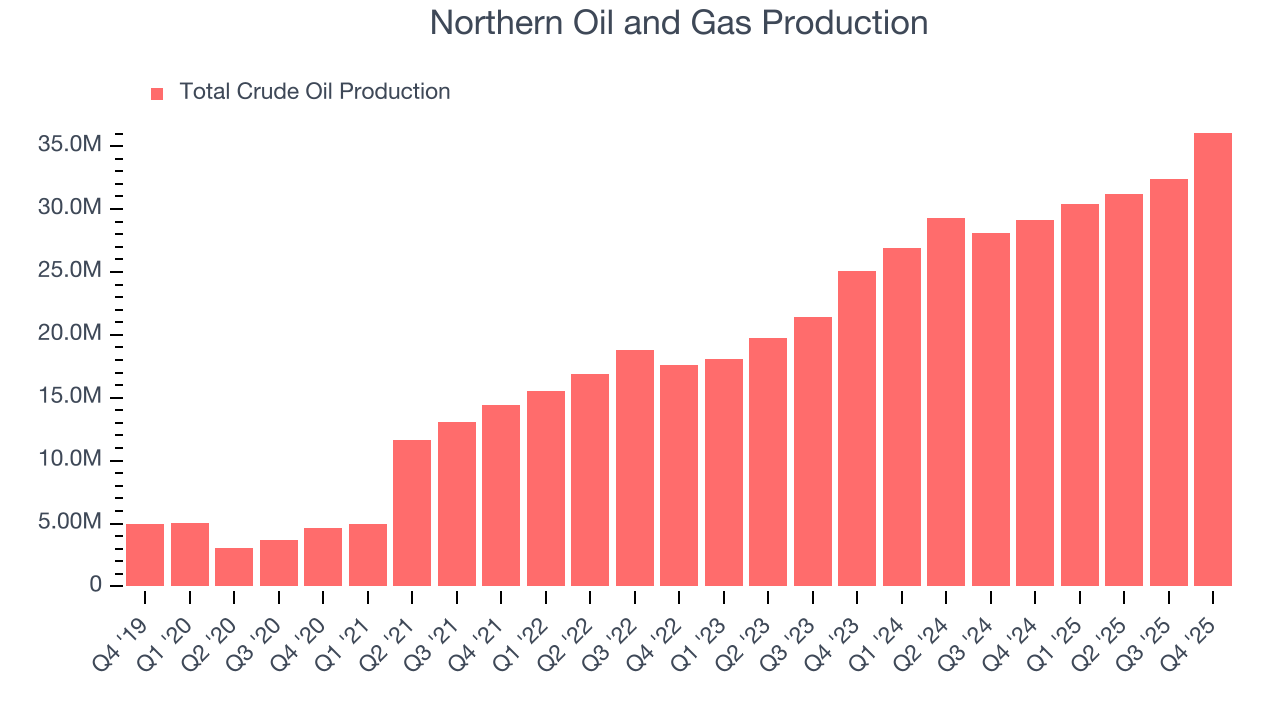
This quarter, Northern Oil and Gas’s revenue fell by 8.9% year on year to $523.8 million but beat Wall Street’s estimates by 1.6%. This quarter, Northern Oil and Gas reported robust year-on-year production growth of 23.7%, and its 36,079 Mboe (thousand barrels of oil equivalent) of production topped Wall Street estimates by 9.4%.
7. Gross Margin
In any given year, energy gross margins are heavily influenced by prices, hedging, and cost inflation, but over a full cycle these gross margins reveal which producers are structurally advantaged through superior “rock” quality, infrastructure access, and cost position.
Northern Oil and Gas, which averaged 81% gross margin over the last five years, exhibits enviable unit economics in the sector. It means the company will remain profitable at lower commodity prices than peers with inferior gross margins and serves as an advantaged starting point for ultimate operating profits and free cash flow generation. 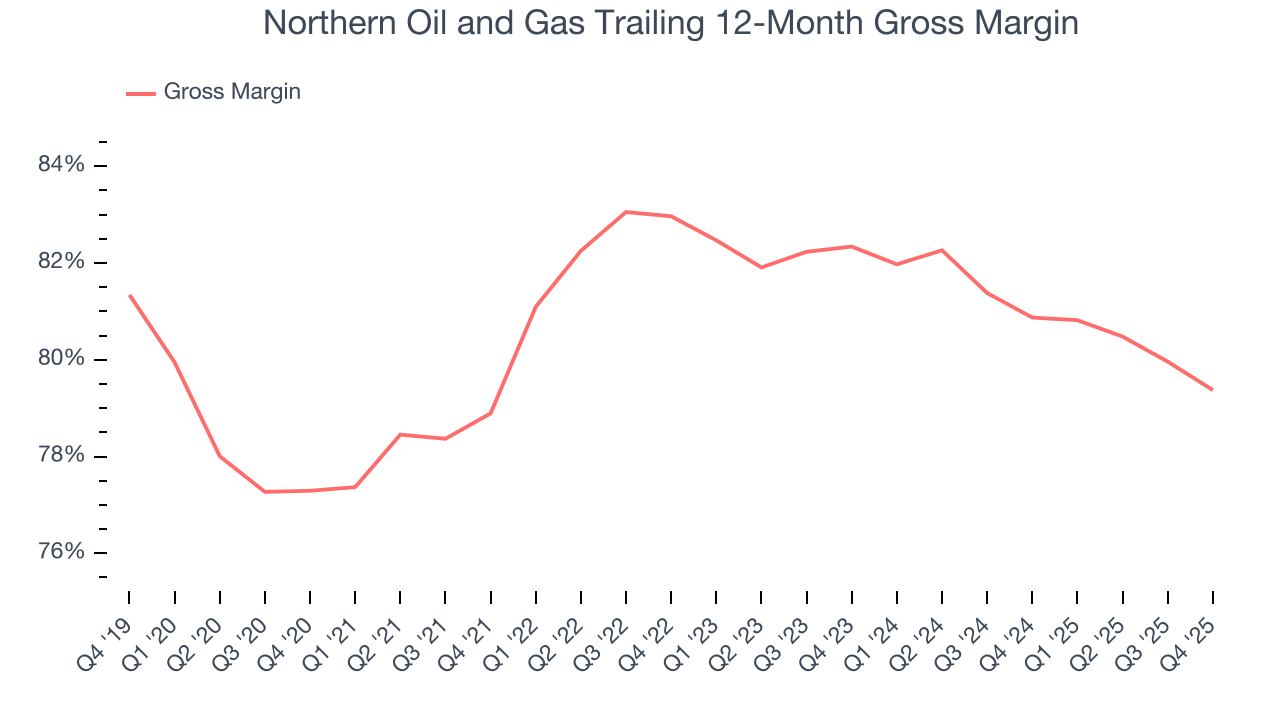
This quarter, Northern Oil and Gas’s gross profit margin was 77.1%, down 2.6 percentage points year on year.
8. Adjusted EBITDA Margin
Northern Oil and Gas has been a well-oiled machine over the last five years. It demonstrated elite profitability for an upstream and integrated energy business, boasting an average EBITDA margin of 63%.
Looking at the trend in its profitability, Northern Oil and Gas’s EBITDA margin rose by 19.2 percentage points over the last year, as its sales growth gave it immense operating leverage.
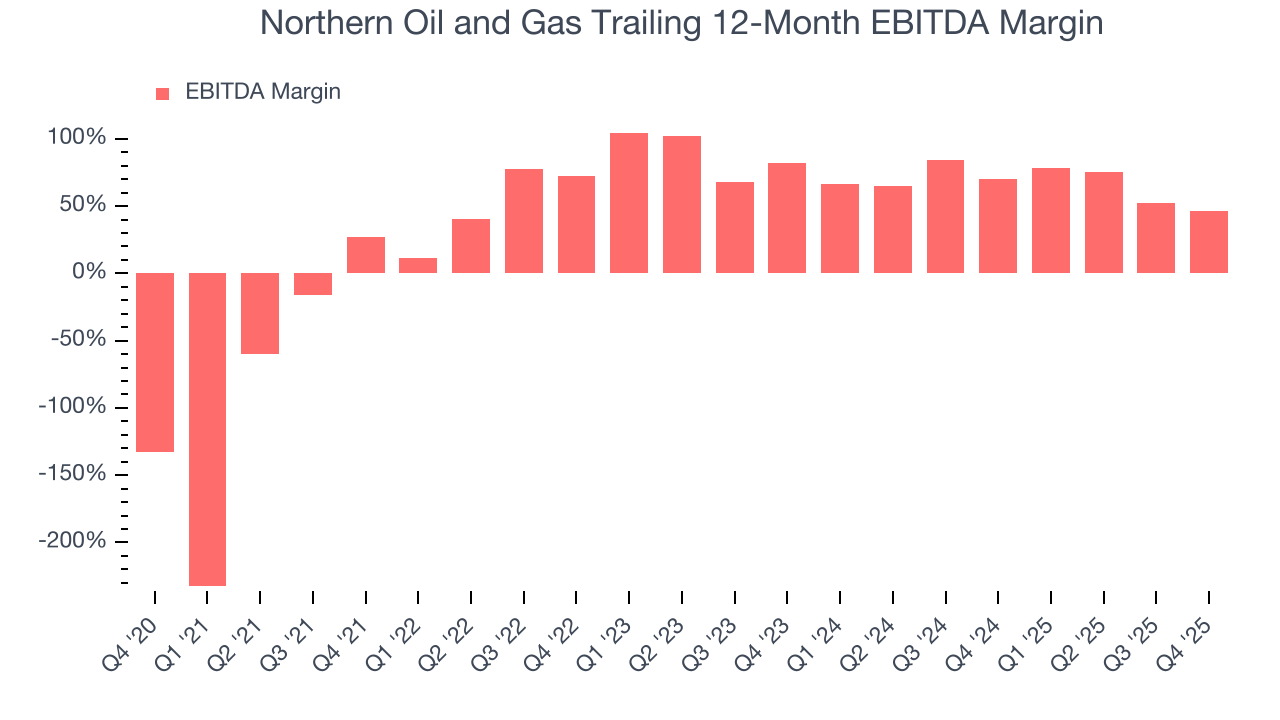
In Q4, Northern Oil and Gas generated an EBITDA margin profit margin of 32.5%, down 26.2 percentage points year on year. This contraction shows it was less efficient because its expenses increased relative to its revenue. This adjusted EBITDA fell short of Wall Street’s estimates.
9. Cash Is King
As mentioned above, adjusted EBITDA ignores capital structure and drilling expenditure decisions. These are two huge aspects of an Energy producer, so in order to understand a comprehensive picture of business quality, an investor needs to account for these. Said differently, adjusted EBITDA margins could be solid but free cash flow is abysmal because decline rates of the asset are extreme and the drilling is expensive. Free cash flow tells you about not only the economics of the production that has happened but how much it costs to stay in business as well (further drilling or extraction).
Northern Oil and Gas has shown terrific cash profitability, driven by its lucrative business model that enables it to reinvest, return capital to investors, and stay ahead of the competition. The company’s free cash flow margin was among the best in the energy upstream and integrated energy sector, averaging 25.6% over the last five years.
While the level of free cash flow margins is important, their consistency matters just as much.
Northern Oil and Gas’s ratio of quarterly free cash flow volatility to WTI Crude price volatility over the past five years was 2.2 (lower is better), indicating unusually strong insulation from commodity swings. This stability supports superior capital access in downturns and positions Northern Oil and Gas to act as a consolidator when weaker peers are forced to retrench.
You may be asking why we wait until the free cash flow line to perform this stability analysis versus commodity prices. Why not compare revenue or EBITDA to WTI Crude prices in the case of Northern Oil and Gas? Because what ultimately matters is not how much revenue or profit you earn when prices are high but how much cash you can generate when prices are low. Free cash flow is the superior metric because it includes everything from hedging prowess to growth and maintenance capex to management behavior during good times and bad.
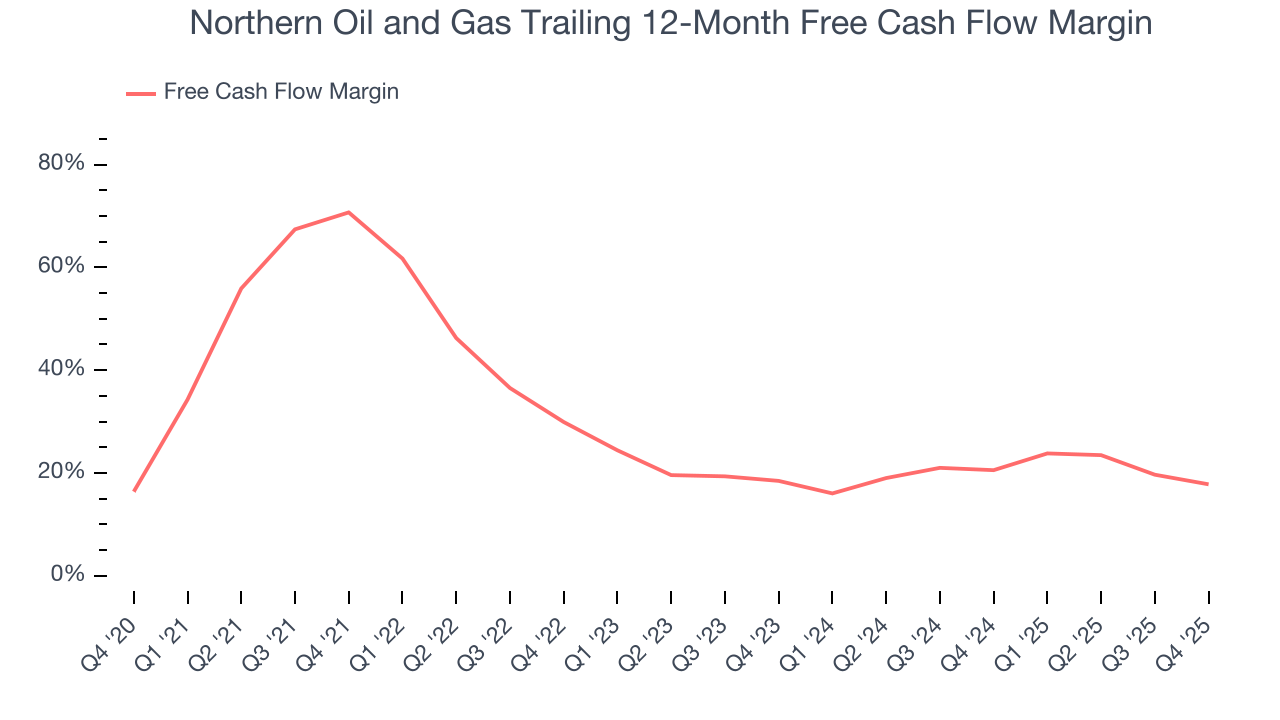
Northern Oil and Gas’s free cash flow clocked in at $44.06 million in Q4, equivalent to a 8.4% margin. The company’s cash profitability regressed as it was 8.5 percentage points lower than in the same quarter last year, which isn’t ideal considering its longer-term trend.
10. Return on Invested Capital (ROIC)
Free cash flow shows how much money a producer generated, while ROIC shows how efficiently that money was earned. ROIC measures the operating profit produced for each dollar of capital invested, whether from debt or equity. Cash generation measures quantity while ROIC measures the quality of value creation.
We at StockStory like to look at ROIC over a ten-year period because energy investment cycles can involve up to five years of ramping production and another five years of harvesting. A decade view captures buying, extracting, and monetizing rather than just part of that picture. Northern Oil and Gas’s management team makes decent investment decisions and generates value for shareholders. Its nine-year average ROIC was 10.4%, slightly better than typical energy upstream and integrated energy business.
We like to invest in businesses with high returns, but the trend in a company’s ROIC is what often surprises the market and moves the stock price. Over the last few years, Northern Oil and Gas’s ROIC has unfortunately decreased significantly. Only time will tell if its new bets can bear fruit and potentially reverse the trend.
11. Balance Sheet Assessment
Northern Oil and Gas reported $14.3 million of cash and $2.4 billion of debt on its balance sheet in the most recent quarter. As investors in high-quality companies, we primarily focus on two things: 1) that a company’s debt level isn’t too high and 2) that its interest payments are not excessively burdening the business.
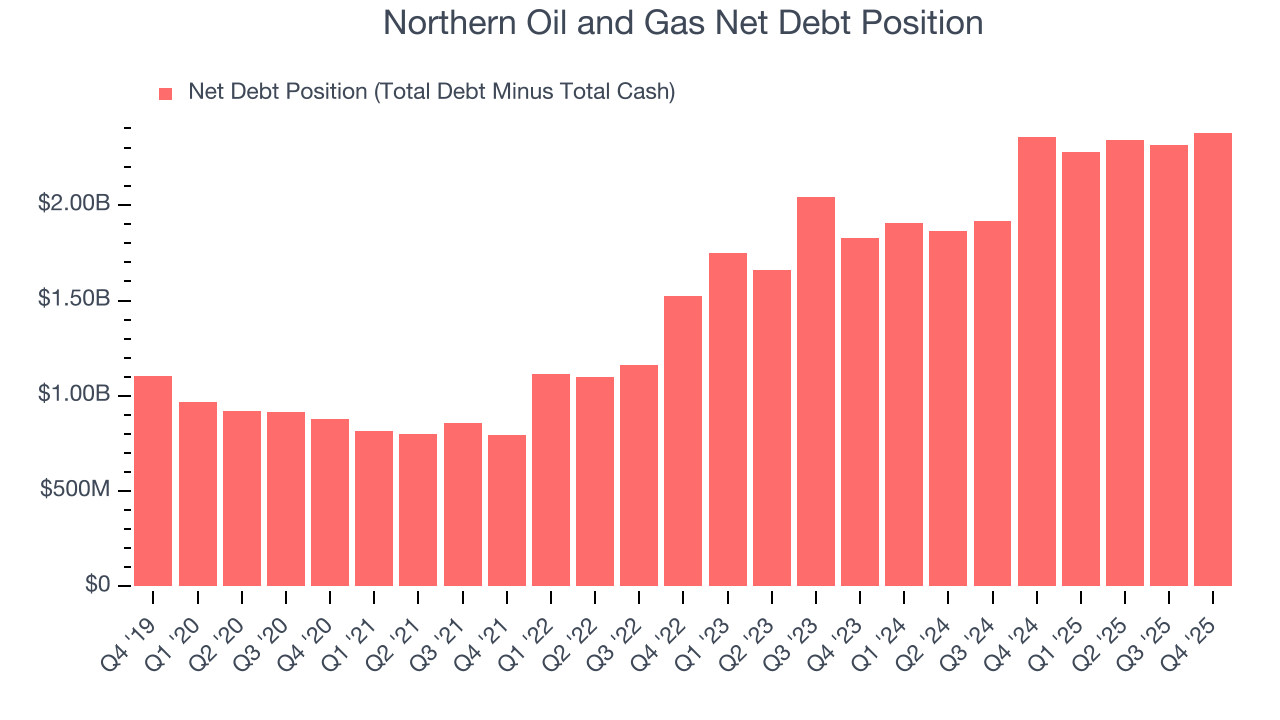
With $1.06 billion of EBITDA over the last 12 months, we view Northern Oil and Gas’s 2.2× net-debt-to-EBITDA ratio as safe. We also see its $172.9 million of annual interest expenses as appropriate. The company’s profits give it plenty of breathing room, allowing it to continue investing in growth initiatives.
12. Key Takeaways from Northern Oil and Gas’s Q4 Results
We were impressed by how significantly Northern Oil and Gas blew past analysts’ production expectations this quarter. We were also happy its revenue outperformed Wall Street’s estimates. On the other hand, its EBITDA missed. Zooming out, we think this was a mixed quarter. Investors were likely hoping for more, and shares traded down 1.5% to $28.44 immediately after reporting.
13. Is Now The Time To Buy Northern Oil and Gas?
Updated: March 12, 2026 at 12:31 AM EDT
We think that the latest earnings result is only one piece of the bigger puzzle. If you’re deciding whether to own Northern Oil and Gas, you should also grasp the company’s longer-term business quality and valuation.
Northern Oil and Gas is a rock-solid business worth owning. For starters, its revenue growth over the last five years was top-tier for the sector. And while its diminishing returns show management's recent bets still have yet to bear fruit, its revenue growth over the last ten years was top-tier for the sector. On top of that, Northern Oil and Gas’s admirable gross margin indicates excellent unit economics.
Northern Oil and Gas’s P/E ratio based on the next 12 months is 9.6x. Analyzing the energy upstream and integrated energy landscape today, Northern Oil and Gas’s positive attributes shine bright. We like the stock at this bargain price.
Wall Street analysts have a consensus one-year price target of $31.11 on the company (compared to the current share price of $27.78), implying they see 12% upside in buying Northern Oil and Gas in the short term.