
Diamondback Energy (FANG)
Not many stocks excite us like Diamondback Energy. Its fusion of high growth and profitability makes it an unstoppable force with big upside.― StockStory Analyst Team
1. News


2. Summary
Why We Like Diamondback Energy
Sporting one of Wall Street's most memorable ticker symbols, Diamondback Energy (NASDAQ:FANG) drills for and produces oil and natural gas from underground rock formations in the Permian Basin of West Texas and New Mexico.
- Annual revenue growth of 42.1% over the last ten years was superb and indicates its market share increased during this cycle
- Enormous revenue base of $15.03 billion provides significant leverage in supplier negotiations
- Attractive asset base leads to wonderful unit economics and a best-in-class gross margin of 81%


Diamondback Energy is a no-brainer. The price looks fair when considering its quality, and we think now is a good time to invest in the stock.
Why Is Now The Time To Buy Diamondback Energy?


At $176.60 per share, Diamondback Energy trades at 17.4x forward P/E. Valuation is lower than most companies in the energy upstream and integrated energy space, and we believe Diamondback Energy is attractively-priced for its quality.
Entry price matters far less than business fundamentals if you’re investing for a multi-year period. But if you can get a bargain price it’s certainly icing on the cake.
3. Diamondback Energy (FANG) Research Report: Q4 CY2025 Update
Oil and gas producer Diamondback Energy (NASDAQ:FANG) reported Q4 CY2025 results beating Wall Street’s revenue expectations, but sales fell by 7.1% year on year to $3.45 billion. Its non-GAAP profit of $1.74 per share was 13.2% below analysts’ consensus estimates.
Diamondback Energy (FANG) Q4 CY2025 Highlights:
- Revenue: $3.45 billion vs analyst estimates of $3.29 billion (7.1% year-on-year decline, 4.8% beat)
- Adjusted EPS: $1.74 vs analyst expectations of $2.00 (13.2% miss)
- Adjusted EBITDA: $2.25 billion vs analyst estimates of $2.15 billion (65.4% margin, 4.8% beat)
- Operating Margin: -78.5%, down from 38% in the same quarter last year
- Free Cash Flow Margin: 40.6%, up from 37.9% in the same quarter last year
- Market Capitalization: $50.93 billion
Company Overview
Sporting one of Wall Street's most memorable ticker symbols, Diamondback Energy (NASDAQ:FANG) drills for and produces oil and natural gas from underground rock formations in the Permian Basin of West Texas and New Mexico.
The company's operations center on what geologists call unconventional resources—oil and gas trapped in tight rock formations like the Spraberry, Wolfcamp, and Bone Spring layers that can only be extracted using horizontal drilling and hydraulic fracturing techniques. These geological formations lie thousands of feet underground and contain hydrocarbons that have accumulated over millions of years. The Permian Basin, where Diamondback operates, is one of the most prolific oil-producing regions in the United States, characterized by multiple stacked rock layers that can be accessed from a single drilling location.
Diamondback's business model involves acquiring land rights (either through ownership or leases), drilling wells to reach the oil and gas deposits, and then selling the extracted hydrocarbons to refineries, traders, and other buyers. A typical well might extend one to two miles horizontally through the target rock formation, with production continuing for decades. For example, a refinery purchasing Diamondback's crude oil might process it into gasoline, diesel fuel, and jet fuel for transportation markets.
The company also operates through Viper Energy, a publicly traded subsidiary that owns mineral rights—the legal entitlement to resources beneath the surface—across nearly one million gross acres in the Permian Basin. When operators drill on these lands, Viper collects royalty payments based on the value of production, without bearing the costs of drilling or operations. This creates a revenue stream that complements Diamondback's drilling-focused business, providing exposure to wells drilled by both Diamondback and other operators across the region.
4. U.S. Shale E&P
US shale oil producers extract crude from tight rock formations using horizontal drilling and hydraulic fracturing (fracking) techniques, primarily in basins like the Permian, Bakken, and Eagle Ford. Tailwinds include short-cycle investment flexibility allowing rapid production adjustments, technological improvements enhancing well productivity, and proximity to refining and export infrastructure. Capital discipline has improved financial returns. Headwinds include commodity price sensitivity affecting drilling economics, accelerating well decline rates requiring continuous capital investment, and increasing regulatory and ESG scrutiny. Water usage, induced seismicity concerns, and evolving environmental regulations present ongoing operational challenges.
Diamondback Energy's competitors in the Permian Basin include EOG Resources (NYSE:EOG), ConocoPhillips (NYSE:COP), Occidental Petroleum (NYSE:OXY), Pioneer Natural Resources (now part of Exxon Mobil), and Continental Resources (NYSE:CLR).
5. Economies of Scale
The scale of a company’s revenue base is an important lens through which to view the topline, as it signals whether a producer has gone from a vulnerable commodity taker into a durable operating platform. Larger producers generate revenue across many wells, pads, takeaway routes, and geographies rather than relying on a single field or drilling program. Diamondback Energy’s $15.1 billion of revenue in the last year is top-tier for the industry, suggesting the type of diversification that reduces operational risk.
6. Revenue Growth
A company’s long-term performance can give signals about its business quality. Even a bad business, especially in a cyclical industry, can shine for a year or so, but a top-tier one should exhibit resilience through cycles. Thankfully, Diamondback Energy’s 39.9% annualized revenue growth over the last five years was incredible. Its growth surpassed the average energy upstream and integrated energy company and shows its offerings resonate with customers, a great starting point for our analysis.
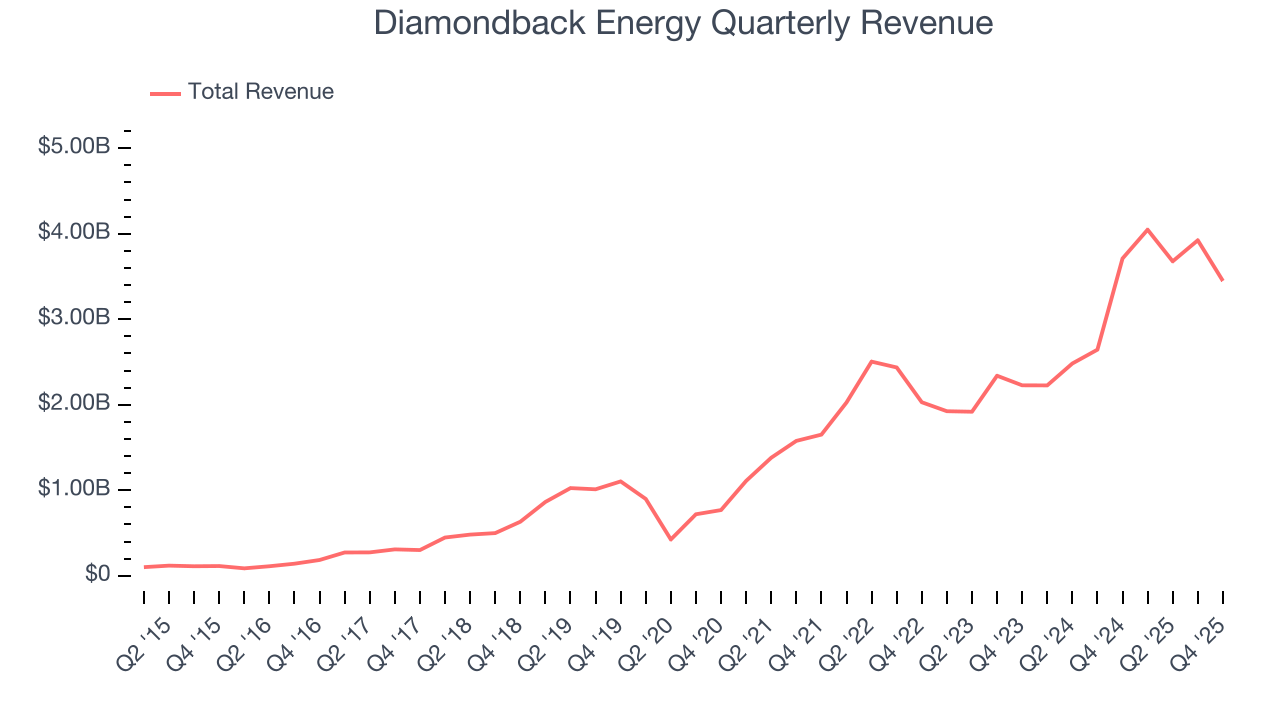
Within Energy, a singular timeframe, even if it’s quite long-term, only sheds light on how well a company rode the last commodity cycle. To better assess whether a company compounds through cycles, we validate our view with an even longer, ten-year view. Diamondback Energy’s annualized revenue growth of 42.2% over the last ten years is above its five-year trend.
While looking at revenue is important, it can also introduce noise around commodity prices and M&A. Analyzing drivers of revenue, on the other hand, highlights what is happening inside the asset base and whether the economic footprint of a company is expanding. Over the last two years, Diamondback Energy’s total oil volume per day - Upstream averaged 40.8% year-on-year growth while natural gas volume per day - Upstream averaged 56.9% year-on-year growth, which was good. 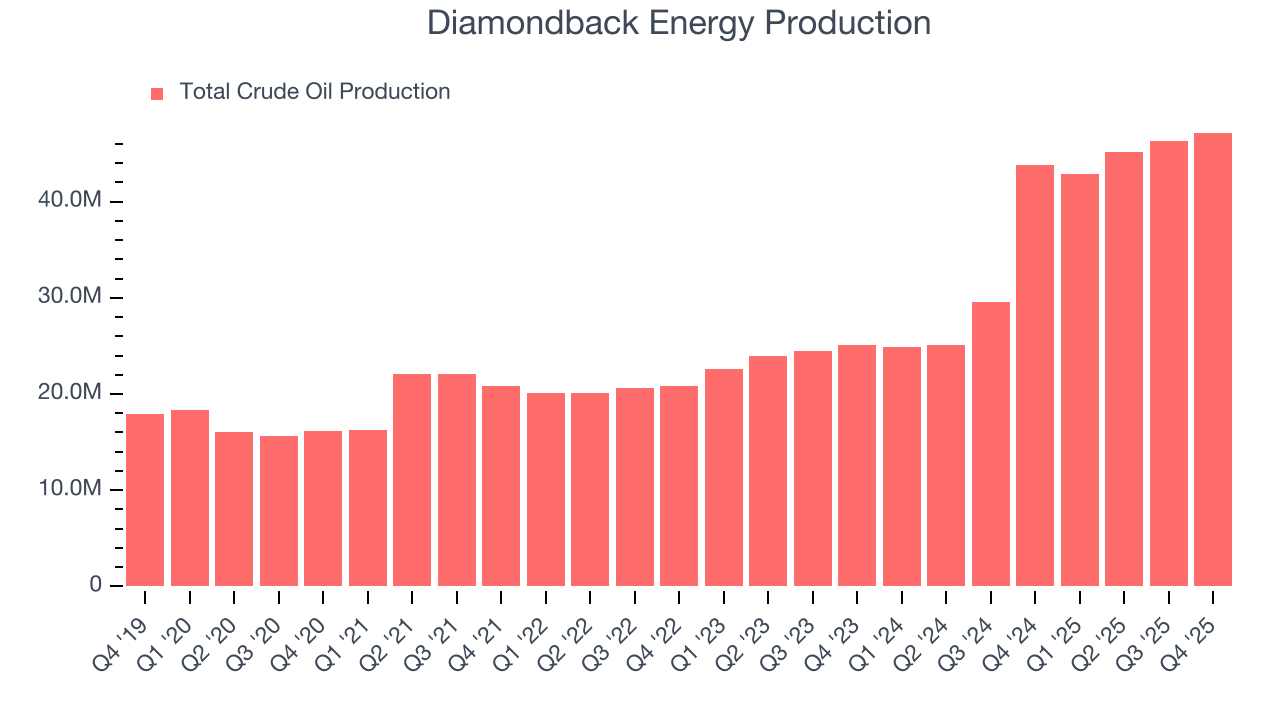
This quarter, Diamondback Energy’s revenue fell by 7.1% year on year to $3.45 billion but beat Wall Street’s estimates by 4.8%. This quarter, Diamondback Energy grew its production by 7.7% year on year, and its 47,174 Mboe (thousand barrels of oil equivalent) of production was in line with Wall Street’s estimates.
7. Gross Margin
In a single quarter or year, gross margins in the sector can swing wildly due to commodity prices, hedging, or changes in labor costs. Over a multi-year period across different points in the cycle, gross margin differences can signal whether a company is a structurally-advantaged producer (“rock” quality, takeaway, operating costs) or not.
Diamondback Energy, which averaged 81% gross margin over the last five years, exhibits enviable unit economics in the sector. It means the company will remain profitable at lower commodity prices than peers with inferior gross margins and serves as an advantaged starting point for ultimate operating profits and free cash flow generation. 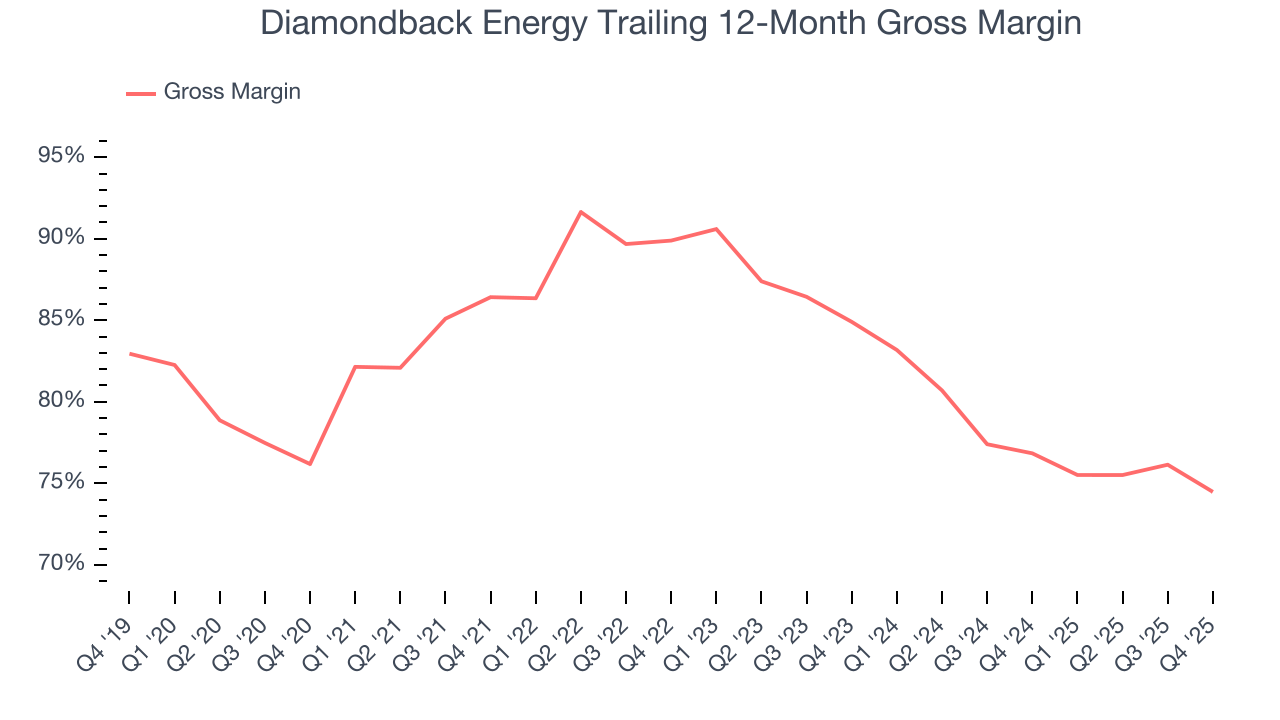
Diamondback Energy produced a 71.9% gross profit margin in Q4, down 7.1 percentage points year on year.
8. Adjusted EBITDA Margin
Diamondback Energy has been a well-oiled machine over the last five years. It demonstrated elite profitability for an upstream and integrated energy business, boasting an average EBITDA margin of 72.7%.
Analyzing the trend in its profitability, Diamondback Energy’s EBITDA margin decreased by 6 percentage points over the last year. This raises questions about the company’s expense base because its revenue growth should have given it leverage on its fixed costs, resulting in better economies of scale and profitability.
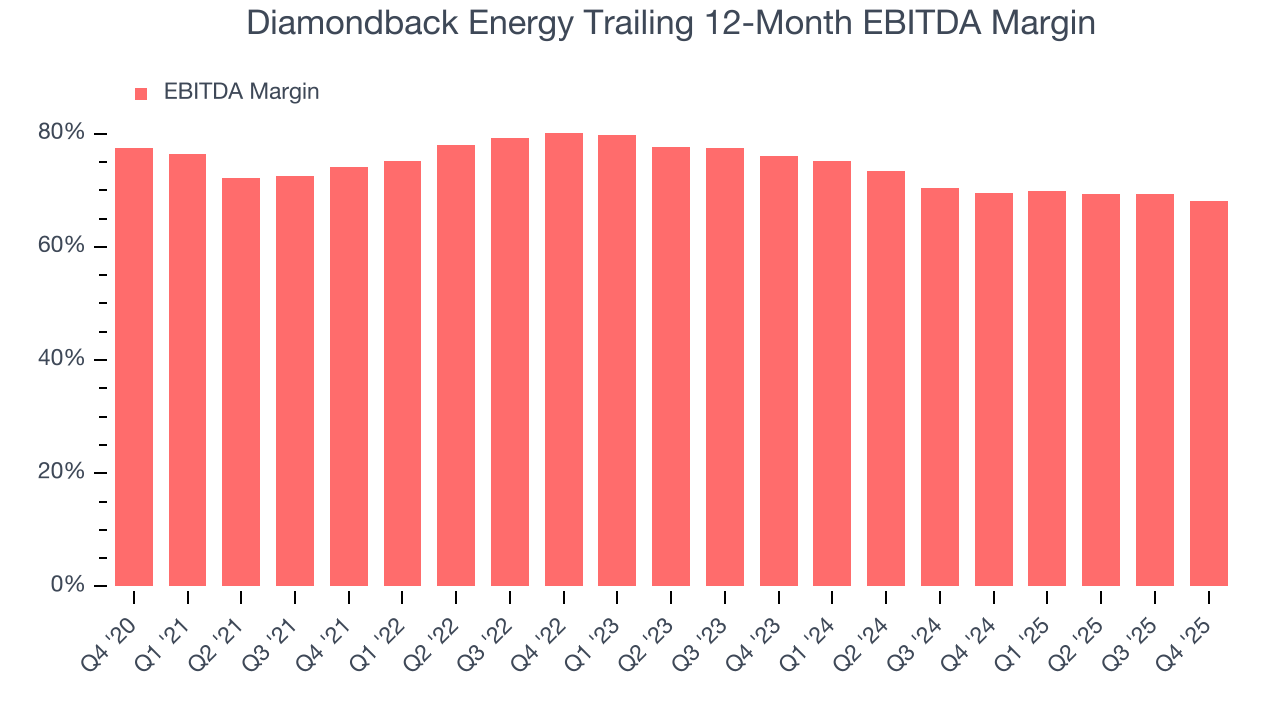
This quarter, Diamondback Energy generated an EBITDA margin profit margin of 65.4%, down 5.3 percentage points year on year. This contraction shows it was less efficient because its expenses increased relative to its revenue. This adjusted EBITDA beat Wall Street’s estimates by 4.8%.
9. Cash Is King
Adjusted EBITDA shows how profitable a company’s existing wells are before financing and reinvestment decisions, but free cash flow shows how much value remains after paying the cost of replacing those wells. In upstream energy, production naturally declines over time, so companies must continuously reinvest just to stand still. A producer can report strong EBITDA margins yet generate little or no free cash flow if its wells decline quickly or if new drilling is expensive. Free cash flow therefore captures not only how efficiently a company produces hydrocarbons today, but also how costly it is to sustain that production into the future.
Diamondback Energy has shown terrific cash profitability, driven by its lucrative business model that enables it to reinvest, return capital to investors, and stay ahead of the competition. The company’s free cash flow margin was among the best in the energy upstream and integrated energy sector, averaging an eye-popping 38.3% over the last five years.
While the level of free cash flow margins is important, their consistency matters just as much.
Diamondback Energy’s ratio of quarterly free cash flow volatility to WTI Crude price volatility over the past five years was 2.3 (lower is better), indicating unusually strong insulation from commodity swings. This stability supports superior capital access in downturns and positions Diamondback Energy to act as a consolidator when weaker peers are forced to retrench.
You may be asking why we wait until the free cash flow line to perform this stability analysis versus commodity prices. Why not compare revenue or EBITDA to WTI Crude prices in the case of Diamondback Energy? Because what ultimately matters is not how much revenue or profit you earn when prices are high but how much cash you can generate when prices are low. Free cash flow is the superior metric because it includes everything from hedging prowess to growth and maintenance capex to management behavior during good times and bad.
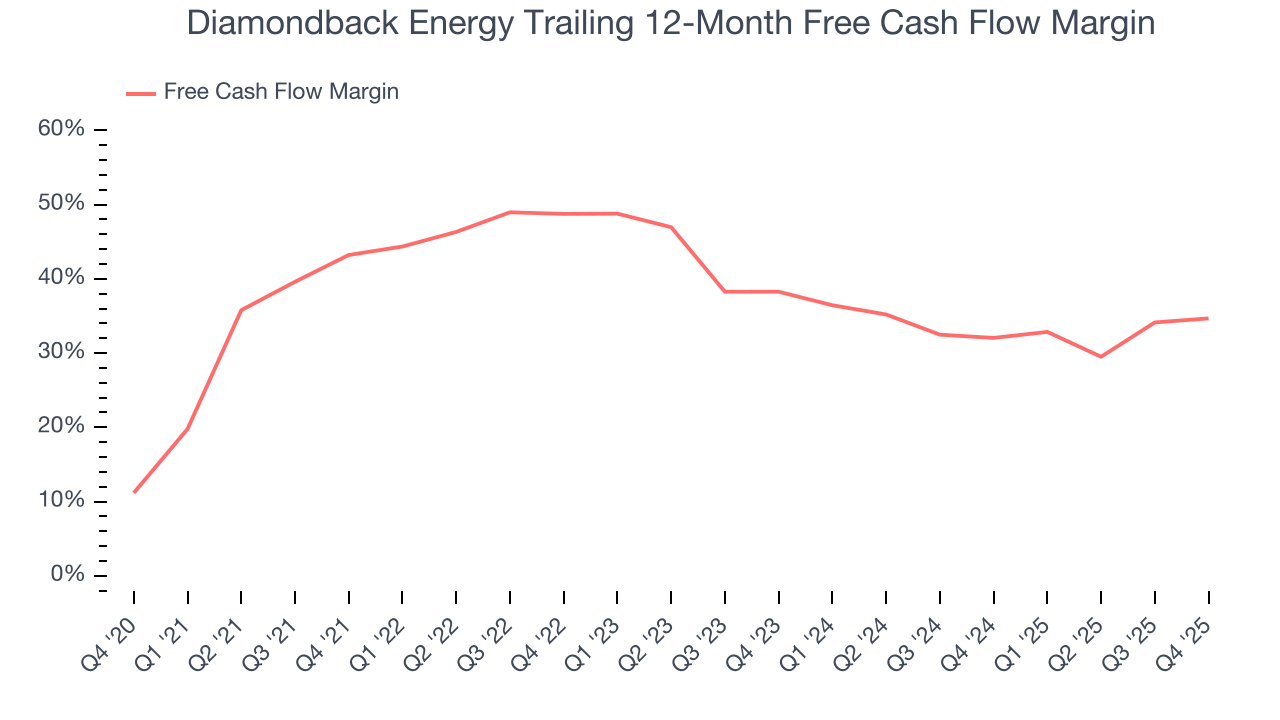
Diamondback Energy’s free cash flow clocked in at $1.4 billion in Q4, equivalent to a 40.6% margin. This result was good as its margin was 2.7 percentage points higher than in the same quarter last year. Its cash profitability was also above its five-year level, and we hope the company can build on this trend.
10. Return on Invested Capital (ROIC)
Free cash flow shows how much money a producer generated, while ROIC shows how efficiently that money was earned. ROIC measures the operating profit produced for each dollar of capital invested, whether from debt or equity. Cash generation measures quantity while ROIC measures the quality of value creation.
We at StockStory like to look at ROIC over a ten-year period because energy investment cycles can involve up to five years of ramping production and another five years of harvesting. A decade view captures buying, extracting, and monetizing rather than just part of that picture. Although Diamondback Energy has shown solid fundamentals lately, it historically did a mediocre job investing in profitable growth initiatives. Its ten-year average ROIC was 5.5%, somewhat low compared to the best energy upstream and integrated energy companies that consistently pump out 25%+.
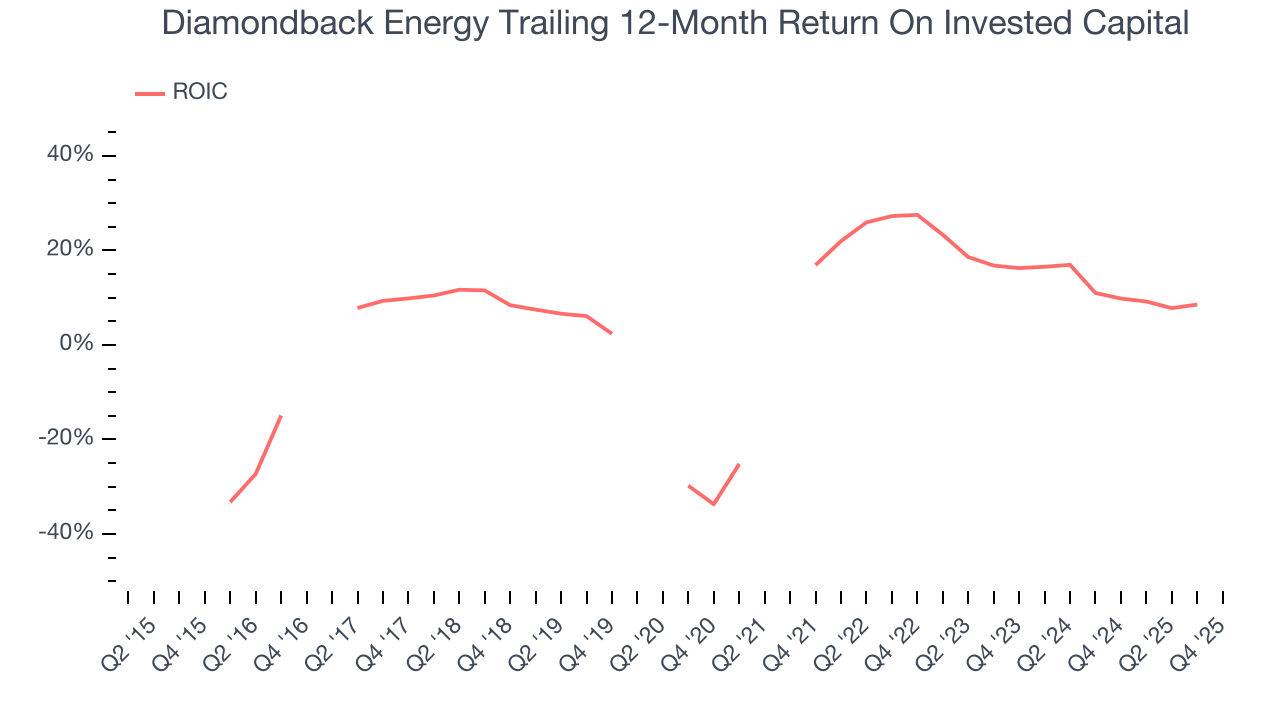 Note: Quarters not shown were determined to be outliers, impacted by outsized investment gains/losses that are not indicative of the recurring fundamentals of the business.
We like to invest in businesses with high returns, but the trend in a company’s ROIC is what often surprises the market and moves the stock price. Over the last few years, Diamondback Energy’s ROIC has unfortunately decreased significantly. If its returns keep falling, it could suggest its profitable growth opportunities are drying up. We’ll keep a close eye.
11. Balance Sheet Assessment
Diamondback Energy reported $104 million of cash and $14.49 billion of debt on its balance sheet in the most recent quarter. As investors in high-quality companies, we primarily focus on two things: 1) that a company’s debt level isn’t too high and 2) that its interest payments are not excessively burdening the business.
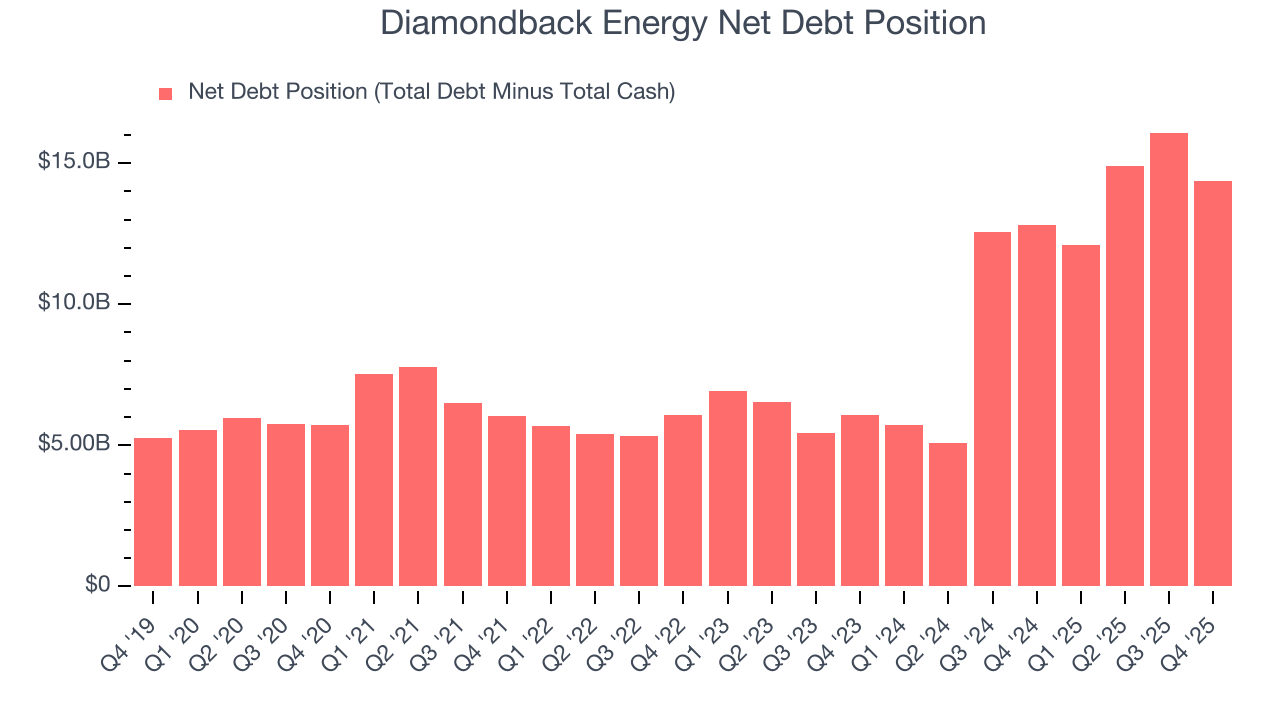
With $10.28 billion of EBITDA over the last 12 months, we view Diamondback Energy’s 1.4× net-debt-to-EBITDA ratio as safe. We also see its $226 million of annual interest expenses as appropriate. The company’s profits give it plenty of breathing room, allowing it to continue investing in growth initiatives.
12. Key Takeaways from Diamondback Energy’s Q4 Results
We were impressed by how significantly Diamondback Energy blew past analysts’ revenue expectations this quarter. We were also happy its EBITDA outperformed Wall Street’s estimates. On the other hand, its EPS missed. Overall, this print had some key positives. The stock remained flat at $181.75 immediately following the results.
13. Is Now The Time To Buy Diamondback Energy?
Updated: March 12, 2026 at 12:43 AM EDT
When considering an investment in Diamondback Energy, investors should account for its valuation and business qualities as well as what’s happened in the latest quarter.
Diamondback Energy is a cream-of-the-crop energy upstream and integrated energy company. For starters, its revenue growth over the last five years was top-tier for the sector. And while its declining EBITDA margin shows the business has become less efficient, its revenue growth over the last ten years was top-tier for the sector. On top of that, Diamondback Energy’s top-tier scale enables operational efficiencies, capital market access, and investment in advanced technologies.
Diamondback Energy’s P/E ratio based on the next 12 months is 17.4x. Looking at the energy upstream and integrated energy space today, Diamondback Energy’s qualities as one of the best businesses really stand out, and we like it at this price.
Wall Street analysts have a consensus one-year price target of $191.35 on the company (compared to the current share price of $176.60), implying they see 8.4% upside in buying Diamondback Energy in the short term.