Driven Brands (DRVN)
We’re wary of Driven Brands. Its poor sales growth shows demand is soft and its negative returns on capital suggest it destroyed value.― StockStory Analyst Team
1. News


2. Summary
Why We Think Driven Brands Will Underperform
With approximately 5,000 locations across 49 U.S. states and 13 other countries, Driven Brands (NASDAQ:DRVN) operates a network of automotive service centers offering maintenance, car washes, paint, collision repair, and glass services across North America.
- Cash-burning history makes us doubt the long-term viability of its business model
- Push for growth has led to negative returns on capital, signaling value destruction, and its shrinking returns suggest its past profit sources are losing steam
- On the plus side, its market share has increased this cycle as its 19.9% annual revenue growth over the last five years was exceptional


Driven Brands is in the doghouse. There are more promising alternatives.
Why There Are Better Opportunities Than Driven Brands


At $10.44 per share, Driven Brands trades at 8.3x forward P/E. Driven Brands’s valuation may seem like a great deal, but we think there are valid reasons why it’s so cheap.
Cheap stocks can look like a great deal at first glance, but they can be value traps. They often have less earnings power, meaning there is more reliance on a re-rating to generate good returns - an unlikely scenario for low-quality companies.
3. Driven Brands (DRVN) Research Report: Q3 CY2025 Update
Automotive services company Driven Brands (NASDAQ:DRVN) met Wall Streets revenue expectations in Q3 CY2025, but sales fell by 9.5% year on year to $535.7 million. On the other hand, the company’s full-year revenue guidance of $2.11 billion at the midpoint came in 0.6% below analysts’ estimates. Its non-GAAP profit of $0.34 per share was 13.6% above analysts’ consensus estimates.
Driven Brands (DRVN) Q3 CY2025 Highlights:
- Revenue: $535.7 million vs analyst estimates of $537.7 million (9.5% year-on-year decline, in line)
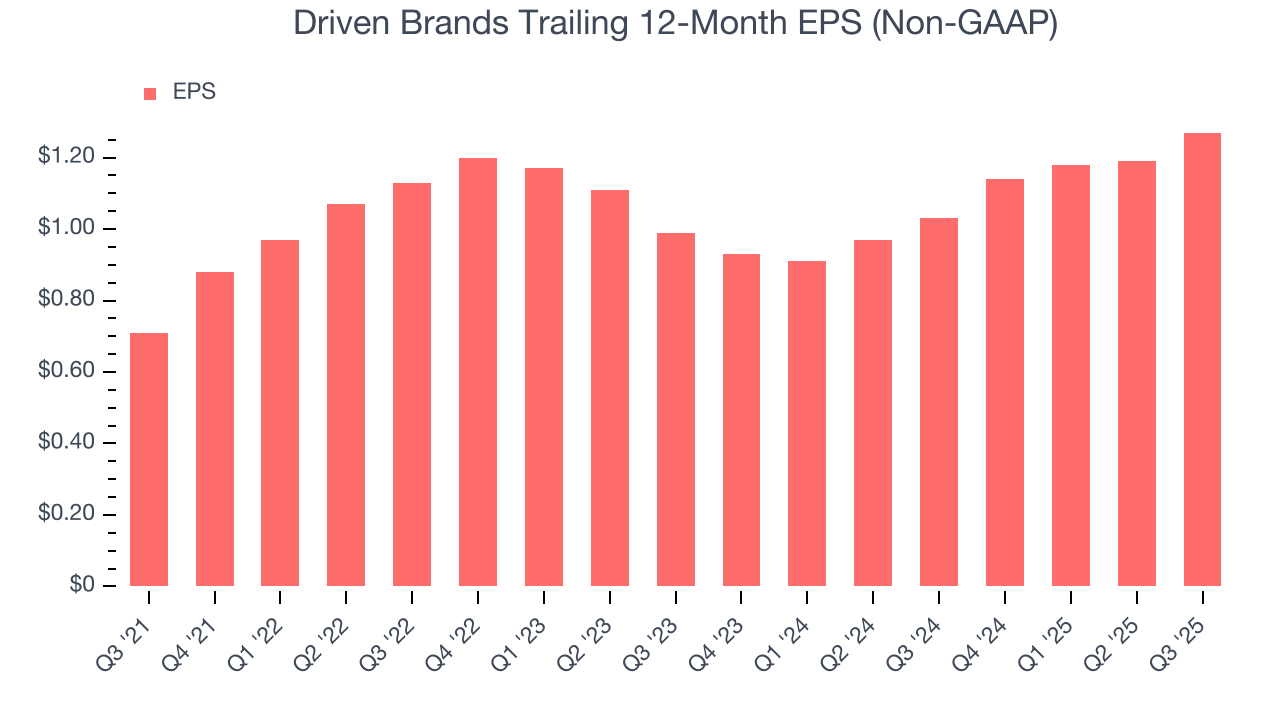
- Adjusted EPS: $0.34 vs analyst estimates of $0.30 (13.6% beat)
- Adjusted EBITDA: $136.3 million vs analyst estimates of $136.3 million (25.4% margin, in line)
- The company slightly lifted its revenue guidance for the full year to $2.11 billion at the midpoint from $2.1 billion
- Management raised its full-year Adjusted EPS guidance to $1.26 at the midpoint, a 4.6% increase
- EBITDA guidance for the full year is $530 million at the midpoint, below analyst estimates of $533.7 million
- Operating Margin: 11.6%, up from 6.7% in the same quarter last year
- Free Cash Flow Margin: 5.7%, similar to the same quarter last year
- Same-Store Sales rose 2.8% year on year (1.4% in the same quarter last year)
- Market Capitalization: $2.34 billion
Company Overview
With approximately 5,000 locations across 49 U.S. states and 13 other countries, Driven Brands (NASDAQ:DRVN) operates a network of automotive service centers offering maintenance, car washes, paint, collision repair, and glass services across North America.
Driven Brands organizes its operations into four main segments: Maintenance, Car Wash, Paint, Collision & Glass, and Platform Services. Each segment houses well-known brands that serve both retail consumers and commercial clients like fleet operators and insurance companies.
The Maintenance segment includes Take 5 Oil Change, known for its efficient drive-thru oil change service where customers remain in their vehicles, and Meineke Car Care Centers, which provides comprehensive car care services from brake repairs to exhaust system replacements.
In the Car Wash segment, Driven Brands operates over 1,100 conveyor car wash locations across North America, Europe, and Australia, primarily under the Take 5 Car Wash brand in the U.S. and IMO internationally. The company's domestic car wash business has built a strong subscription model that accounts for approximately 60% of its U.S. car wash revenue.
The Paint, Collision & Glass segment includes CARSTAR, ABRA, Fix Auto USA, and Maaco for collision and paint services, along with Uniban and Auto Glass Now (AGN) for glass repair and replacement. Maaco specializes in affordable paint services for customers who prefer not to file insurance claims, while the collision repair brands work closely with insurance carriers for more extensive repairs.
The Platform Services segment functions as an internal support system, offering distribution services through 1-800-Radiator & A/C and PH Vitres D'Autos, which supply parts to both company-owned and franchised locations. This segment also includes Spire Supply, an in-house distributor of consumable products, and the Automotive Training Institute (ATI), which provides operational and financial training.
Driven Brands' business model combines company-operated locations with a robust franchising strategy. The company leverages its scale to provide franchisees with marketing support, operational expertise, and purchasing power that independent operators couldn't access on their own. This approach has helped Driven Brands maintain a strong pipeline of franchise commitments, with agreements for approximately 1,300 new franchised units as of late 2023.
4. Industrial & Environmental Services
Growing regulatory pressure on environmental compliance and increasing corporate ESG commitments should buoy the sector for years to come. On the other hand, environmental regulations continue to evolve, and this may require costly upgrades, volatility in commodity waste and recycling markets, and labor shortages in industrial services. As for digitization, a theme that is impacting nearly every industry, the increasing use of data, analytics, and automation will give rise to improved efficiency of operations. Conversely, though, the benefits of digitization also come with challenges of integrating new technologies into legacy systems.
Driven Brands' competitors vary by segment but include Jiffy Lube and Valvoline (NYSE: VVL) in the quick oil change space, Mister Car Wash (NYSE: MCW) in the car wash segment, Service King and Caliber Collision in collision repair, and Safelite in automotive glass services.
5. Revenue Growth
A company’s long-term sales performance can indicate its overall quality. Any business can experience short-term success, but top-performing ones enjoy sustained growth for years.
With $2.17 billion in revenue over the past 12 months, Driven Brands is a mid-sized business services company, which sometimes brings disadvantages compared to larger competitors benefiting from better economies of scale. On the bright side, it can still flex high growth rates because it’s working from a smaller revenue base.
As you can see below, Driven Brands’s sales grew at an incredible 22.1% compounded annual growth rate over the last five years. This shows it had high demand, a useful starting point for our analysis.
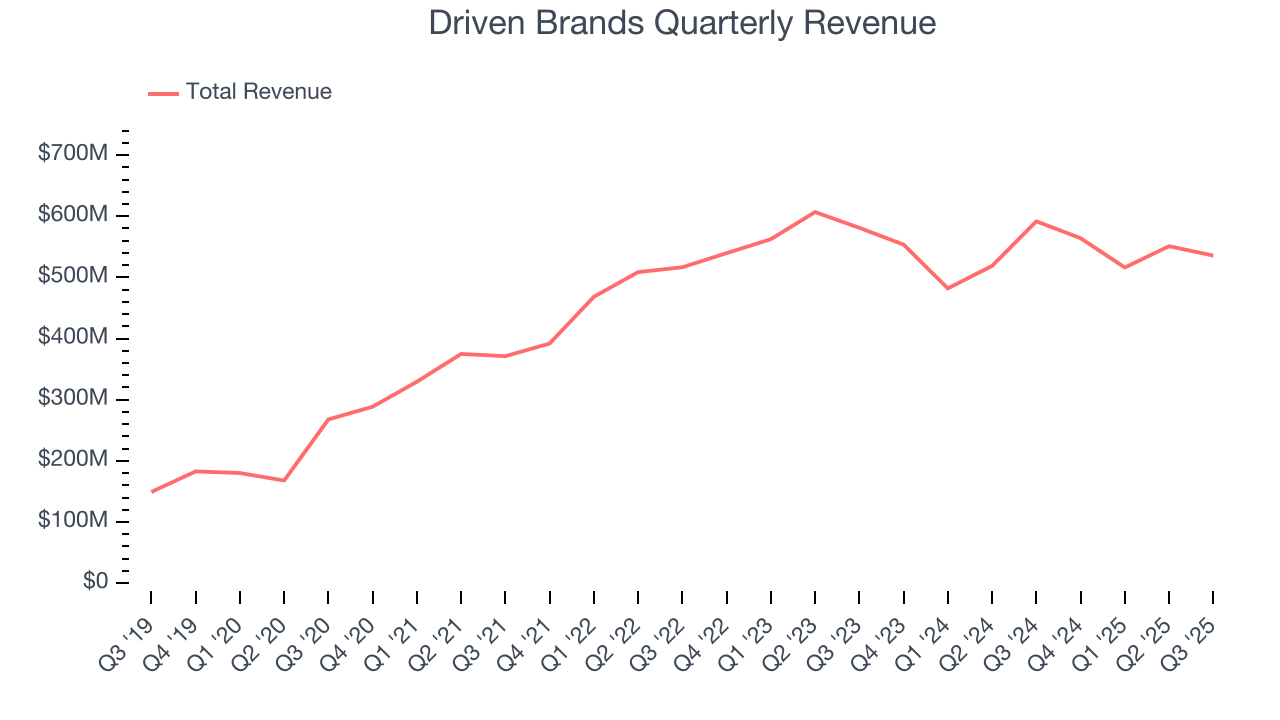
Long-term growth is the most important, but within business services, a half-decade historical view may miss new innovations or demand cycles. Driven Brands’s recent performance marks a sharp pivot from its five-year trend as its revenue has shown annualized declines of 2.7% over the last two years. 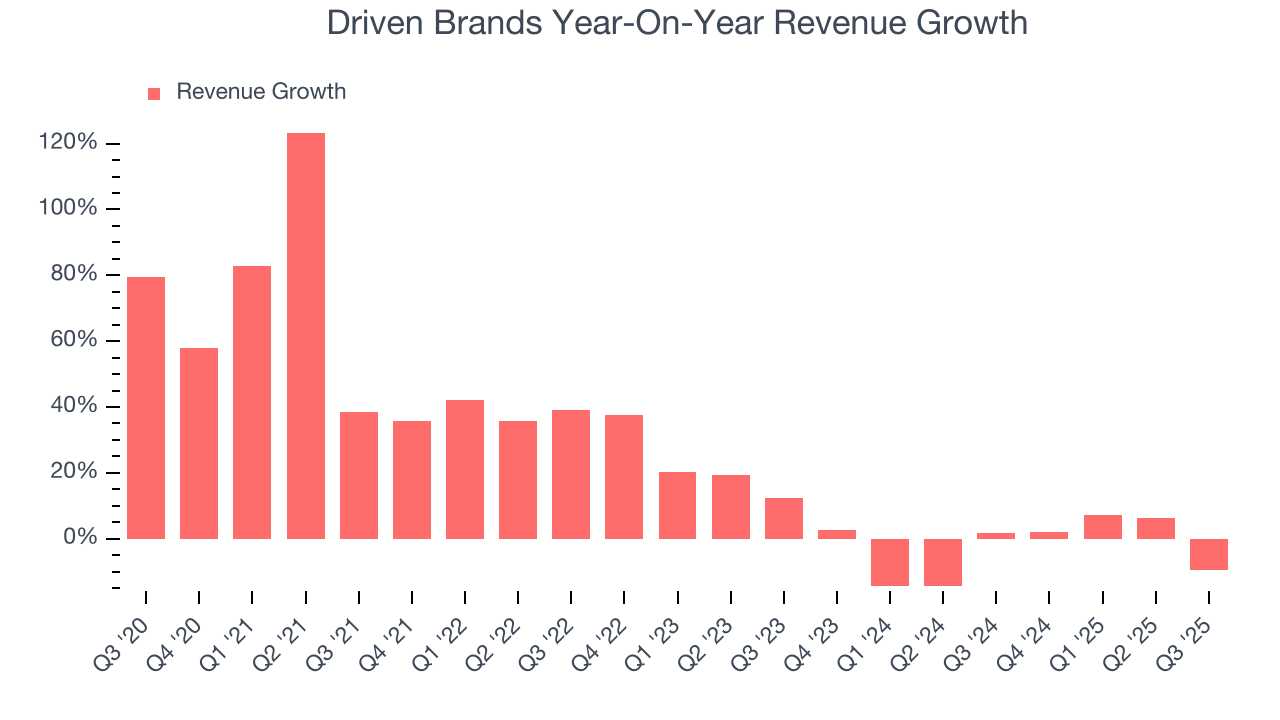
We can dig further into the company’s revenue dynamics by analyzing its same-store sales, which show how much revenue its established locations generate. Over the last two years, Driven Brands’s same-store sales averaged 2% year-on-year growth. Because this number is better than its revenue growth, we can see its sales from existing locations are performing better than its sales from new locations. 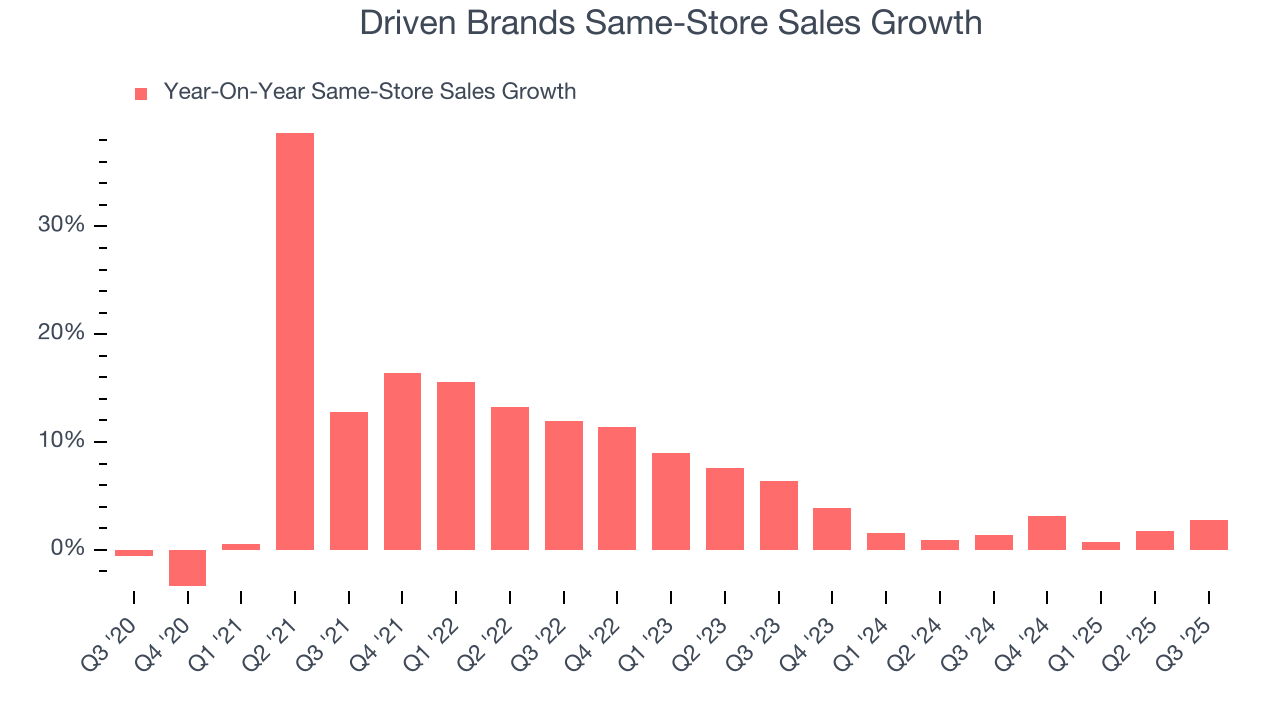
This quarter, Driven Brands reported a rather uninspiring 9.5% year-on-year revenue decline to $535.7 million of revenue, in line with Wall Street’s estimates.
Looking ahead, sell-side analysts expect revenue to grow 4.1% over the next 12 months. Although this projection implies its newer products and services will catalyze better top-line performance, it is still below average for the sector.
6. Operating Margin
Although Driven Brands was profitable this quarter from an operational perspective, it’s generally struggled over a longer time period. Its expensive cost structure has contributed to an average operating margin of negative 2.7% over the last five years. Unprofitable business services companies require extra attention because they could get caught swimming naked when the tide goes out. It’s hard to trust that the business can endure a full cycle.
Analyzing the trend in its profitability, Driven Brands’s operating margin decreased by 21.7 percentage points over the last five years. This raises questions about the company’s expense base because its revenue growth should have given it leverage on its fixed costs, resulting in better economies of scale and profitability. Driven Brands’s performance was poor no matter how you look at it - it shows that costs were rising and it couldn’t pass them onto its customers.
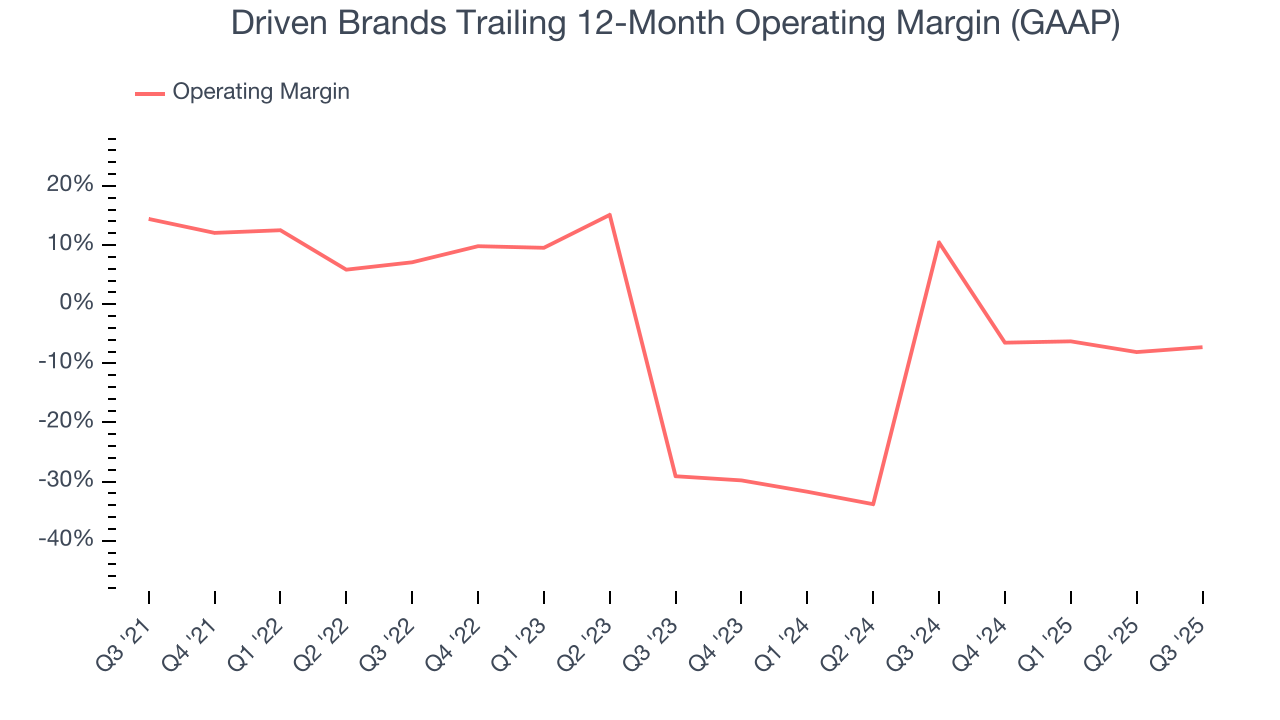
This quarter, Driven Brands generated an operating margin profit margin of 11.6%, up 4.9 percentage points year on year. This increase was a welcome development, especially since its revenue fell, showing it was more efficient because it scaled down its expenses.
7. Earnings Per Share
Revenue trends explain a company’s historical growth, but the long-term change in earnings per share (EPS) points to the profitability of that growth – for example, a company could inflate its sales through excessive spending on advertising and promotions.
Driven Brands’s full-year EPS grew at an astounding 15.6% compounded annual growth rate over the last four years, better than the broader business services sector.
Like with revenue, we analyze EPS over a shorter period to see if we are missing a change in the business.
Driven Brands’s EPS grew at a solid 13.3% compounded annual growth rate over the last two years, higher than its 2.7% annualized revenue declines. This tells us management adapted its cost structure in response to a challenging demand environment.
Diving into the nuances of Driven Brands’s earnings can give us a better understanding of its performance. Driven Brands’s operating margin has expanded over the last two years. This was the most relevant factor (aside from the revenue impact) behind its higher earnings; interest expenses and taxes can also affect EPS but don’t tell us as much about a company’s fundamentals.
In Q3, Driven Brands reported adjusted EPS of $0.34, up from $0.26 in the same quarter last year. This print easily cleared analysts’ estimates, and shareholders should be content with the results. Over the next 12 months, Wall Street expects Driven Brands’s full-year EPS of $1.27 to grow 8%.
8. Cash Is King
Although earnings are undoubtedly valuable for assessing company performance, we believe cash is king because you can’t use accounting profits to pay the bills.
While Driven Brands posted positive free cash flow this quarter, the broader story hasn’t been so clean. Driven Brands’s demanding reinvestments have drained its resources over the last five years, putting it in a pinch and limiting its ability to return capital to investors. Its free cash flow margin averaged negative 5.6%, meaning it lit $5.57 of cash on fire for every $100 in revenue.
Taking a step back, we can see that Driven Brands’s margin dropped by 4.8 percentage points during that time. It may have ticked higher more recently, but shareholders are likely hoping for its margin to at least revert to its historical level. Almost any movement in the wrong direction is undesirable because it’s already burning cash. If the longer-term trend returns, it could signal it’s in the middle of an investment cycle.
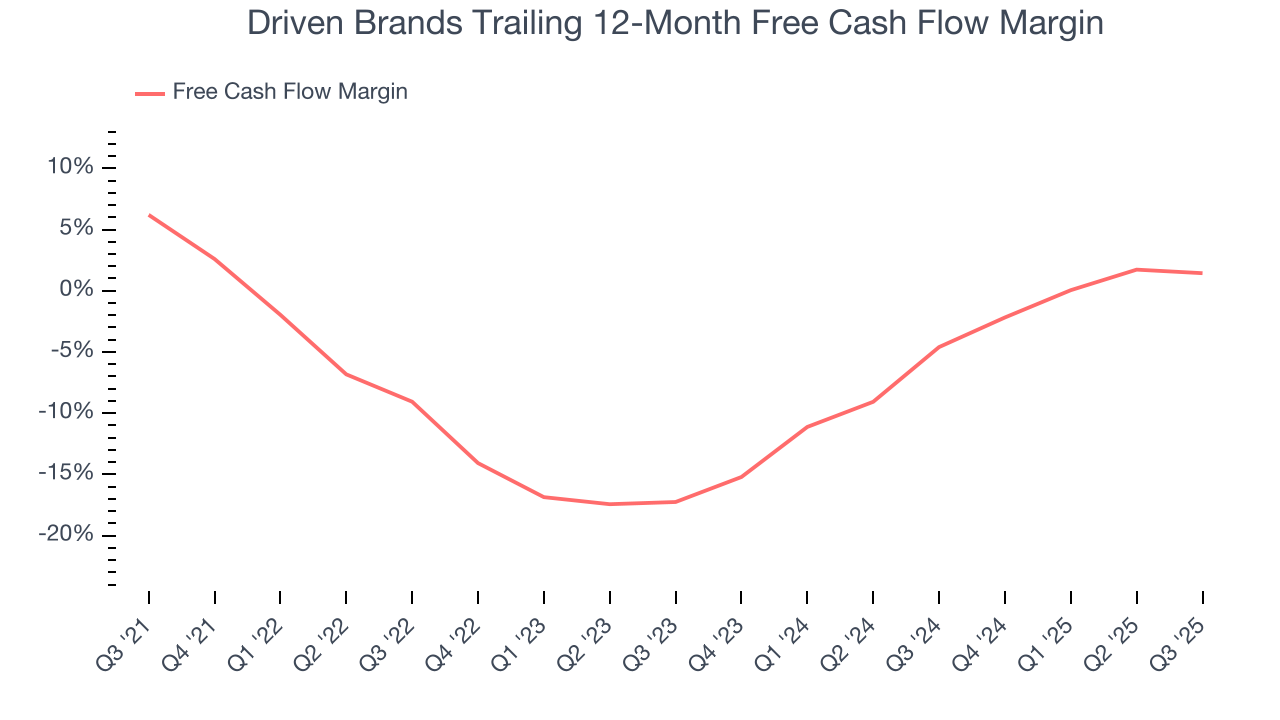
Driven Brands’s free cash flow clocked in at $30.64 million in Q3, equivalent to a 5.7% margin. This cash profitability was in line with the comparable period last year and above its five-year average.
9. Return on Invested Capital (ROIC)
EPS and free cash flow tell us whether a company was profitable while growing its revenue. But was it capital-efficient? Enter ROIC, a metric showing how much operating profit a company generates relative to the money it has raised (debt and equity).
Driven Brands’s five-year average ROIC was negative 2.6%, meaning management lost money while trying to expand the business. Its returns were among the worst in the business services sector.
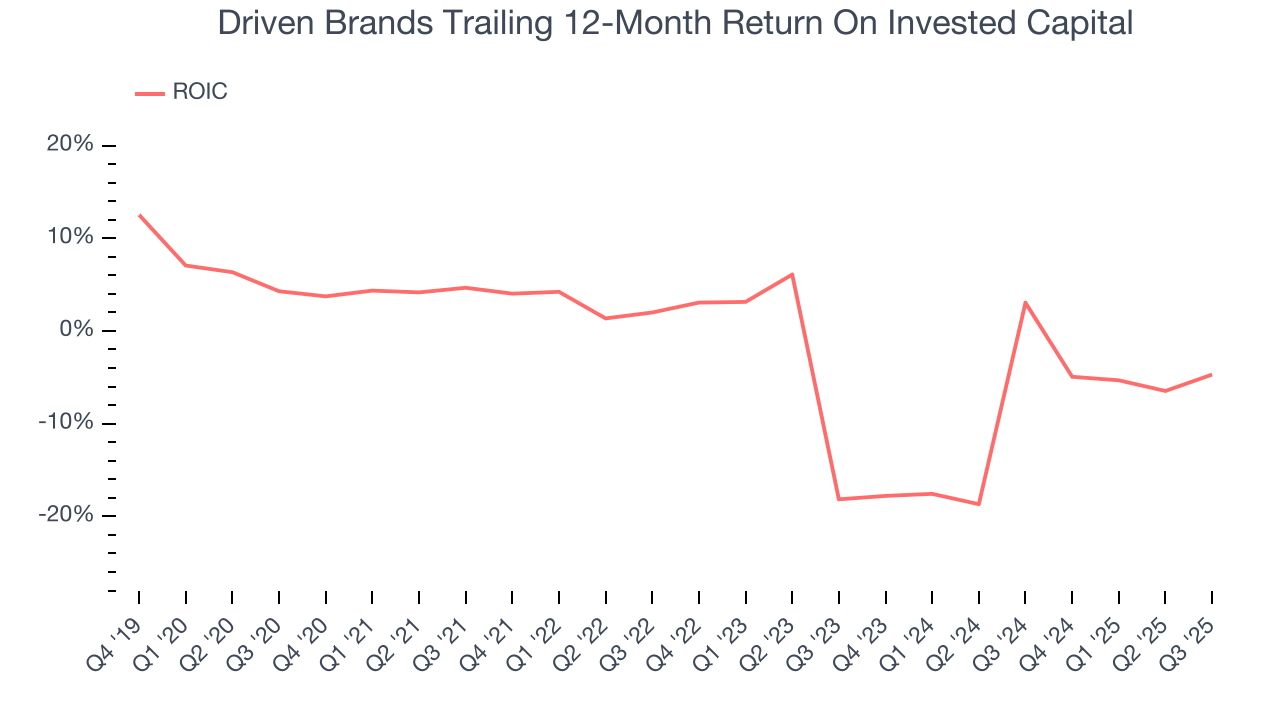
We like to invest in businesses with high returns, but the trend in a company’s ROIC is what often surprises the market and moves the stock price. Unfortunately, Driven Brands’s ROIC averaged 4.2 percentage point decreases over the last few years. Paired with its already low returns, these declines suggest its profitable growth opportunities are few and far between.
10. Balance Sheet Assessment
Driven Brands reported $162.4 million of cash and $2.76 billion of debt on its balance sheet in the most recent quarter. As investors in high-quality companies, we primarily focus on two things: 1) that a company’s debt level isn’t too high and 2) that its interest payments are not excessively burdening the business.
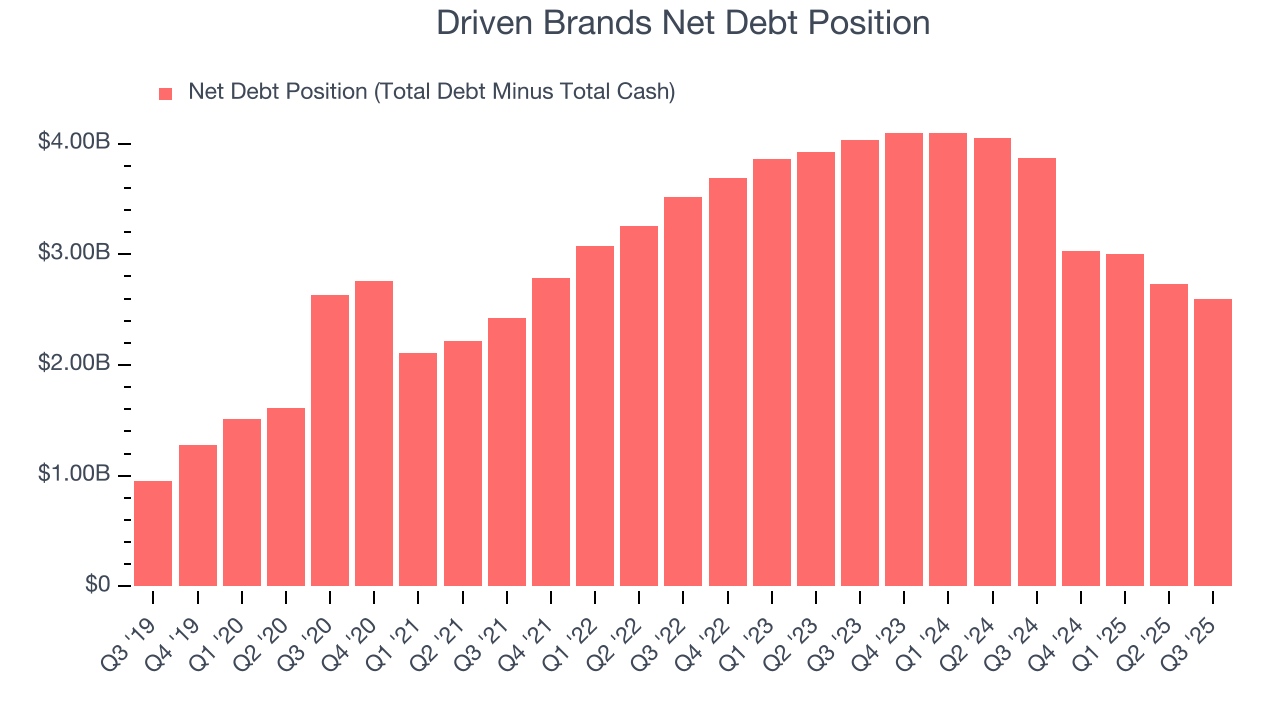
With $535.3 million of EBITDA over the last 12 months, we view Driven Brands’s 4.8× net-debt-to-EBITDA ratio as safe. We also see its $82.01 million of annual interest expenses as appropriate. The company’s profits give it plenty of breathing room, allowing it to continue investing in growth initiatives.
11. Key Takeaways from Driven Brands’s Q3 Results
It was good to see Driven Brands beat analysts’ EPS expectations this quarter. We were also glad its full-year EPS guidance outperformed Wall Street’s estimates. On the other hand, its full-year revenue guidance slightly missed and its revenue was in line with Wall Street’s estimates. Overall, we think this was still a solid quarter with some key areas of upside. The stock remained flat at $14.25 immediately after reporting.
12. Is Now The Time To Buy Driven Brands?
Updated: March 16, 2026 at 11:59 PM EDT
A common mistake we notice when investors are deciding whether to buy a stock or not is that they simply look at the latest earnings results. Business quality and valuation matter more, so we urge you to understand these dynamics as well.
Driven Brands’s business quality ultimately falls short of our standards. Although its revenue growth was exceptional over the last five years, it’s expected to deteriorate over the next 12 months and its relatively low ROIC suggests management has struggled to find compelling investment opportunities. And while the company’s astounding EPS growth over the last four years shows its profits are trickling down to shareholders, the downside is its projected EPS for the next year is lacking.
Driven Brands’s P/E ratio based on the next 12 months is 8.3x. While this valuation is optically cheap, the potential downside is big given its shaky fundamentals. We're fairly confident there are better investments elsewhere.
Wall Street analysts have a consensus one-year price target of $18.81 on the company (compared to the current share price of $10.44).
Although the price target is bullish, readers should exercise caution because analysts tend to be overly optimistic. The firms they work for, often big banks, have relationships with companies that extend into fundraising, M&A advisory, and other rewarding business lines. As a result, they typically hesitate to say bad things for fear they will lose out. We at StockStory do not suffer from such conflicts of interest, so we’ll always tell it like it is.