National Vision (EYE)
We’re wary of National Vision. Not only are its sales cratering but also its low returns on capital suggest it struggles to generate profits.― StockStory Analyst Team
1. News


2. Summary
Why We Think National Vision Will Underperform
Operating under multiple brands, National Vision (NYSE:EYE) sells optical products such as eyeglasses and provides optical services such as eye exams.
- Underwhelming 2.5% return on capital reflects management’s difficulties in finding profitable growth opportunities, and its falling returns suggest its earlier profit pools are drying up
- Store closures are a headwind for growth and suggest it’s rightsizing operations to optimize sales at existing locations
- A silver lining is that its collection of products is difficult to replicate at scale and leads to a best-in-class gross margin of 58.4%


National Vision doesn’t fulfill our quality requirements. There are better opportunities in the market.
Why There Are Better Opportunities Than National Vision

National Vision’s stock price of $26.28 implies a valuation ratio of 26.1x forward P/E. This multiple is quite expensive for the quality you get.
We’d rather pay up for companies with elite fundamentals than get a decent price on a poor one. High-quality businesses often have more durable earnings power, helping us sleep well at night.
3. National Vision (EYE) Research Report: Q4 CY2025 Update
Optical retailer National Vision (NYSE:EYE) reported Q4 CY2025 results topping the market’s revenue expectations, with sales up 15.1% year on year to $503.4 million. On the other hand, the company’s full-year revenue guidance of $2.06 billion at the midpoint came in 0.8% below analysts’ estimates. Its non-GAAP profit of $0.15 per share was significantly above analysts’ consensus estimates.
National Vision (EYE) Q4 CY2025 Highlights:
- Revenue: $503.4 million vs analyst estimates of $495.9 million (15.1% year-on-year growth, 1.5% beat)
- Adjusted EPS: $0.15 vs analyst estimates of $0.06 (significant beat)
- Adjusted EBITDA: $40.88 million vs analyst estimates of $35.32 million (8.1% margin, 15.7% beat)
- Adjusted EPS guidance for the upcoming financial year 2026 is $0.97 at the midpoint, beating analyst estimates by 4.4%
- Operating Margin: 1.3%, up from -5.8% in the same quarter last year
- Free Cash Flow was -$11.24 million compared to -$1.74 million in the same quarter last year
- Locations: 1,250 at quarter end, up from 1,240 in the same quarter last year
- Same-Store Sales rose 6.6% year on year (1.5% in the same quarter last year)
- Market Capitalization: $2.11 billion
Company Overview
Operating under multiple brands, National Vision (NYSE:EYE) sells optical products such as eyeglasses and provides optical services such as eye exams.
These brands are America's Best Contacts & Eyeglasses, Eyeglass World, and Vista Optical. There are minor differences between these brands but in general, all three sell eyeglasses, contact lenses, and sunglasses as well as offering eye exams. All three brands also focus on offering affordable options for a product category that can be costly, especially for customers without vision insurance.
National Vision’s core customer base includes value-conscious consumers who want solid-quality vision products and services without breaking the bank. These customers tend to care less about luxury brands and the latest trends, instead prioritizing affordability and convenience.
The average National Vision store is around 3,000 square feet and is typically located in strip malls and shopping centers. Many are located within Walmart supercenters or large supermarket chains. National Vision benefits from the foot traffic drawn by Walmart or Fred Meyer, and those large retailers receive some economic benefits from these arrangements and can offer their own customers a true one-stop shop with services like vision and photo as well as products like gas and petrol.
4. Specialty Retail
Some retailers try to sell everything under the sun, while others—appropriately called Specialty Retailers—focus on selling a narrow category and aiming to be exceptional at it. Whether it’s eyeglasses, sporting goods, or beauty and cosmetics, these stores win with depth of product in their category as well as in-store expertise and guidance for shoppers who need it. E-commerce competition exists and waning retail foot traffic impacts these retailers, but the magnitude of the headwinds depends on what they sell and what extra value they provide in their stores.
Competitors offering vision products and services include EssilorLuxottica (ENXTPA:EL) and Warby Parker (NYSE:WRBY). Private companies include Zenni Optical and MyEyeDr.
5. Revenue Growth
Reviewing a company’s long-term sales performance reveals insights into its quality. Even a bad business can shine for one or two quarters, but a top-tier one grows for years.
With $1.99 billion in revenue over the past 12 months, National Vision is a small retailer, which sometimes brings disadvantages compared to larger competitors benefiting from economies of scale and negotiating leverage with suppliers.
As you can see below, National Vision struggled to increase demand as its $1.99 billion of sales for the trailing 12 months was close to its revenue three years ago. This was mainly because it closed stores.
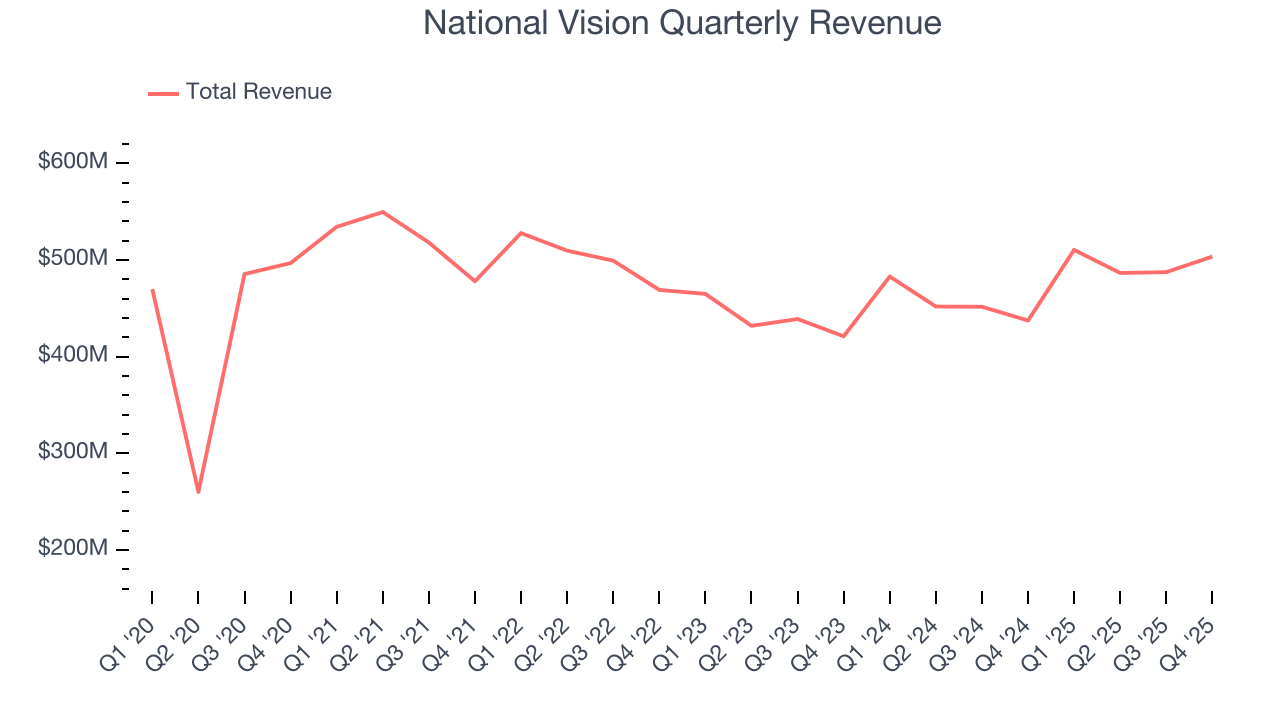
This quarter, National Vision reported year-on-year revenue growth of 15.1%, and its $503.4 million of revenue exceeded Wall Street’s estimates by 1.5%.
Looking ahead, sell-side analysts expect revenue to grow 4.5% over the next 12 months, an acceleration versus the last three years. This projection is admirable and implies its newer products will catalyze better top-line performance.
6. Store Performance
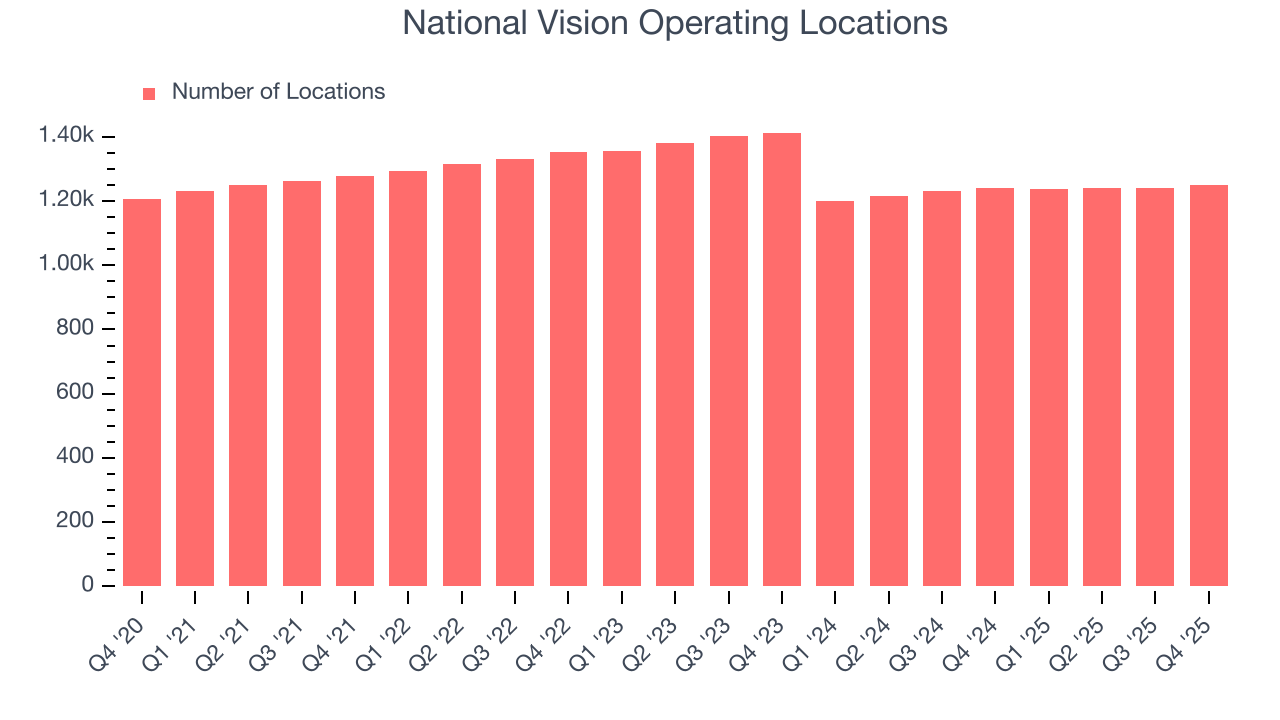
Number of Stores
A retailer’s store count often determines how much revenue it can generate.
National Vision listed 1,250 locations in the latest quarter and has generally closed its stores over the last two years, averaging 5.2% annual declines.
When a retailer shutters stores, it usually means that brick-and-mortar demand is less than supply, and it is responding by closing underperforming locations to improve profitability.
Same-Store Sales
A company's store base only paints one part of the picture. When demand is high, it makes sense to open more. But when demand is low, it’s prudent to close some locations and use the money in other ways. Same-store sales provides a deeper understanding of this issue because it measures organic growth at brick-and-mortar shops for at least a year.
National Vision’s demand has been spectacular for a retailer over the last two years. On average, the company has increased its same-store sales by an impressive 3.9% per year. Given its declining store base over the same period, this performance stems from a mixture of higher e-commerce sales and increased foot traffic at existing locations (closing stores can sometimes boost same-store sales).
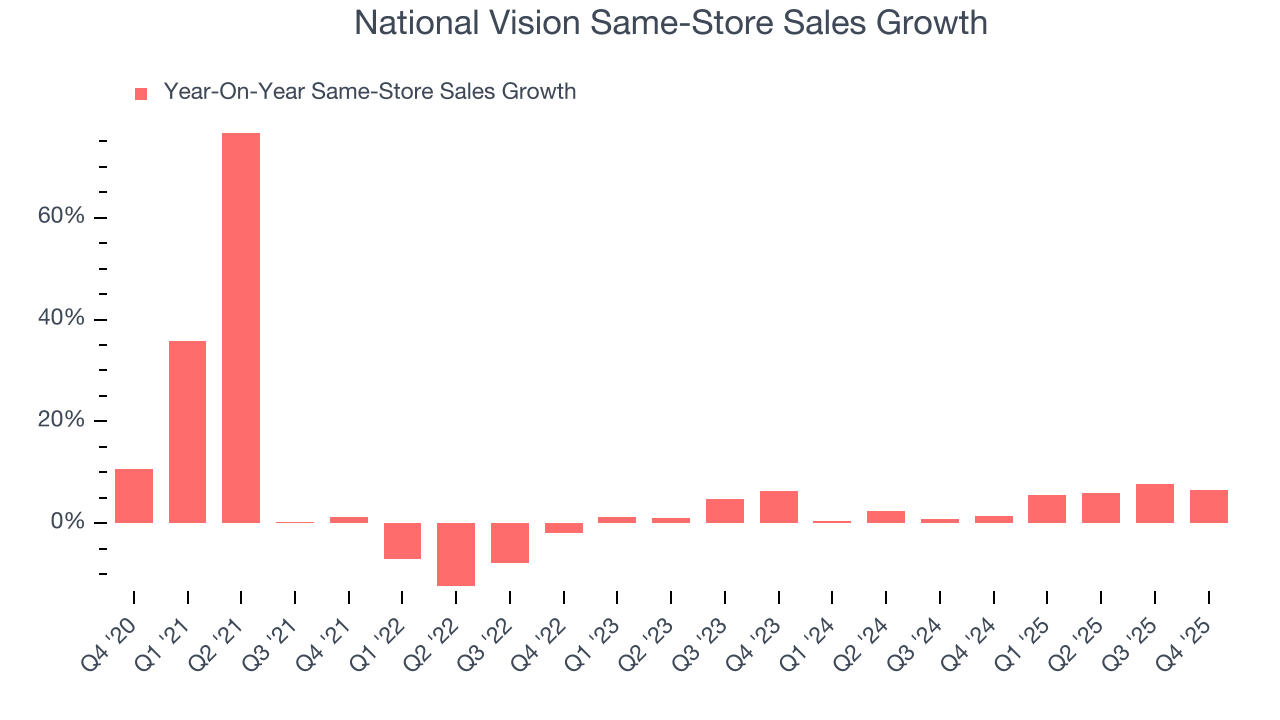
In the latest quarter, National Vision’s same-store sales rose 6.6% year on year. This growth was an acceleration from its historical levels, which is always an encouraging sign.
7. Gross Margin & Pricing Power
Gross profit margins are an important measure of a retailer’s pricing power, product differentiation, and negotiating leverage.
National Vision has best-in-class unit economics for a retailer, enabling it to invest in areas such as marketing and talent to grow its brand. As you can see below, it averaged an elite 58.4% gross margin over the last two years. That means National Vision only paid its suppliers $41.55 for every $100 in revenue. 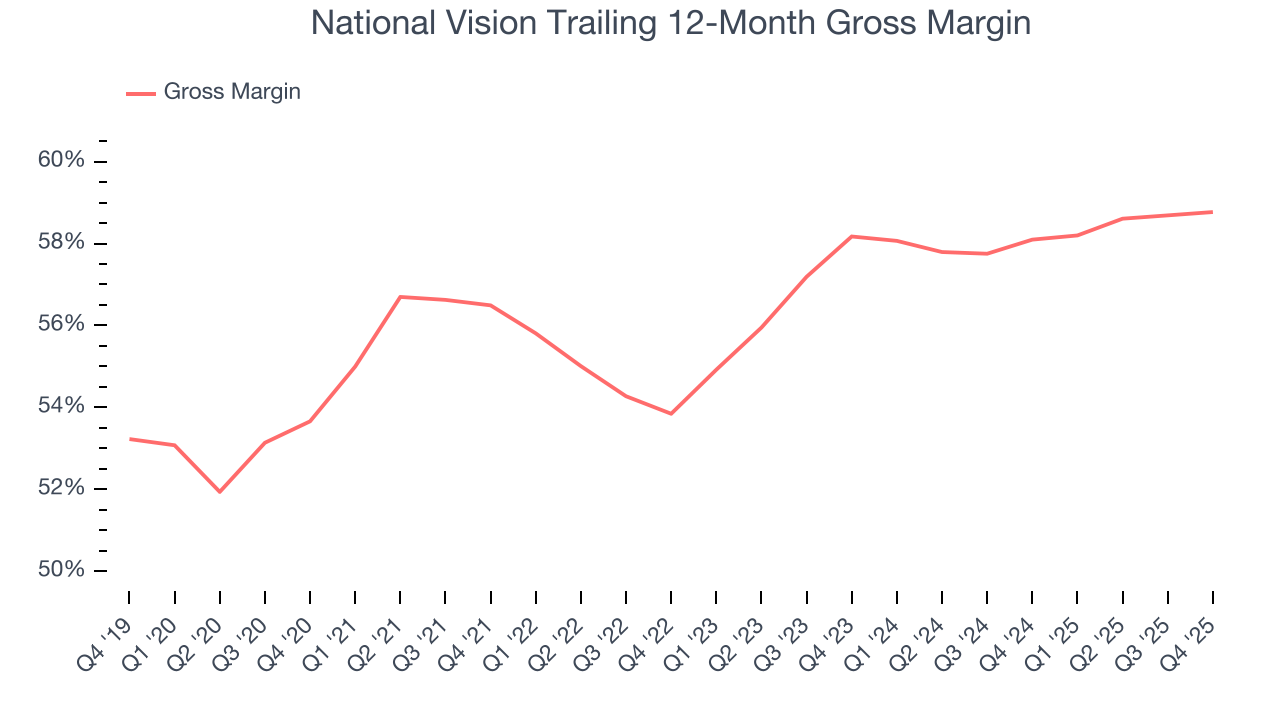
This quarter, National Vision’s gross profit margin was 58.1%, in line with the same quarter last year. Zooming out, the company’s full-year margin has remained steady over the past 12 months, suggesting it strives to keep prices low for customers and has stable input costs (such as labor and freight expenses to transport goods).
8. Operating Margin
National Vision was profitable over the last two years but held back by its large cost base. Its average operating margin of 1.3% was weak for a consumer retail business. This result is surprising given its high gross margin as a starting point.
On the plus side, National Vision’s operating margin rose by 3.5 percentage points over the last year.
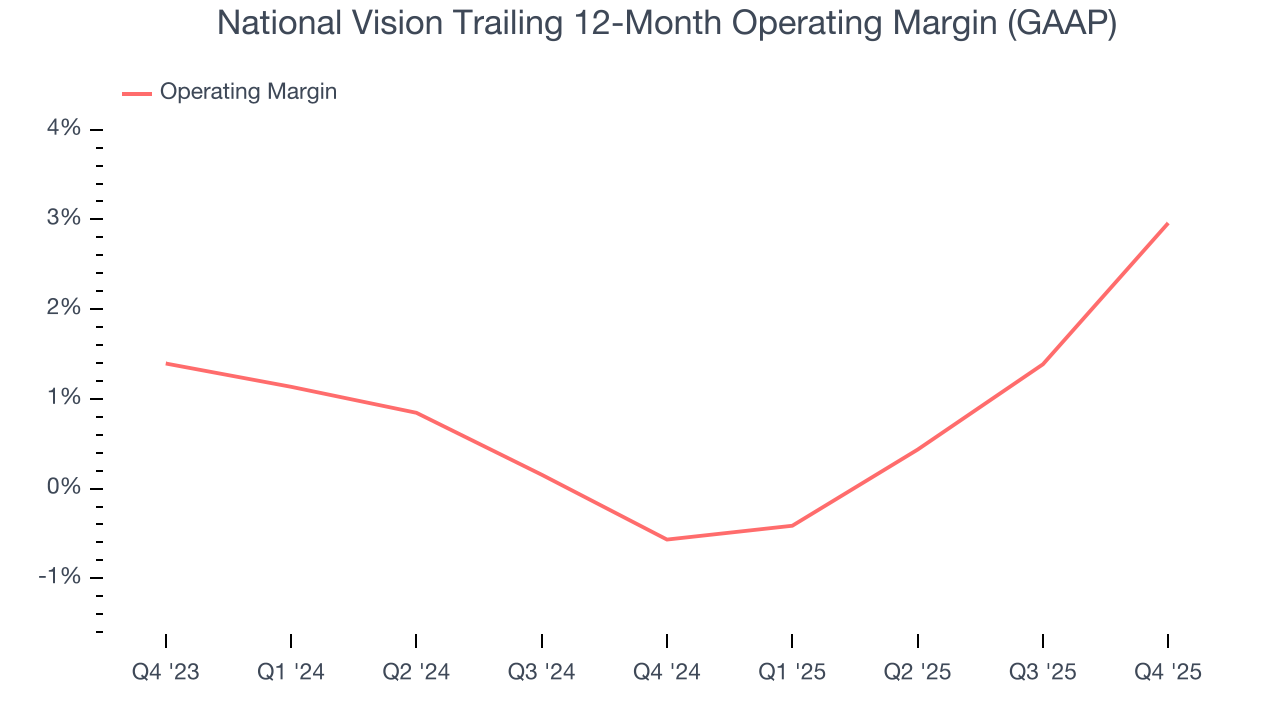
In Q4, National Vision generated an operating margin profit margin of 1.3%, up 7.2 percentage points year on year. The increase was solid, and because its operating margin rose more than its gross margin, we can infer it was more efficient with expenses such as marketing, and administrative overhead.
9. Earnings Per Share
We track the long-term change in earnings per share (EPS) for the same reason as long-term revenue growth. Compared to revenue, however, EPS highlights whether a company’s growth is profitable.
National Vision’s EPS grew at 9.5% compounded annual growth rate over the last three years. On the bright side, this performance was better than its flat revenue and tells us management responded to softer demand by adapting its cost structure.
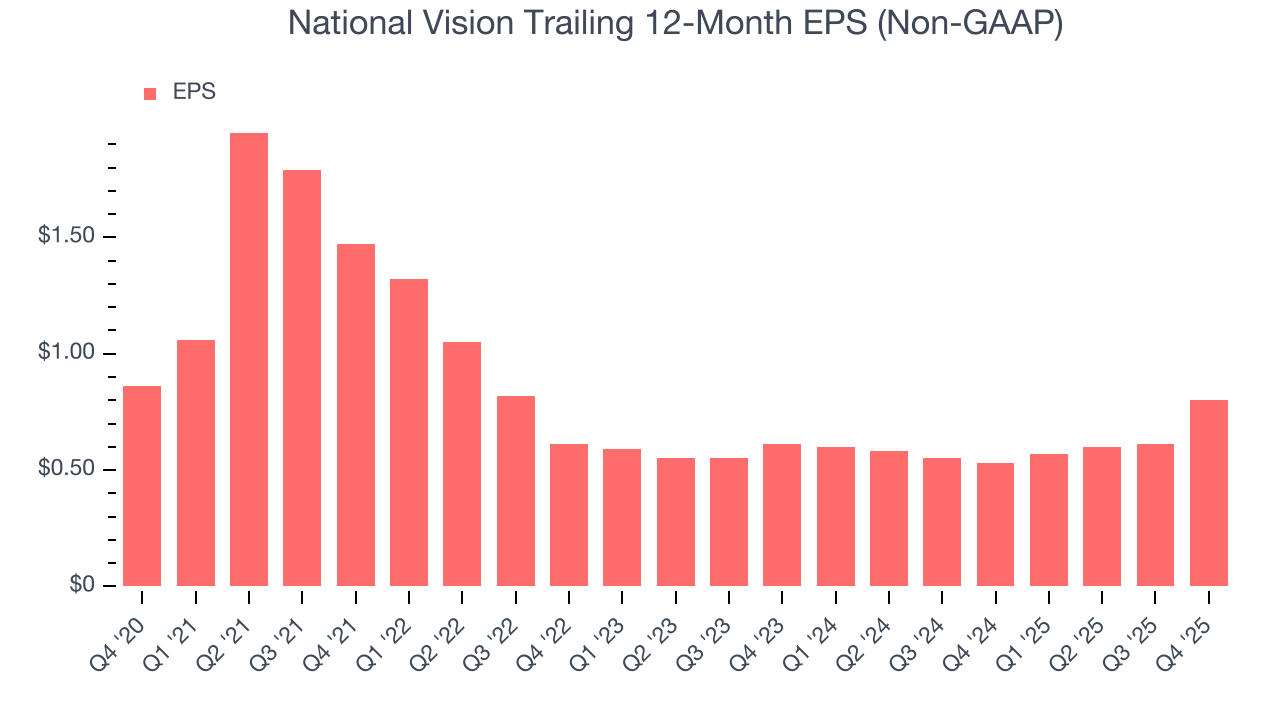
In Q4, National Vision reported adjusted EPS of $0.15, up from negative $0.04 in the same quarter last year. This print easily cleared analysts’ estimates, and shareholders should be content with the results. Over the next 12 months, Wall Street expects National Vision’s full-year EPS of $0.80 to grow 18.3%.
10. Cash Is King
Free cash flow isn't a prominently featured metric in company financials and earnings releases, but we think it's telling because it accounts for all operating and capital expenses, making it tough to manipulate. Cash is king.
National Vision has shown decent cash profitability, giving it some flexibility to reinvest or return capital to investors. The company’s free cash flow margin averaged 2.9% over the last two years, slightly better than the broader consumer retail sector. National Vision has shown decent cash profitability relative to peers over the last two years, giving the company fewer opportunities to return capital to shareholders.
Taking a step back, we can see that National Vision’s margin expanded by 1.6 percentage points over the last year. This is encouraging because it gives the company more optionality.
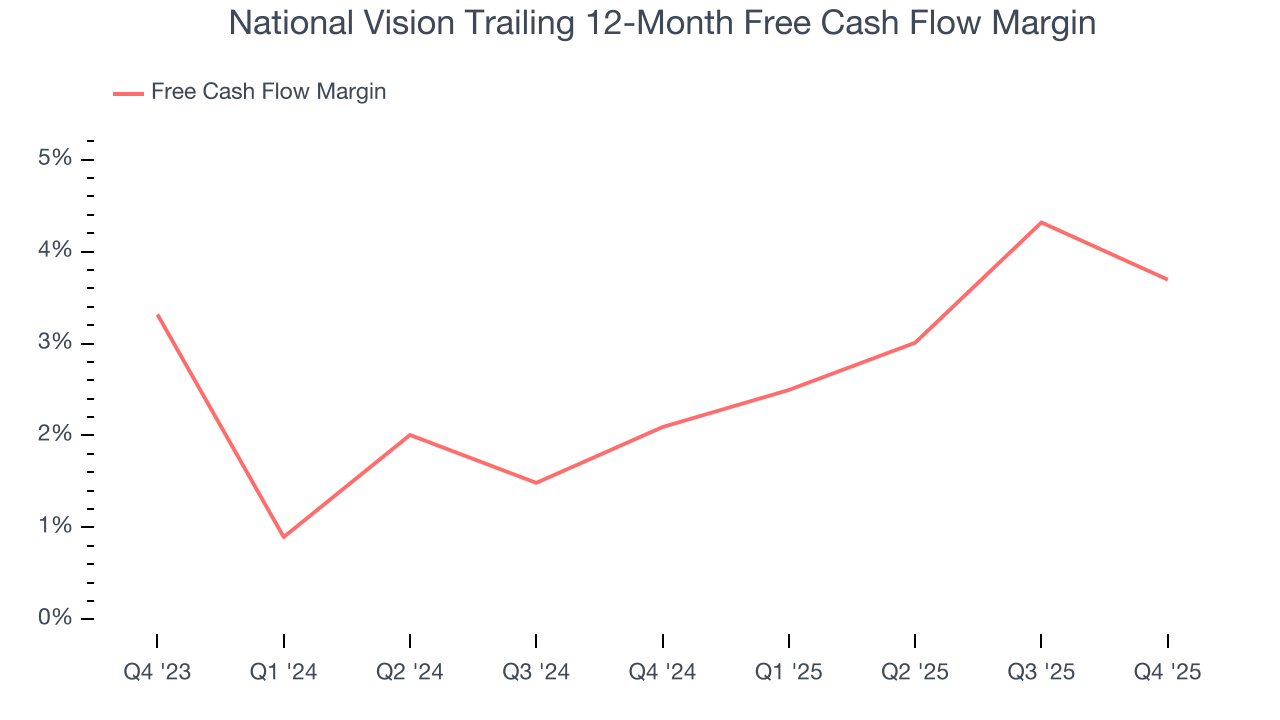
National Vision burned through $11.24 million of cash in Q4, equivalent to a negative 2.2% margin. The company’s cash burn was similar to its $1.74 million of lost cash in the same quarter last year. These numbers deviate from its longer-term margin, indicating it is a seasonal business that must build up inventory during certain quarters.
11. Return on Invested Capital (ROIC)
EPS and free cash flow tell us whether a company was profitable while growing its revenue. But was it capital-efficient? Enter ROIC, a metric showing how much operating profit a company generates relative to the money it has raised (debt and equity).
National Vision historically did a mediocre job investing in profitable growth initiatives. Its five-year average ROIC was 2.6%, lower than the typical cost of capital (how much it costs to raise money) for consumer retail companies.
12. Balance Sheet Assessment
National Vision reported $38.71 million of cash and $694.6 million of debt on its balance sheet in the most recent quarter. As investors in high-quality companies, we primarily focus on two things: 1) that a company’s debt level isn’t too high and 2) that its interest payments are not excessively burdening the business.
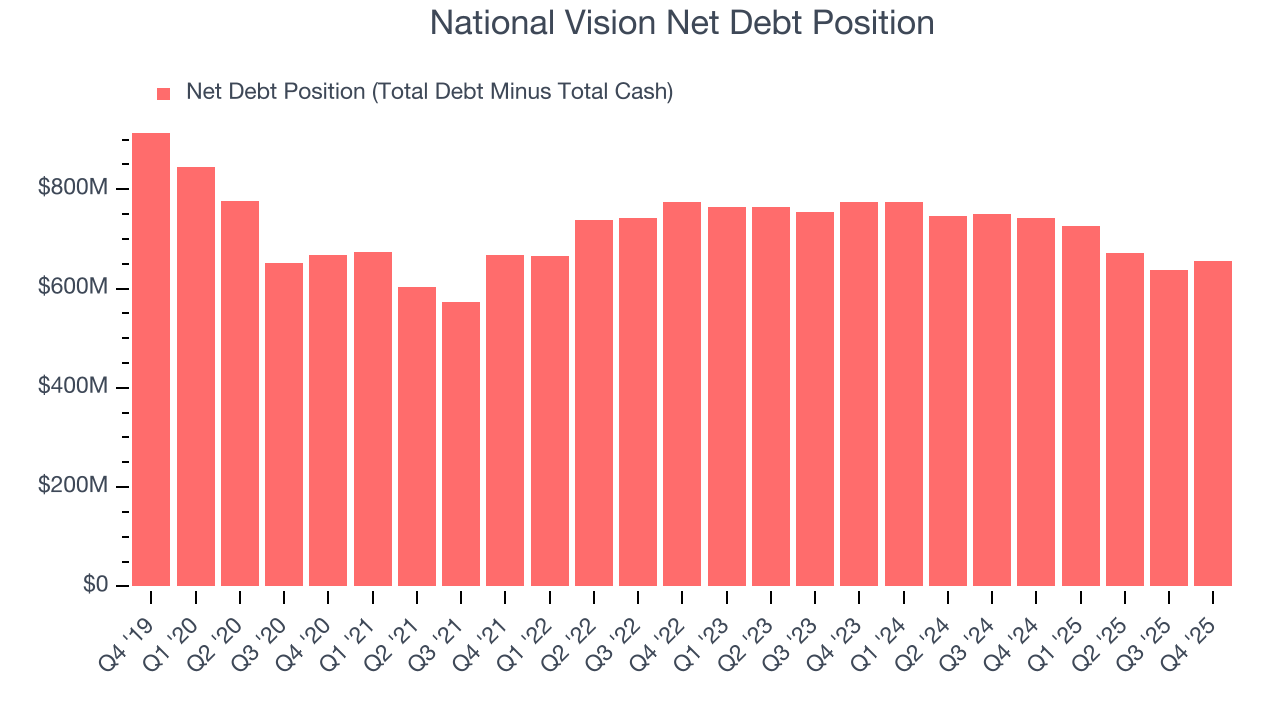
With $192.9 million of EBITDA over the last 12 months, we view National Vision’s 3.4× net-debt-to-EBITDA ratio as safe. We also see its $8.65 million of annual interest expenses as appropriate. The company’s profits give it plenty of breathing room, allowing it to continue investing in growth initiatives.
13. Key Takeaways from National Vision’s Q4 Results
It was good to see National Vision beat analysts’ EPS expectations this quarter. We were also excited its EBITDA outperformed Wall Street’s estimates by a wide margin. On the other hand, its full-year revenue guidance slightly missed. Zooming out, we think this quarter featured some important positives. The stock remained flat at $26.63 immediately following the results.
14. Is Now The Time To Buy National Vision?
Updated: March 15, 2026 at 10:49 PM EDT
Before investing in or passing on National Vision, we urge you to understand the company’s business quality (or lack thereof), valuation, and the latest quarterly results - in that order.
National Vision isn’t a terrible business, but it doesn’t pass our bar. First off, its revenue has declined over the last three years. While its admirable gross margins are a wonderful starting point for the overall profitability of the business, the downside is its relatively low ROIC suggests management has struggled to find compelling investment opportunities. On top of that, its declining physical locations suggests its demand is falling.
National Vision’s P/E ratio based on the next 12 months is 26.1x. At this valuation, there’s a lot of good news priced in - we think there are better opportunities elsewhere.
Wall Street analysts have a consensus one-year price target of $35.27 on the company (compared to the current share price of $26.28).
Although the price target is bullish, readers should exercise caution because analysts tend to be overly optimistic. The firms they work for, often big banks, have relationships with companies that extend into fundraising, M&A advisory, and other rewarding business lines. As a result, they typically hesitate to say bad things for fear they will lose out. We at StockStory do not suffer from such conflicts of interest, so we’ll always tell it like it is.