Leslie's (LESL)
Leslie's is up against the odds. Its low returns on capital and plummeting sales suggest it struggles to generate demand and profits, a red flag.― StockStory Analyst Team
1. News


2. Summary
Why We Think Leslie's Will Underperform
Named after founder Philip Leslie, who established the company in 1963, Leslie’s (NASDAQ:LESL) is a retailer that sells pool and spa supplies, equipment, and maintenance services.
- Annual sales declines of 8.3% for the past three years show its products struggled to connect with the market
- Operating margin has declined over the last year, and when paired with its track record of losses, suggests intense competition and a suboptimal cost structure
- High net-debt-to-EBITDA ratio of 20× increases the risk of forced asset sales or dilutive financing if operational performance weakens


Leslie's is in the doghouse. More profitable opportunities exist elsewhere.
Why There Are Better Opportunities Than Leslie's


Leslie's is trading at $1.15 per share, or 18.4x forward EV-to-EBITDA. This multiple rich for the business quality. Not a great combination.
Paying a premium for high-quality companies with strong long-term earnings potential is preferable to owning challenged businesses with questionable prospects. That helps the prudent investor sleep well at night.
3. Leslie's (LESL) Research Report: Q4 CY2025 Update
Pool products retailer Leslie’s (NASDAQ:LESL) missed Wall Street’s revenue expectations in Q4 CY2025, with sales falling 16% year on year to $147.1 million. The company’s full-year revenue guidance of $1.18 billion at the midpoint came in 1.2% below analysts’ estimates. Its non-GAAP loss of $5.24 per share was 23.7% below analysts’ consensus estimates.
Leslie's (LESL) Q4 CY2025 Highlights:
- Revenue: $147.1 million vs analyst estimates of $158 million (16% year-on-year decline, 6.9% miss)
- Adjusted EPS: -$5.24 vs analyst expectations of -$4.24 (23.7% miss)
- Adjusted EBITDA: -$40.29 million (-27.4% margin, 37.4% year-on-year decline)
- The company reconfirmed its revenue guidance for the full year of $1.18 billion at the midpoint
- EBITDA guidance for the full year is $65 million at the midpoint, below analyst estimates of $66.48 million
- Operating Margin: -46.7%, down from -22.7% in the same quarter last year
- Free Cash Flow was -$85.46 million compared to -$109.8 million in the same quarter last year
- Locations: 950 at quarter end, down from 1,021 in the same quarter last year
- Same-Store Sales fell 15.5% year on year (0.2% in the same quarter last year)
- Market Capitalization: $11.18 million
Company Overview
Named after founder Philip Leslie, who established the company in 1963, Leslie’s (NASDAQ:LESL) is a retailer that sells pool and spa supplies, equipment, and maintenance services.
The core customer is therefore a homeowner or commercial property manager who must maintain pools and hot tubs. This customer can count on Leslie’s for products such as pool chemicals, cleaning tools, and accessories such as lights, ladders, and covers. In addition to products, Leslie’s offers professional services such as equipment installation and water testing.
Overall, pools take consistent care to properly maintain, and overlooking or greatly delaying maintenance can lead to an unusable pool (green water, ew!) or much more expensive problems down the line. A number of products sold can therefore border on non-discretionary for a homeowner with a pool. Leslie’s is a one-stop shop for these maintenance and minor repair needs.
Leslie's stores typically range in size from 5,000 to 10,000 square feet. They are positioned in suburban areas with high household incomes and high residential density to increase the odds of nearby pools. In addition to the physical store footprint, Leslie’s has an e-commerce platform where customers can buy products for home delivery or store pickup as well as schedule service appointments.
4. Specialty Retail
Some retailers try to sell everything under the sun, while others—appropriately called Specialty Retailers—focus on selling a narrow category and aiming to be exceptional at it. Whether it’s eyeglasses, sporting goods, or beauty and cosmetics, these stores win with depth of product in their category as well as in-store expertise and guidance for shoppers who need it. E-commerce competition exists and waning retail foot traffic impacts these retailers, but the magnitude of the headwinds depends on what they sell and what extra value they provide in their stores.
Competitors that sell pool and spa supplies include Pool Corporation (NASDAQ:POOL) and Hayward Holdings (NYSE:HAYW), although these companies sell more to professionals than DIY homeowners.
5. Revenue Growth
A company’s long-term performance is an indicator of its overall quality. Any business can experience short-term success, but top-performing ones enjoy sustained growth for years.
With $1.21 billion in revenue over the past 12 months, Leslie's is a small retailer, which sometimes brings disadvantages compared to larger competitors benefiting from economies of scale and negotiating leverage with suppliers.
As you can see below, Leslie's struggled to generate demand over the last three years. Its sales dropped by 8.3% annually as it didn’t open many new stores and observed lower sales at existing, established locations.
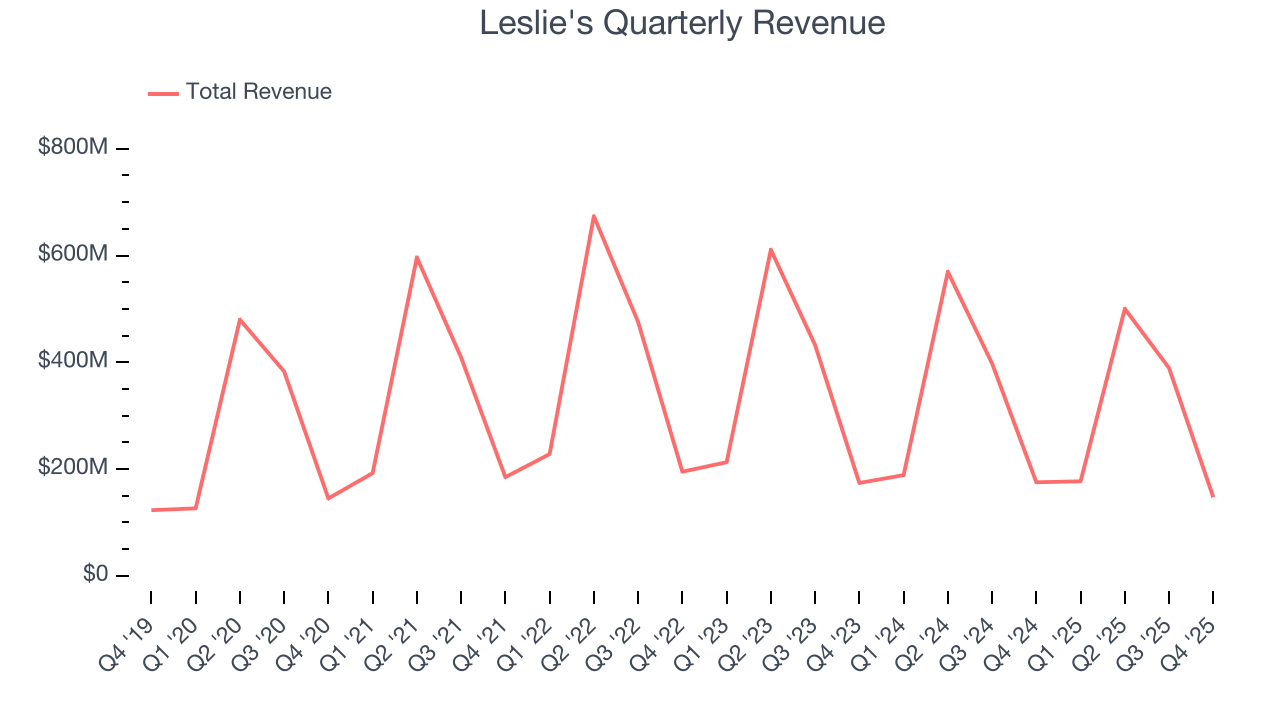
This quarter, Leslie's missed Wall Street’s estimates and reported a rather uninspiring 16% year-on-year revenue decline, generating $147.1 million of revenue.
Looking ahead, sell-side analysts expect revenue to decline by 3.1% over the next 12 months. it’s tough to feel optimistic about a company facing demand difficulties.
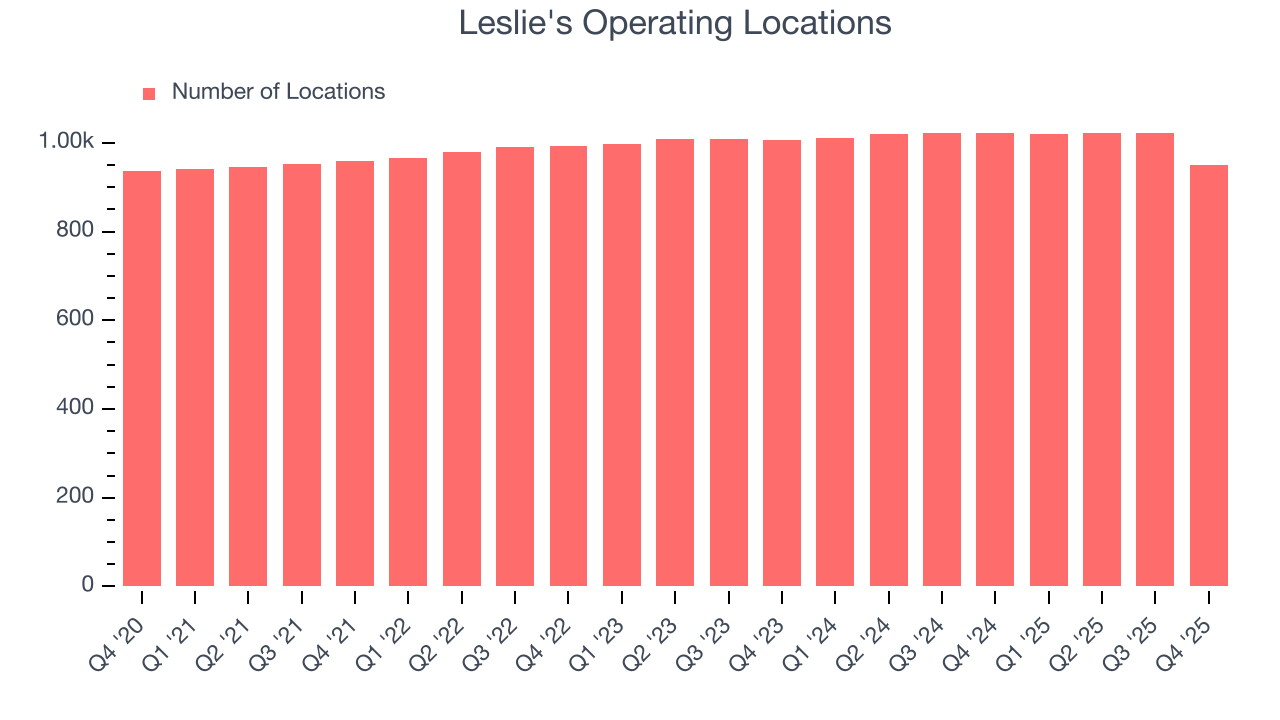
6. Store Performance
Number of Stores
The number of stores a retailer operates is a critical driver of how quickly company-level sales can grow.
Leslie's operated 950 locations in the latest quarter, and over the last two years, has kept its store count flat while other consumer retail businesses have opted for growth.
When a retailer keeps its store footprint steady, it usually means demand is stable and it’s focusing on operational efficiency to increase profitability.
Same-Store Sales
A company's store base only paints one part of the picture. When demand is high, it makes sense to open more. But when demand is low, it’s prudent to close some locations and use the money in other ways. Same-store sales is an industry measure of whether revenue is growing at those existing stores and is driven by customer visits (often called traffic) and the average spending per customer (ticket).
Leslie’s demand has been shrinking over the last two years as its same-store sales have averaged 8.4% annual declines. This performance isn’t ideal, and we’d be concerned if Leslie's starts opening new stores to artificially boost revenue growth.
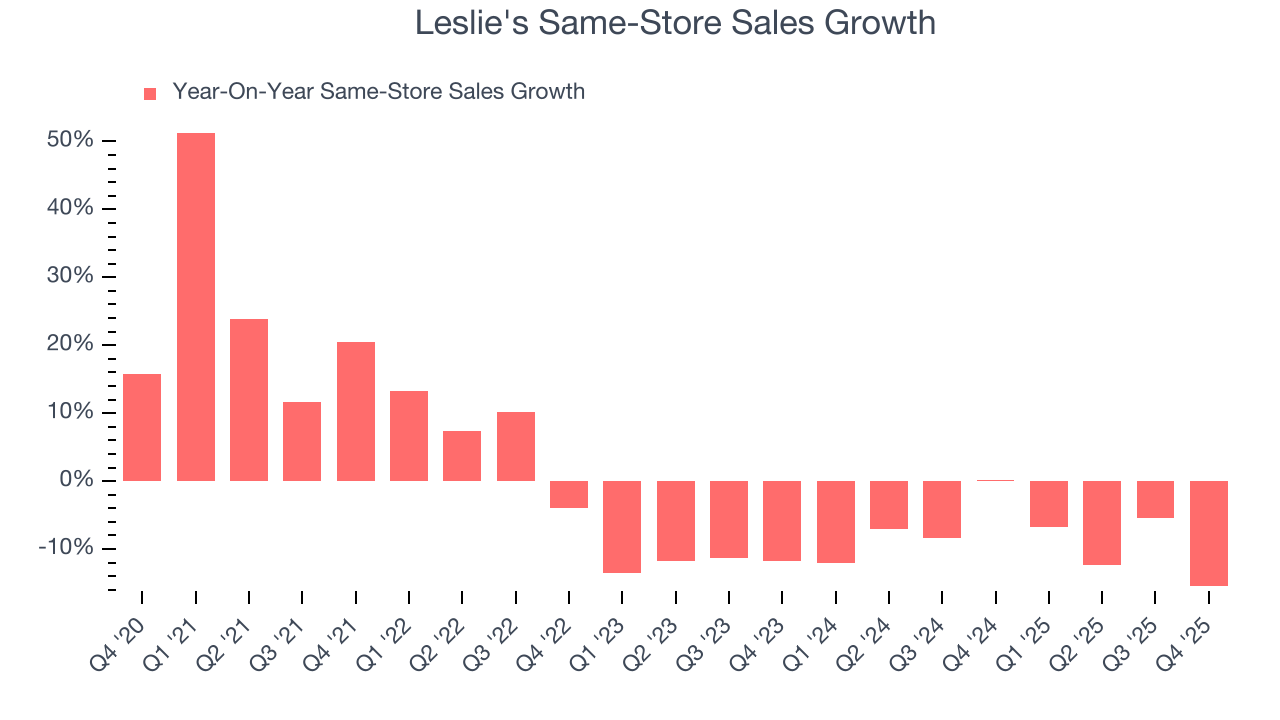
In the latest quarter, Leslie’s same-store sales fell by 15.5% year on year. This decrease represents a further deceleration from its historical levels. We hope the business can get back on track.
7. Gross Margin & Pricing Power
Leslie's has bad unit economics for a retailer, giving it less room to reinvest and grow its presence. As you can see below, it averaged a 35.1% gross margin over the last two years. Said differently, Leslie's had to pay a chunky $64.91 to its suppliers for every $100 in revenue. 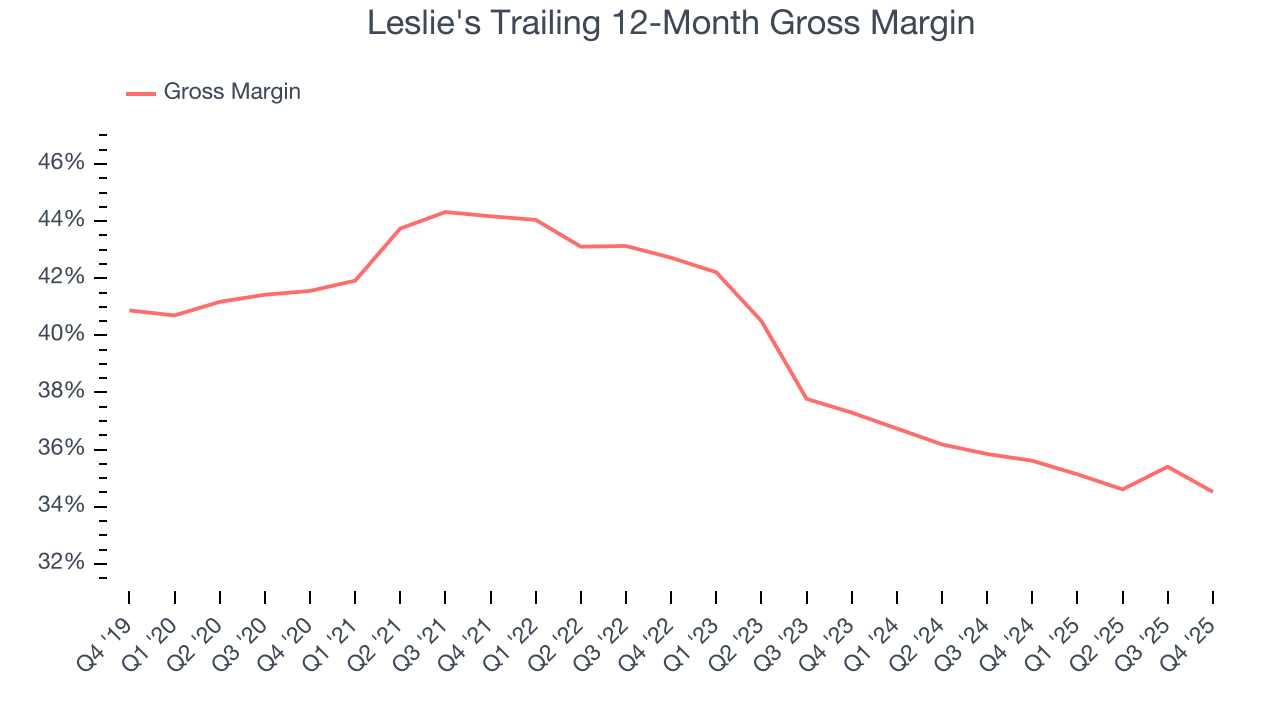
Leslie’s gross profit margin came in at 18.4% this quarter, down 8.8 percentage points year on year. Leslie’s full-year margin has also been trending down over the past 12 months, decreasing by 1.1 percentage points. If this move continues, it could suggest a more competitive environment with some pressure to discount products and higher input costs (such as labor and freight expenses to transport goods).
8. Operating Margin
Despite the consumer retail industry’s secular decline, unprofitable public companies are few and far between. Unfortunately, Leslie's was one of them over the last two years as its high expenses contributed to an average operating margin of negative 5.7%.
Analyzing the trend in its profitability, Leslie’s operating margin decreased by 20.4 percentage points over the last year. Leslie’s performance was poor no matter how you look at it - it shows that costs were rising and it couldn’t pass them onto its customers.
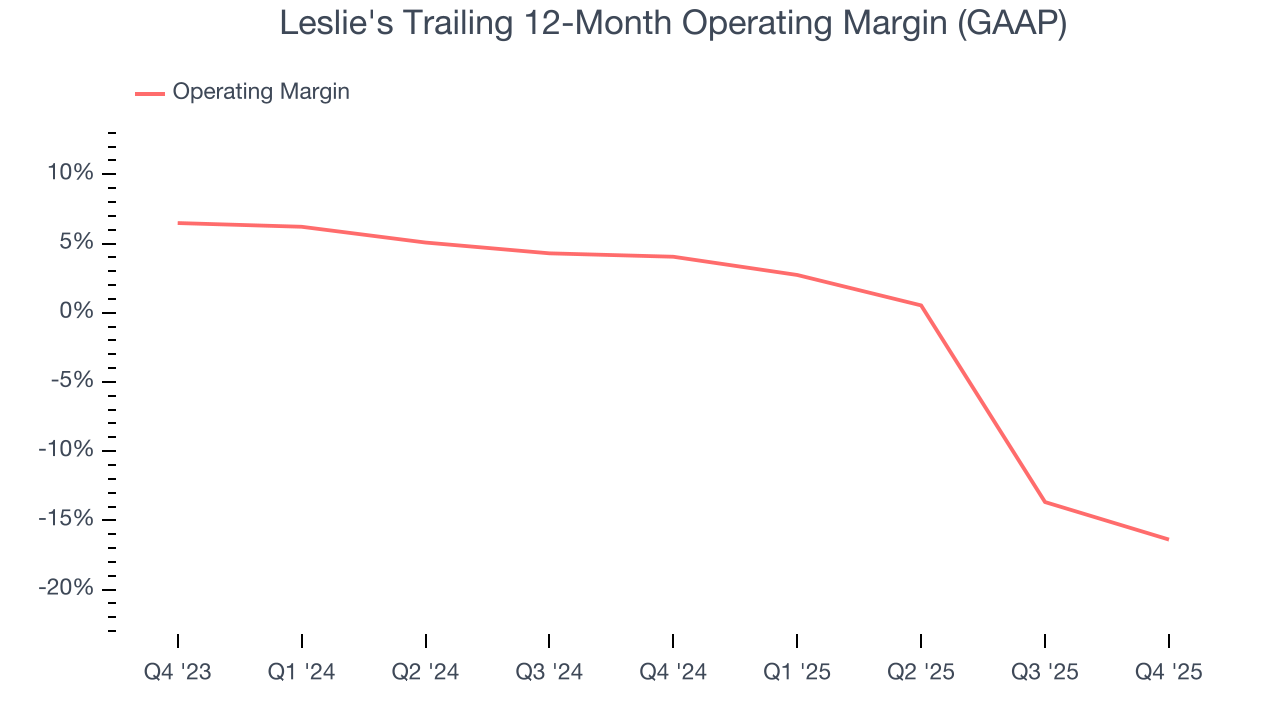
This quarter, Leslie's generated a negative 46.7% operating margin. The company's consistent lack of profits raise a flag.
9. Earnings Per Share
We track the long-term change in earnings per share (EPS) for the same reason as long-term revenue growth. Compared to revenue, however, EPS highlights whether a company’s growth is profitable.
Sadly for Leslie's, its EPS declined by 32.9% annually over the last three years, more than its revenue. This tells us the company struggled because its fixed cost base made it difficult to adjust to shrinking demand.
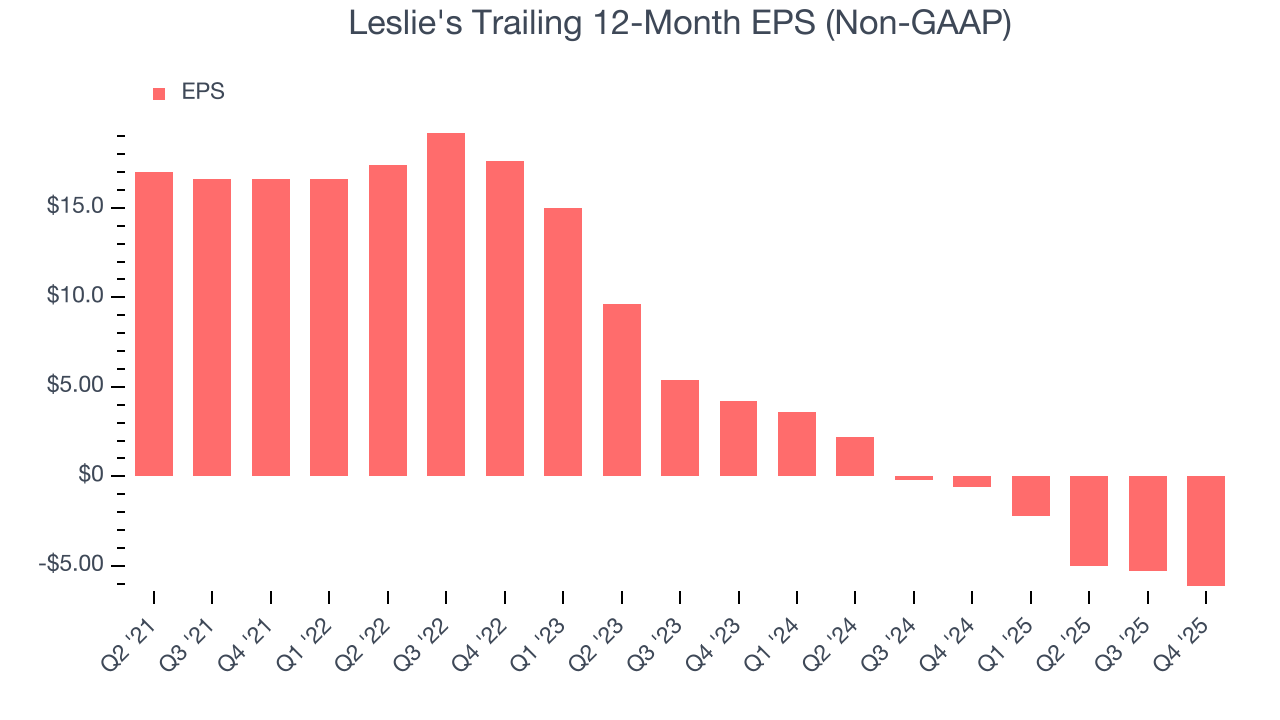
In Q4, Leslie's reported adjusted EPS of negative $5.24, down from negative $4.40 in the same quarter last year. This print missed analysts’ estimates. Over the next 12 months, Wall Street expects Leslie's to improve its earnings losses. Analysts forecast its full-year EPS of negative $6.15 will advance to negative $2.35.
10. Cash Is King
Although earnings are undoubtedly valuable for assessing company performance, we believe cash is king because you can’t use accounting profits to pay the bills.
Leslie's has shown mediocre cash profitability over the last two years, giving the company limited opportunities to return capital to shareholders. Its free cash flow margin averaged 1.6%, subpar for a consumer retail business.
Taking a step back, we can see that Leslie’s margin dropped by 1.9 percentage points over the last year. This decrease warrants extra caution because Leslie's failed to grow its same-store sales. Its cash profitability could decay further if it tries to reignite growth by opening new stores.
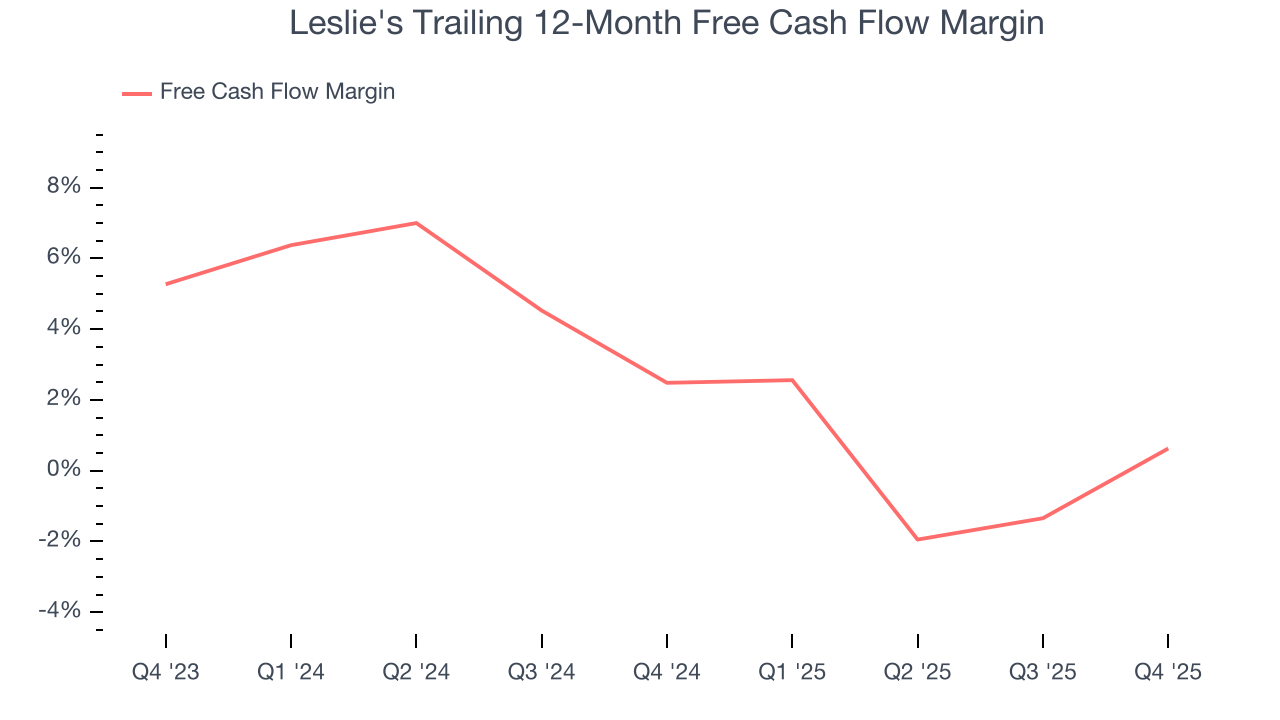
Leslie's burned through $85.46 million of cash in Q4, equivalent to a negative 58.1% margin. The company’s cash burn slowed from $109.8 million of lost cash in the same quarter last year. These numbers deviate from its longer-term margin, indicating it is a seasonal business that must build up inventory during certain quarters.
11. Return on Invested Capital (ROIC)
EPS and free cash flow tell us whether a company was profitable while growing its revenue. But was it capital-efficient? A company’s ROIC explains this by showing how much operating profit it makes compared to the money it has raised (debt and equity).
Leslie's historically did a mediocre job investing in profitable growth initiatives. Its five-year average ROIC was 8.3%, somewhat low compared to the best consumer retail companies that consistently pump out 25%+.
12. Balance Sheet Risk
As long-term investors, the risk we care about most is the permanent loss of capital, which can happen when a company goes bankrupt or raises money from a disadvantaged position. This is separate from short-term stock price volatility, something we are much less bothered by.
Leslie’s $1.02 billion of debt exceeds the $3.62 million of cash on its balance sheet. Furthermore, its 20× net-debt-to-EBITDA ratio (based on its EBITDA of $50.39 million over the last 12 months) shows the company is overleveraged.
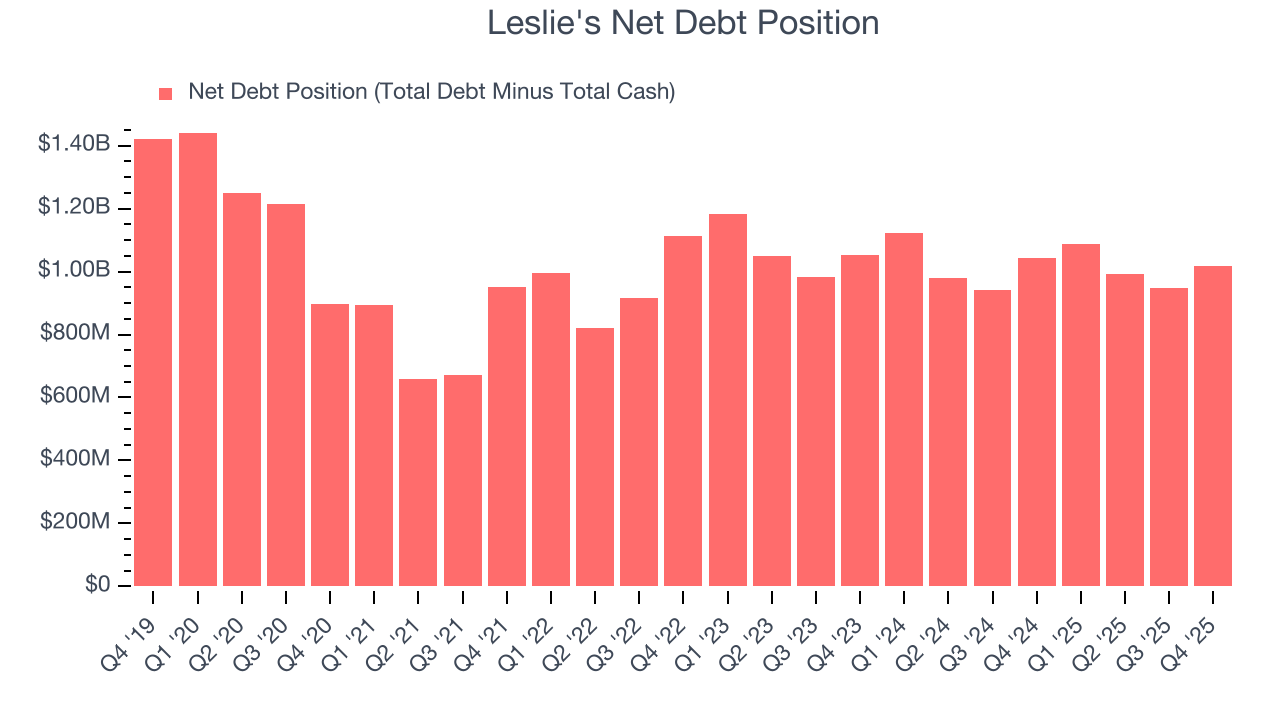
At this level of debt, incremental borrowing becomes increasingly expensive and credit agencies could downgrade the company’s rating if profitability falls. Leslie's could also be backed into a corner if the market turns unexpectedly – a situation we seek to avoid as investors in high-quality companies.
We hope Leslie's can improve its balance sheet and remain cautious until it increases its profitability or pays down its debt.
13. Key Takeaways from Leslie’s Q4 Results
We struggled to find many positives in these results. Its revenue missed and its EBITDA fell short of Wall Street’s estimates. Overall, this quarter could have been better. The stock traded up 2.4% to $1.23 immediately after reporting.
14. Is Now The Time To Buy Leslie's?
Updated: March 15, 2026 at 10:39 PM EDT
The latest quarterly earnings matters, sure, but we actually think longer-term fundamentals and valuation matter more. Investors should consider all these pieces before deciding whether or not to invest in Leslie's.
Leslie's falls short of our quality standards. First off, its revenue has declined over the last three years. While its projected EPS for the next year implies the company’s fundamentals will improve, the downside is its declining EPS over the last three years makes it a less attractive asset to the public markets. On top of that, its operating margins reveal poor profitability compared to other retailers.
Leslie’s EV-to-EBITDA ratio based on the next 12 months is 18.4x. This multiple tells us a lot of good news is priced in - we think there are better opportunities elsewhere.
Wall Street analysts have a consensus one-year price target of $4.97 on the company (compared to the current share price of $1.15).
Although the price target is bullish, readers should exercise caution because analysts tend to be overly optimistic. The firms they work for, often big banks, have relationships with companies that extend into fundraising, M&A advisory, and other rewarding business lines. As a result, they typically hesitate to say bad things for fear they will lose out. We at StockStory do not suffer from such conflicts of interest, so we’ll always tell it like it is.