Sally Beauty (SBH)
Sally Beauty faces an uphill battle. Its low returns on capital and plummeting sales suggest it struggles to generate demand and profits, a red flag.― StockStory Analyst Team
1. News


2. Summary
Why We Think Sally Beauty Will Underperform
Catering to both everyday consumers as well as salon professionals, Sally Beauty (NYSE:SBH) is a retailer that sells salon-quality beauty products such as makeup and haircare products.
- Products fail to spark excitement with consumers, as seen in its flat sales over the last three years
- Modest revenue base of $3.71 billion gives it less fixed cost leverage and fewer distribution channels than larger companies
- Failure to add new stores points to soft demand and a focus on boosting sales at current locations


Sally Beauty’s quality isn’t up to par. You should search for better opportunities.
Why There Are Better Opportunities Than Sally Beauty


At $14.54 per share, Sally Beauty trades at 6.8x forward P/E. This sure is a cheap multiple, but you get what you pay for.
Our advice is to pay up for elite businesses whose advantages are tailwinds to earnings growth. Don’t get sucked into lower-quality businesses just because they seem like bargains. These mediocre businesses often never achieve a higher multiple as hoped, a phenomenon known as a “value trap”.
3. Sally Beauty (SBH) Research Report: Q4 CY2025 Update
Beauty supply retailer Sally Beauty (NYSE:SBH) met Wall Street’s revenue expectations in Q4 CY2025, but sales were flat year on year at $943.2 million. The company expects next quarter’s revenue to be around $900 million, close to analysts’ estimates. Its non-GAAP profit of $0.48 per share was 3.4% above analysts’ consensus estimates.
Sally Beauty (SBH) Q4 CY2025 Highlights:
- Revenue: $943.2 million vs analyst estimates of $940.5 million (flat year on year, in line)
- Adjusted EPS: $0.48 vs analyst estimates of $0.46 (3.4% beat)
- Adjusted EBITDA: $111 million vs analyst estimates of $108.7 million (11.8% margin, 2.2% beat)
- The company reconfirmed its revenue guidance for the full year of $3.74 billion at the midpoint
- Management slightly raised its full-year Adjusted EPS guidance to $2.06 at the midpoint
- Operating Margin: 8.1%, down from 10.7% in the same quarter last year
- Free Cash Flow Margin: 6.1%, up from 1.4% in the same quarter last year
- Locations: 4,415 at quarter end, down from 4,453 in the same quarter last year
- Same-Store Sales were flat year on year (1.6% in the same quarter last year)
- Market Capitalization: $1.58 billion
Company Overview
Catering to both everyday consumers as well as salon professionals, Sally Beauty (NYSE:SBH) is a retailer that sells salon-quality beauty products such as makeup and haircare products.
With regards to the merchandise selection, the company has a strong focus on hair color, hair care, skin care, and nail products. Brands such as Wella, Clairol Professional, and Conair can be found in stores. A Sally Beauty store tends to be small, roughly 2,500 square feet, and located in urban and suburban shopping centers. The company also has an e-commerce platform, launched in 1999, that supplements its brick and mortar operations.
The company operates two banners: Sally Beauty Supply and Beauty Systems Group. Sally Beauty Supply serves the everyday consumer while Beauty Systems serves the salon professional and requires certain credentials and identification to enter. Beauty Systems burnishes the company’s reputation, showing the everyday consumer that Sally Beauty products are used in salons, while Sally Beauty Supply addresses the much larger market of consumer beauty aficionados.
The core customer of Sally Beauty Supply is typically a woman between 18 and 35 years old who considers herself a beauty enthusiast. She has specific preferences with regards to her beauty products and desires more professional-grade offerings which may not be available in the average department store or general merchandise retailer.
4. Beauty and Cosmetics Retailer
Beauty and cosmetics retailers understand that beauty is in the eye of the beholder, but a little lipstick, nail polish, and glowing skin also help the cause. These stores—which mostly cater to consumers but can also garner the attention of salon pros—aim to be a one-stop personal care and beauty products shop with many brands across many categories. E-commerce is changing how consumers buy cosmetics, so these retailers are constantly evolving to meet the customer where and how they want to shop.
Retailers specializing in beauty products include Ulta Beauty (NASDAQ:ULTA) and Bath & Body Works while department stores such as Kohl’s (NYSE:KSS) and Macy’s (NYSE:M) typically feature large cosmetics and fragrance sections.
5. Revenue Growth
A company’s long-term sales performance can indicate its overall quality. Any business can have short-term success, but a top-tier one grows for years.
With $3.71 billion in revenue over the past 12 months, Sally Beauty is a small retailer, which sometimes brings disadvantages compared to larger competitors benefiting from economies of scale and negotiating leverage with suppliers.
As you can see below, Sally Beauty struggled to increase demand as its $3.71 billion of sales for the trailing 12 months was close to its revenue three years ago. This was mainly because it didn’t open many new stores.
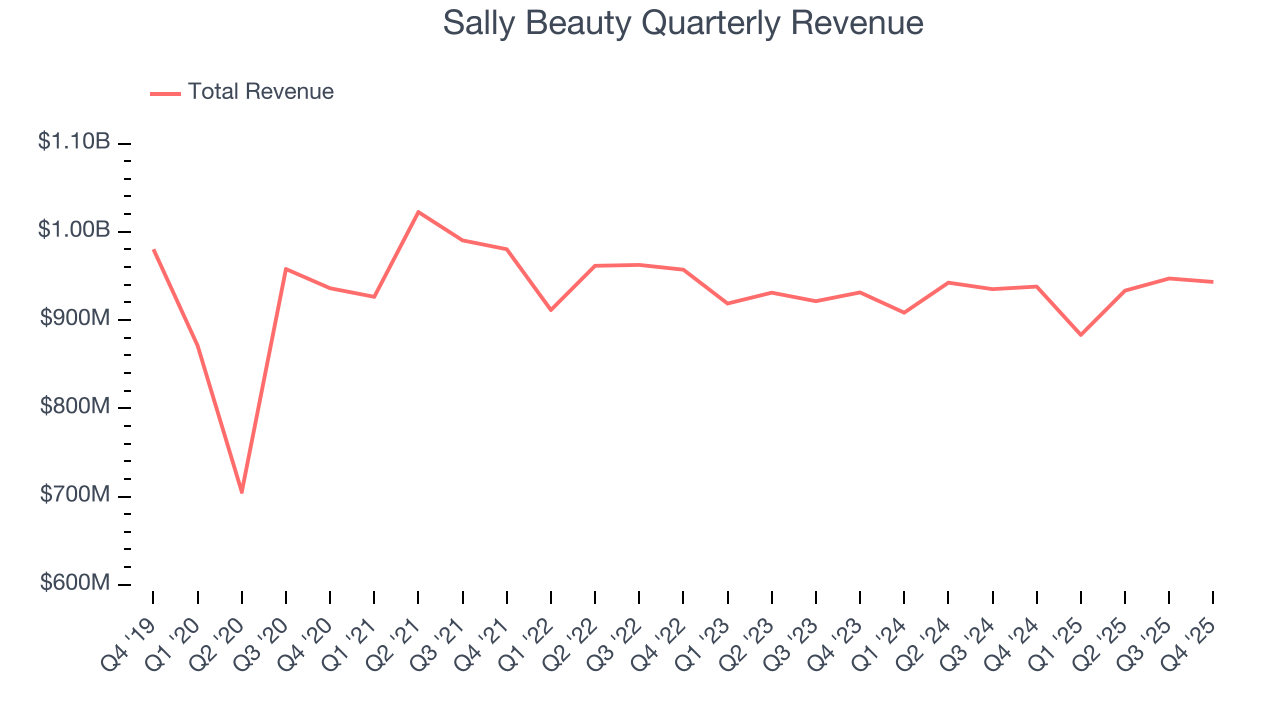
This quarter, Sally Beauty’s $943.2 million of revenue was flat year on year and in line with Wall Street’s estimates. Company management is currently guiding for a 1.9% year-on-year increase in sales next quarter.
Looking further ahead, sell-side analysts expect revenue to grow 1.4% over the next 12 months. Although this projection indicates its newer products will fuel better top-line performance, it is still below the sector average.
6. Store Performance
Number of Stores
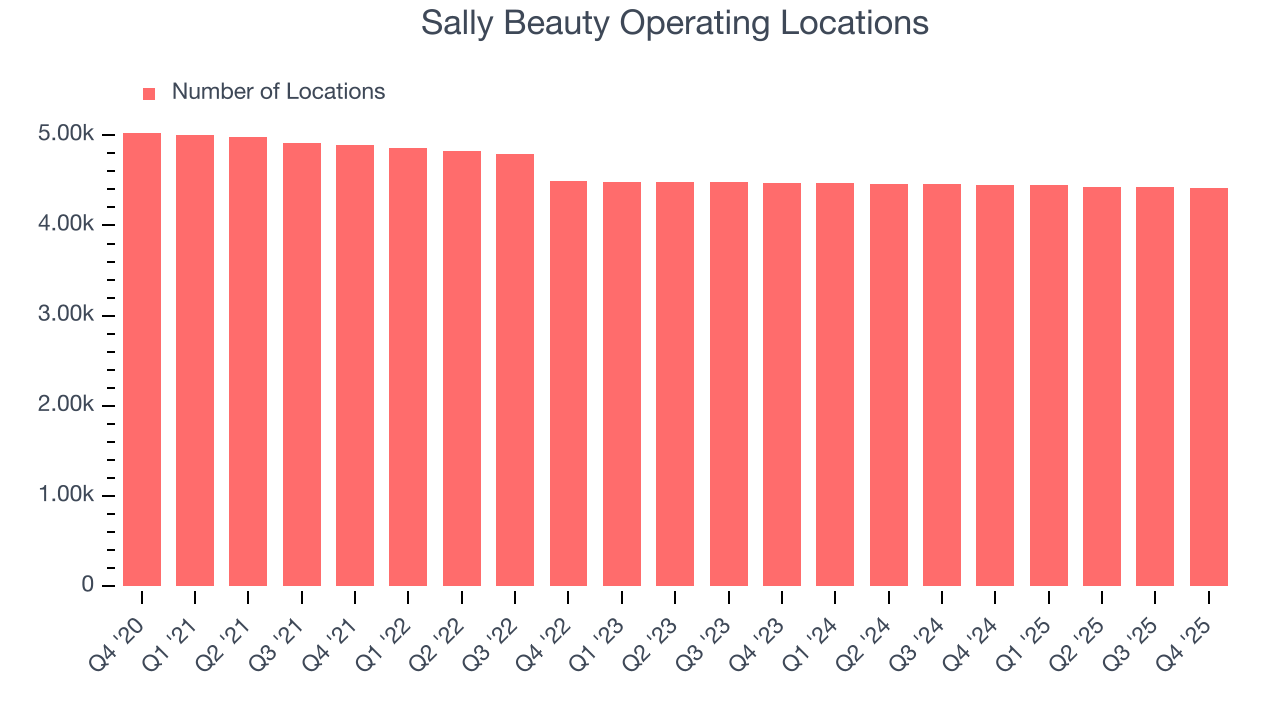
Sally Beauty operated 4,415 locations in the latest quarter, and over the last two years, has kept its store count flat while other consumer retail businesses have opted for growth.
When a retailer keeps its store footprint steady, it usually means demand is stable and it’s focusing on operational efficiency to increase profitability.
Same-Store Sales
A company's store base only paints one part of the picture. When demand is high, it makes sense to open more. But when demand is low, it’s prudent to close some locations and use the money in other ways. Same-store sales provides a deeper understanding of this issue because it measures organic growth at brick-and-mortar shops for at least a year.
Sally Beauty’s demand within its existing locations has barely increased over the last two years as its same-store sales were flat. This performance isn’t ideal, and we’d be skeptical if Sally Beauty starts opening new stores to artificially boost revenue growth.
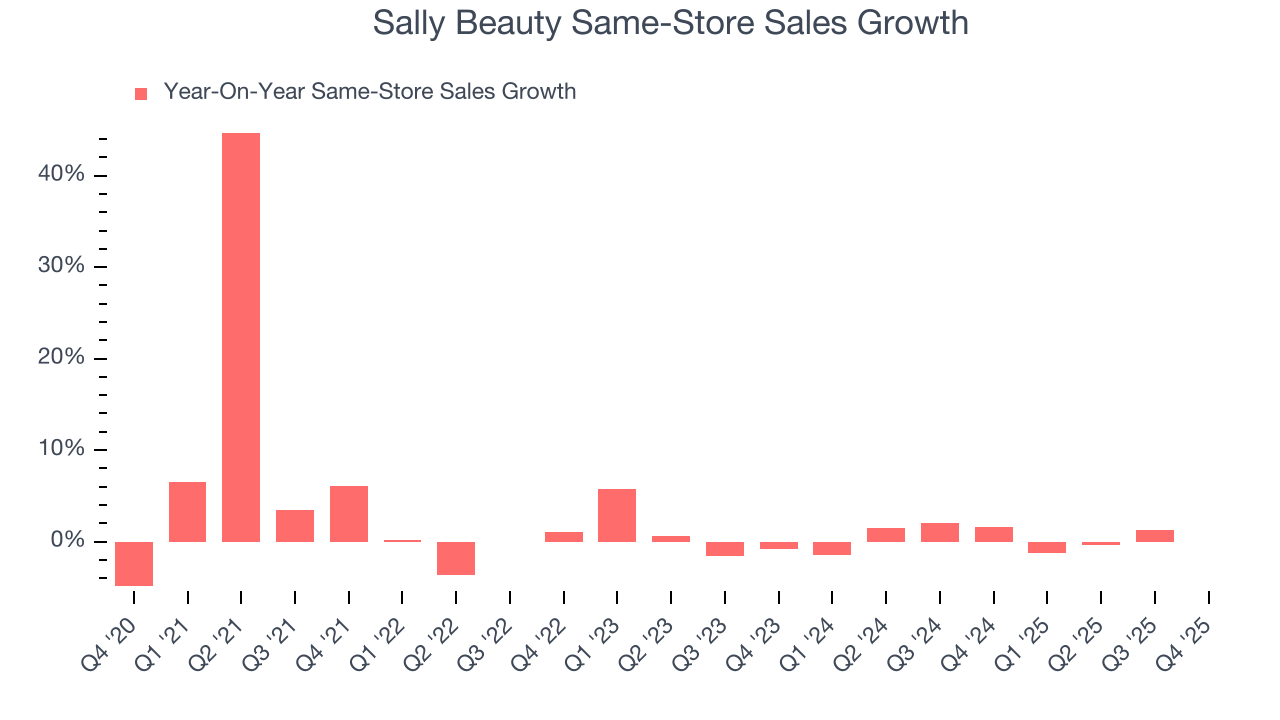
In the latest quarter, Sally Beauty’s year on year same-store sales were flat. This performance was more or less in line with its historical levels.
7. Gross Margin & Pricing Power
Sally Beauty has great unit economics for a retailer, giving it ample room to invest in areas such as marketing and talent to grow its brand. As you can see below, it averaged an excellent 51.4% gross margin over the last two years. That means Sally Beauty only paid its suppliers $48.63 for every $100 in revenue. 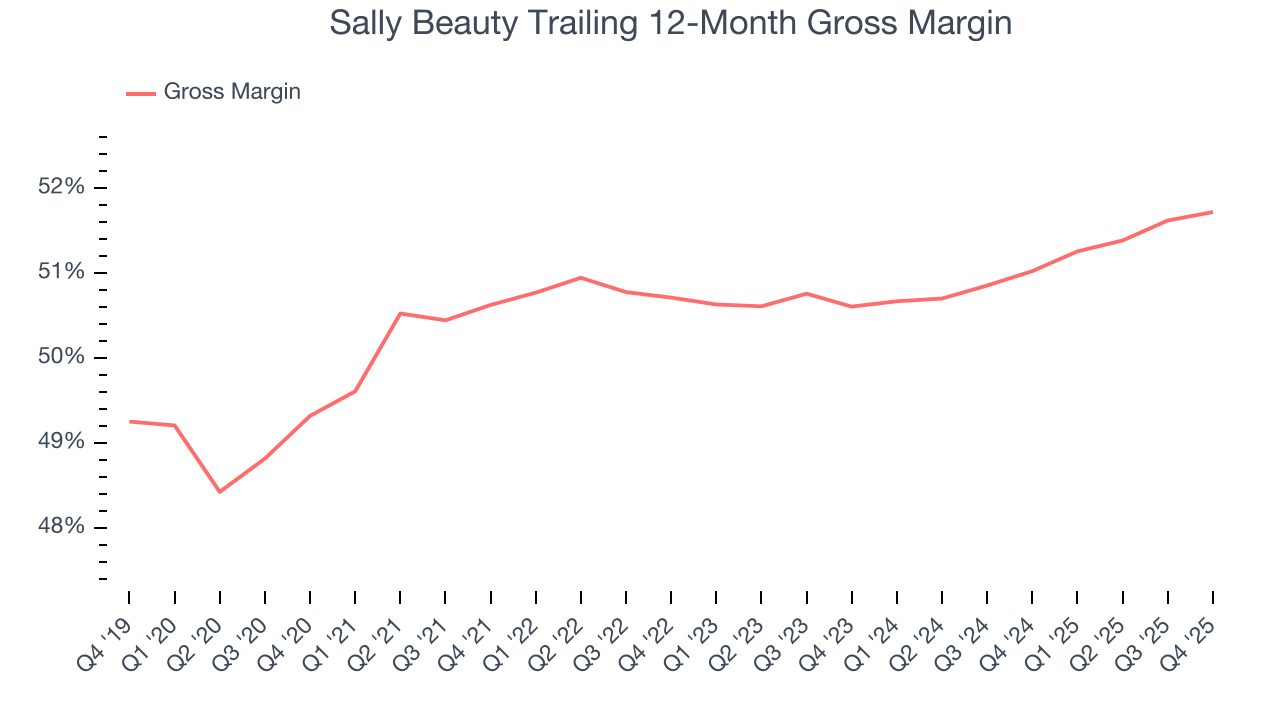
In Q4, Sally Beauty produced a 51.2% gross profit margin, in line with the same quarter last year. Zooming out, the company’s full-year margin has remained steady over the past 12 months, suggesting it strives to keep prices low for customers and has stable input costs (such as labor and freight expenses to transport goods).
8. Operating Margin
Sally Beauty’s operating margin might fluctuated slightly over the last 12 months but has generally stayed the same, averaging 8.3% over the last two years. This profitability was higher than the broader consumer retail sector, showing it did a decent job managing its expenses.
Looking at the trend in its profitability, Sally Beauty’s operating margin might fluctuated slightly but has generally stayed the same over the last year. Shareholders will want to see Sally Beauty grow its margin in the future.
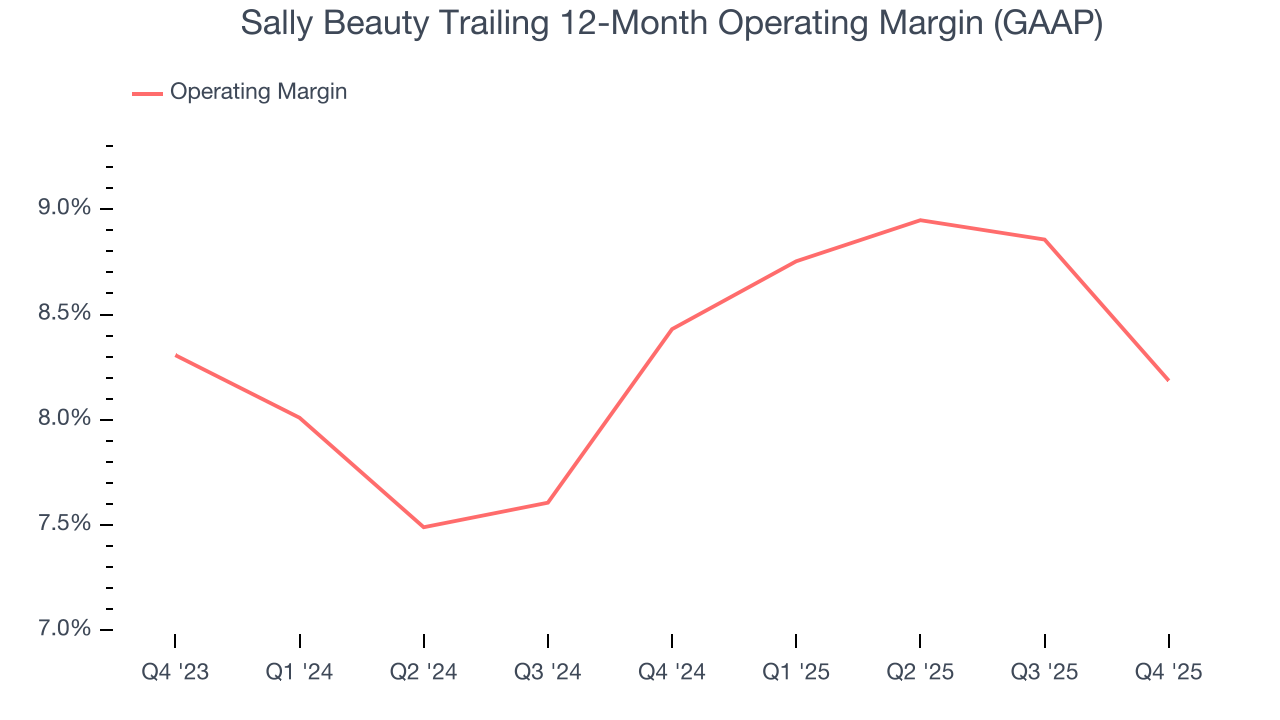
This quarter, Sally Beauty generated an operating margin profit margin of 8.1%, down 2.6 percentage points year on year. Since Sally Beauty’s operating margin decreased more than its gross margin, we can assume it was less efficient because expenses such as marketing, and administrative overhead increased.
9. Earnings Per Share
We track the long-term change in earnings per share (EPS) for the same reason as long-term revenue growth. Compared to revenue, however, EPS highlights whether a company’s growth is profitable.
Sadly for Sally Beauty, its EPS declined by 1.3% annually over the last three years. In a mature sector such as consumer retail, we tend to steer our readers away from companies with falling EPS because it could imply changing secular trends and preferences. If the tide turns unexpectedly, Sally Beauty’s low margin of safety could leave its stock price susceptible to large downswings.
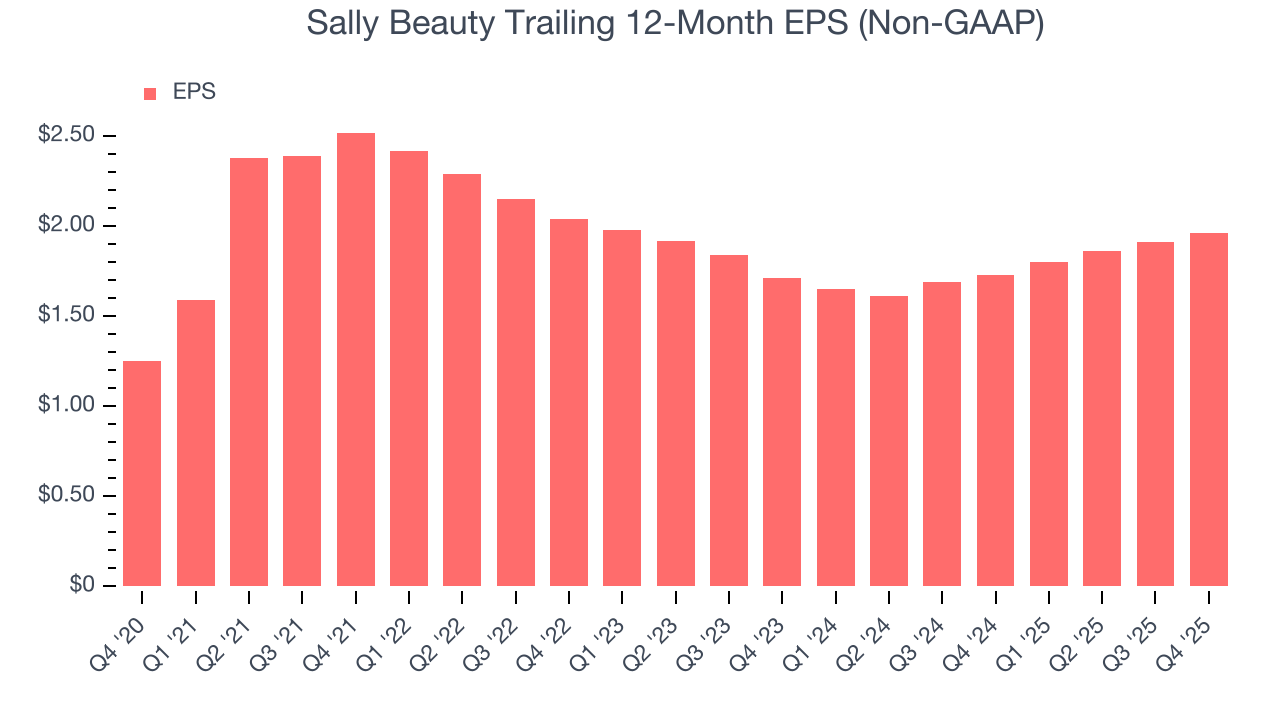
In Q4, Sally Beauty reported adjusted EPS of $0.48, up from $0.43 in the same quarter last year. This print beat analysts’ estimates by 3.4%. Over the next 12 months, Wall Street expects Sally Beauty’s full-year EPS of $1.96 to grow 8.1%.
10. Cash Is King
Although earnings are undoubtedly valuable for assessing company performance, we believe cash is king because you can’t use accounting profits to pay the bills.
Sally Beauty has shown impressive cash profitability, driven by its attractive business model that gives it the option to reinvest or return capital to investors. The company’s free cash flow margin averaged 4.8% over the last two years, better than the broader consumer retail sector.
Taking a step back, we can see that Sally Beauty’s margin expanded by 2.1 percentage points over the last year. This shows the company is heading in the right direction, and we can see it became a less capital-intensive business because its free cash flow profitability rose while its operating profitability was flat.
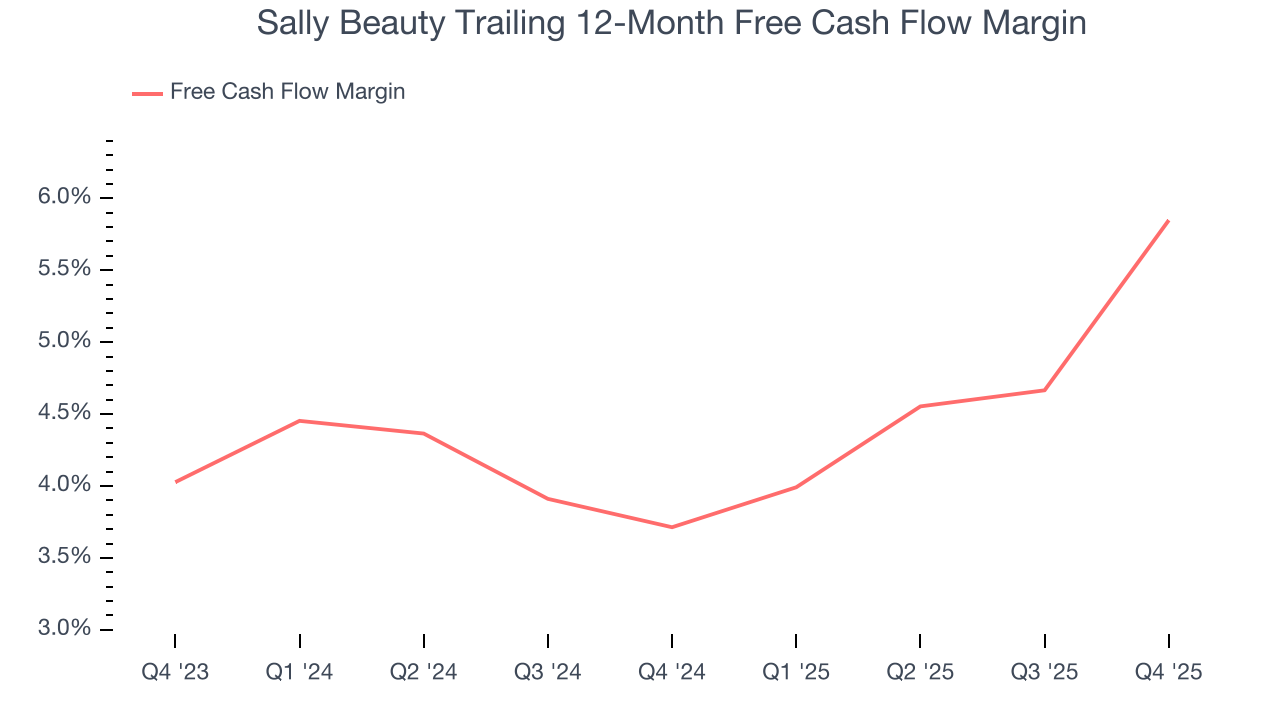
Sally Beauty’s free cash flow clocked in at $57.46 million in Q4, equivalent to a 6.1% margin. This result was good as its margin was 4.7 percentage points higher than in the same quarter last year, building on its favorable historical trend.
11. Return on Invested Capital (ROIC)
EPS and free cash flow tell us whether a company was profitable while growing its revenue. But was it capital-efficient? Enter ROIC, a metric showing how much operating profit a company generates relative to the money it has raised (debt and equity).
Sally Beauty historically did a mediocre job investing in profitable growth initiatives. Its five-year average ROIC was 12.3%, somewhat low compared to the best consumer retail companies that consistently pump out 25%+.
12. Balance Sheet Assessment
Sally Beauty reported $157.2 million of cash and $1.54 billion of debt on its balance sheet in the most recent quarter. As investors in high-quality companies, we primarily focus on two things: 1) that a company’s debt level isn’t too high and 2) that its interest payments are not excessively burdening the business.
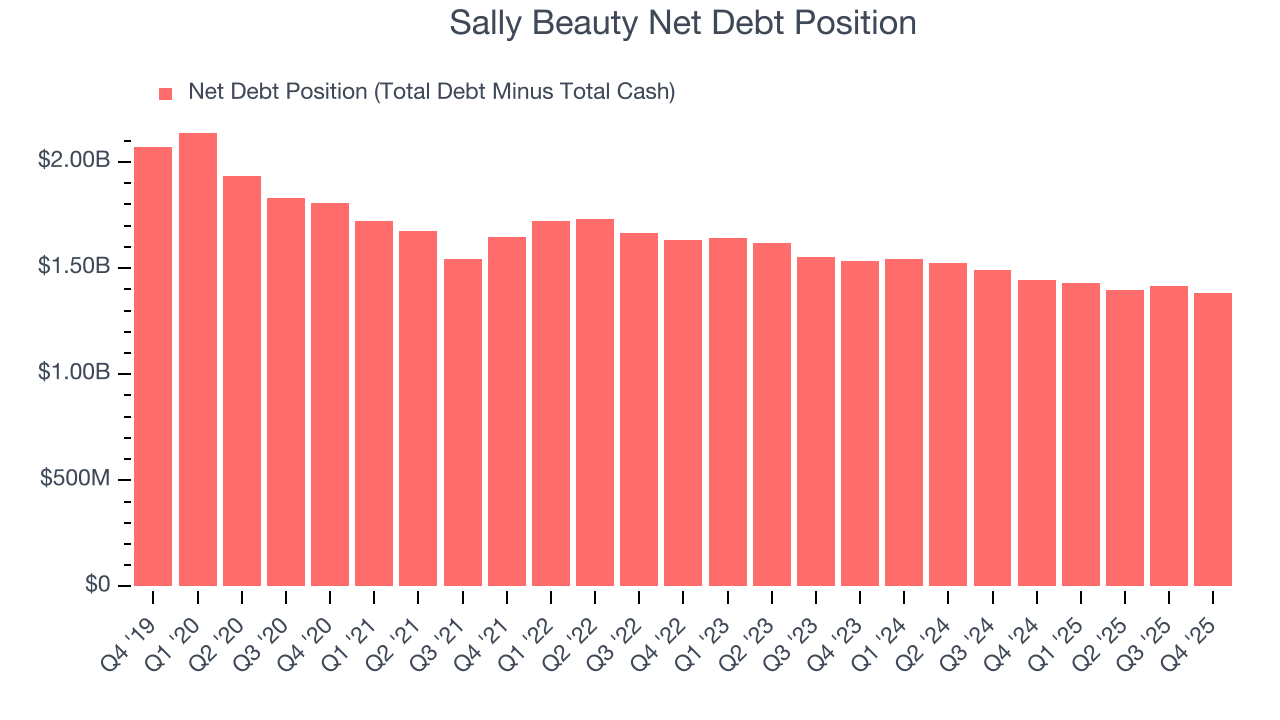
With $448.5 million of EBITDA over the last 12 months, we view Sally Beauty’s 3.1× net-debt-to-EBITDA ratio as safe. We also see its $32.33 million of annual interest expenses as appropriate. The company’s profits give it plenty of breathing room, allowing it to continue investing in growth initiatives.
13. Key Takeaways from Sally Beauty’s Q4 Results
It was encouraging to see Sally Beauty beat analysts’ EBITDA expectations this quarter. We were also glad its EPS outperformed Wall Street’s estimates. On the other hand, its EPS guidance for next quarter missed. Overall, this quarter could have been better. The stock traded down 2% to $15.84 immediately after reporting.
14. Is Now The Time To Buy Sally Beauty?
Updated: March 15, 2026 at 10:39 PM EDT
Before deciding whether to buy Sally Beauty or pass, we urge investors to consider business quality, valuation, and the latest quarterly results.
Sally Beauty doesn’t pass our quality test. To kick things off, its revenue has declined over the last three years. While its admirable gross margins are a wonderful starting point for the overall profitability of the business, the downside is its brand caters to a niche market. On top of that, its low growth in new store openings show it’s focused on existing locations.
Sally Beauty’s P/E ratio based on the next 12 months is 6.8x. While this valuation is optically cheap, the potential downside is huge given its shaky fundamentals. There are better stocks to buy right now.
Wall Street analysts have a consensus one-year price target of $18.80 on the company (compared to the current share price of $14.54).
Although the price target is bullish, readers should exercise caution because analysts tend to be overly optimistic. The firms they work for, often big banks, have relationships with companies that extend into fundraising, M&A advisory, and other rewarding business lines. As a result, they typically hesitate to say bad things for fear they will lose out. We at StockStory do not suffer from such conflicts of interest, so we’ll always tell it like it is.