
G-III (GIII)
We wouldn’t buy G-III. Its sales have underperformed and its low returns on capital show it has few growth opportunities.― StockStory Analyst Team
1. News
2. Summary
Why We Think G-III Will Underperform
Founded as a small leather goods business, G-III (NASDAQ:GIII) is a fashion and apparel conglomerate with a diverse portfolio of brands.
- Annual revenue growth of 3.9% over the last five years was below our standards for the consumer discretionary sector
- Sales are expected to decline once again over the next 12 months as it continues working through a challenging demand environment
- Responsiveness to unforeseen market trends is restricted due to its substandard operating margin profitability


G-III’s quality is inadequate. There are superior opportunities elsewhere.
Why There Are Better Opportunities Than G-III


G-III is trading at $30.29 per share, or 13x forward P/E. This multiple is lower than most consumer discretionary companies, but for good reason.
We’d rather pay up for companies with elite fundamentals than get a bargain on weak ones. Cheap stocks can be value traps, and as their performance deteriorates, they will stay cheap or get even cheaper.
3. G-III (GIII) Research Report: Q3 CY2025 Update
Fashion conglomerate G-III (NASDAQ:GIII) fell short of the markets revenue expectations in Q3 CY2025, with sales falling 9% year on year to $988.6 million. The company’s full-year revenue guidance of $2.98 billion at the midpoint came in 1.3% below analysts’ estimates. Its non-GAAP profit of $1.90 per share was 17.9% above analysts’ consensus estimates.
G-III (GIII) Q3 CY2025 Highlights:
- Revenue: $988.6 million vs analyst estimates of $1.01 billion (9% year-on-year decline, 2.3% miss)
- Adjusted EPS: $1.90 vs analyst estimates of $1.61 (17.9% beat)
- Adjusted EBITDA: $124.9 million vs analyst estimates of $111 million (12.6% margin, 12.5% beat)
- The company dropped its revenue guidance for the full year to $2.98 billion at the midpoint from $3.02 billion, a 1.3% decrease
- Management raised its full-year Adjusted EPS guidance to $2.85 at the midpoint, a 7.5% increase
- EBITDA guidance for the full year is $210.5 million at the midpoint, above analyst estimates of $203.7 million
- Operating Margin: 11.4%, down from 15.3% in the same quarter last year
- Market Capitalization: $1.25 billion
Company Overview
Founded as a small leather goods business, G-III (NASDAQ:GIII) is a fashion and apparel conglomerate with a diverse portfolio of brands.
G-III's portfolio of licensed and owned brands caters to both the luxury and mass market segments. The company holds licenses for household names such as Calvin Klein, Tommy Hilfiger, Levi's, and Champion, allowing it to produce and sell products under these esteemed labels. G-III also owns brands such as DKNY, Donna Karan, Vilebrequin, G.H. Bass, and Andrew Marc.
The G-III customer is the average consumer who seeks a combination of style and value. These customers tend to value name brands and have been conditioned to shop for items that are on sale or offered at a promotional price.
G-III leverages an extensive distribution network to reach its customers, including department stores, specialty retailers, online retailers, and its own branded brick-and-mortar stores. This multi-channel distribution strategy enables G-III to sell its products globally.
4. Apparel and Accessories
Thanks to social media and the internet, not only are styles changing more frequently today than in decades past but also consumers are shifting the way they buy their goods, favoring omnichannel and e-commerce experiences. Some apparel and accessories companies have made concerted efforts to adapt while those who are slower to move may fall behind.
G-III’s primary competitors include Ralph Lauren (NYSE:RL), VF Corp (NYSE:VFC), owner of The North Face and Timberland, and Capri Holdings (NYSE:CPRI), owner of Michael Kors and Versace.
5. Revenue Growth
Examining a company’s long-term performance can provide clues about its quality. Any business can have short-term success, but a top-tier one grows for years. Over the last five years, G-III grew its sales at a weak 5.8% compounded annual growth rate. This fell short of our benchmark for the consumer discretionary sector and is a rough starting point for our analysis.
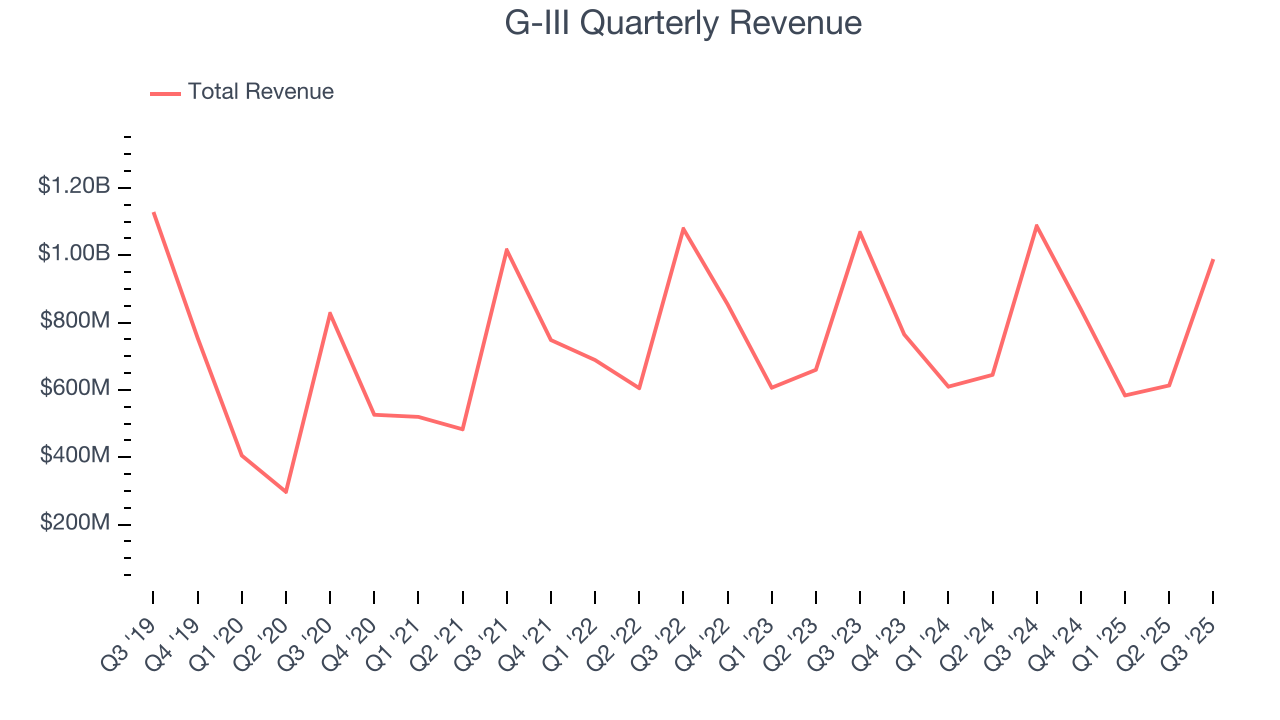
We at StockStory place the most emphasis on long-term growth, but within consumer discretionary, a stretched historical view may miss a company riding a successful new product or trend. G-III’s performance shows it grew in the past but relinquished its gains over the last two years, as its revenue fell by 2.6% annually. 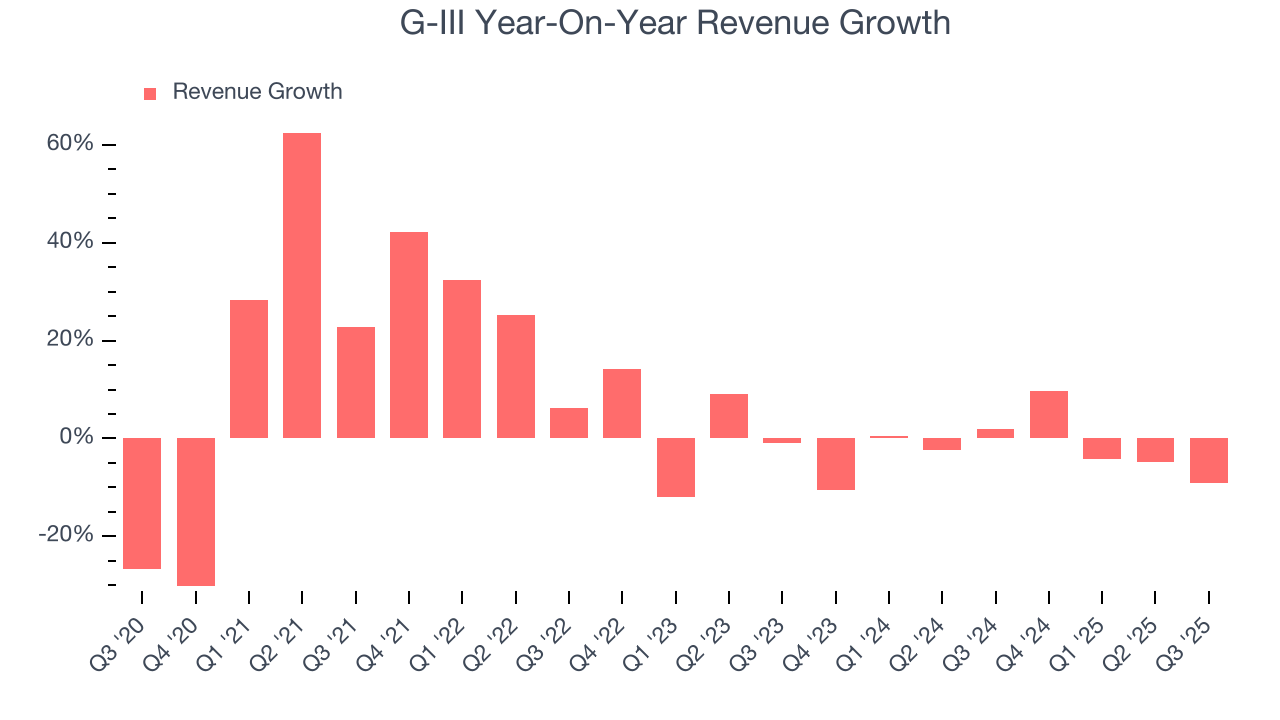
This quarter, G-III missed Wall Street’s estimates and reported a rather uninspiring 9% year-on-year revenue decline, generating $988.6 million of revenue.
Looking ahead, sell-side analysts expect revenue to decline by 2.8% over the next 12 months, similar to its two-year rate. This projection doesn't excite us and suggests its newer products and services will not catalyze better top-line performance yet.
6. Operating Margin
Operating margin is a key measure of profitability. Think of it as net income - the bottom line - excluding the impact of taxes and interest on debt, which are less connected to business fundamentals.
G-III’s operating margin has been trending down over the last 12 months and averaged 7.8% over the last two years. The company’s profitability was mediocre for a consumer discretionary business and shows it couldn’t pass its higher operating expenses onto its customers.
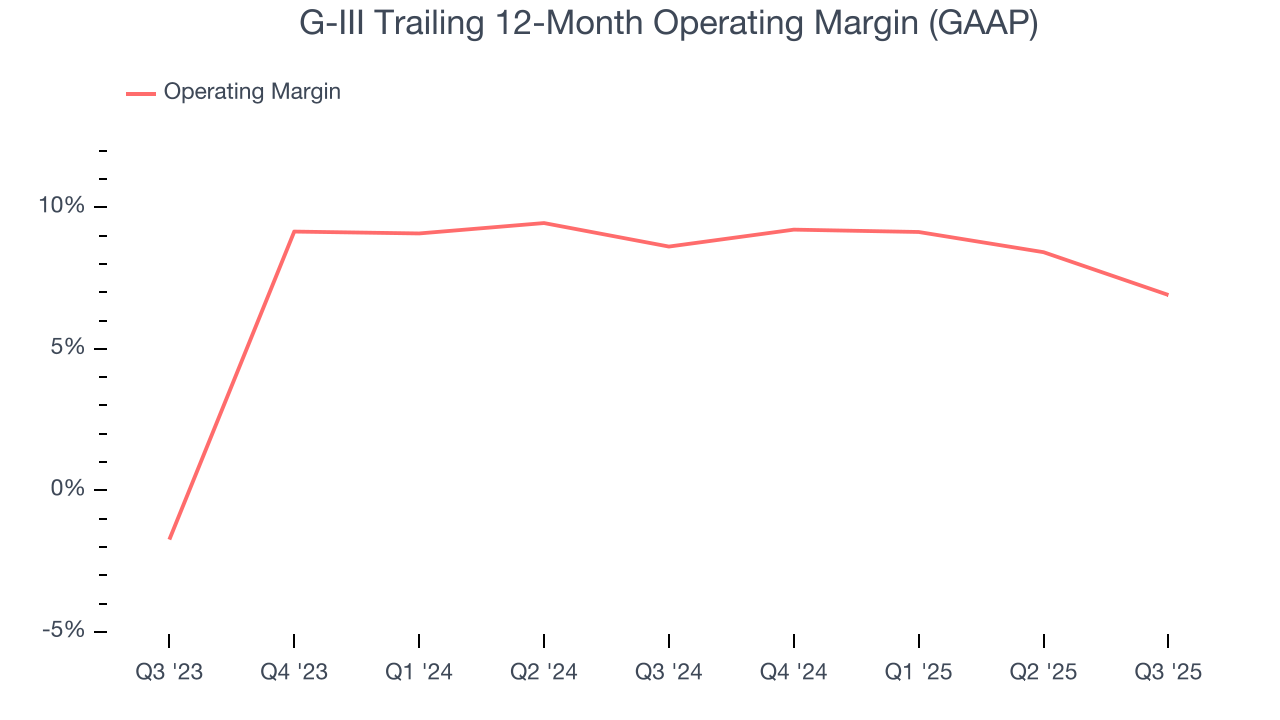
This quarter, G-III generated an operating margin profit margin of 11.4%, down 3.9 percentage points year on year. This contraction shows it was less efficient because its expenses increased relative to its revenue.
7. Earnings Per Share
Revenue trends explain a company’s historical growth, but the long-term change in earnings per share (EPS) points to the profitability of that growth – for example, a company could inflate its sales through excessive spending on advertising and promotions.
G-III’s EPS grew at a decent 32.3% compounded annual growth rate over the last five years, higher than its 5.8% annualized revenue growth. However, this alone doesn’t tell us much about its business quality because its operating margin didn’t improve.
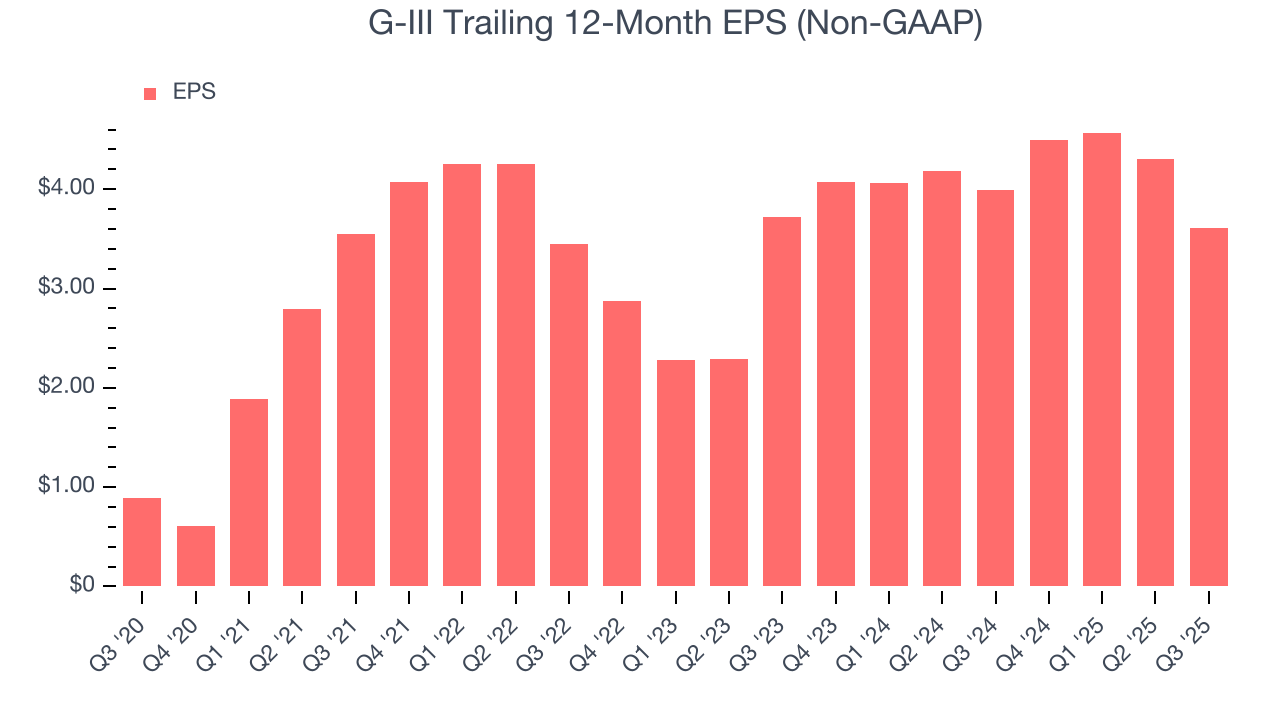
In Q3, G-III reported adjusted EPS of $1.90, down from $2.59 in the same quarter last year. Despite falling year on year, this print easily cleared analysts’ estimates. Over the next 12 months, Wall Street expects G-III’s full-year EPS of $3.61 to shrink by 26%.
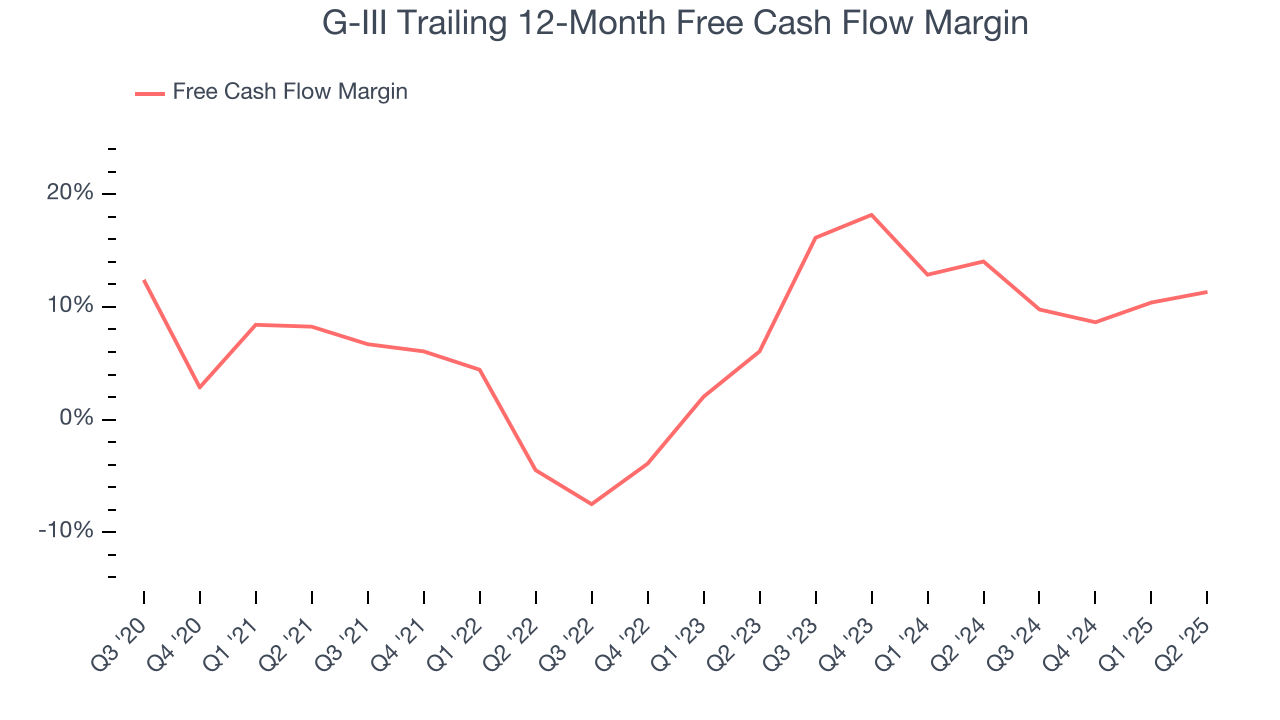
8. Cash Is King
If you’ve followed StockStory for a while, you know we emphasize free cash flow. Why, you ask? We believe that in the end, cash is king, and you can’t use accounting profits to pay the bills.
G-III has shown poor cash profitability over the last two years, giving the company limited opportunities to return capital to shareholders. Its free cash flow margin averaged 15.1%, lousy for a consumer discretionary business.
9. Return on Invested Capital (ROIC)
EPS and free cash flow tell us whether a company was profitable while growing its revenue. But was it capital-efficient? A company’s ROIC explains this by showing how much operating profit it makes compared to the money it has raised (debt and equity).
G-III historically did a mediocre job investing in profitable growth initiatives. Its five-year average ROIC was 7.9%, somewhat low compared to the best consumer discretionary companies that consistently pump out 25%+.
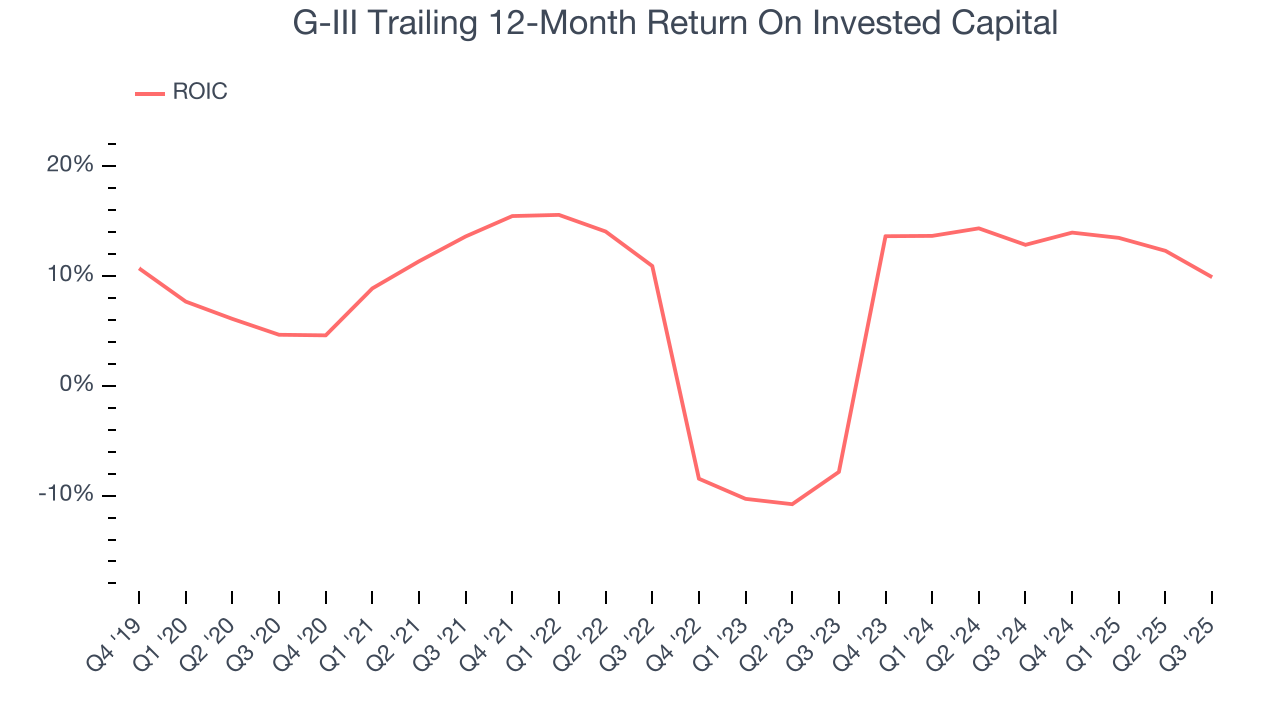
We like to invest in businesses with high returns, but the trend in a company’s ROIC is what often surprises the market and moves the stock price. Unfortunately, G-III’s ROIC has stayed the same over the last few years. If the company wants to become an investable business, it must improve its returns by generating more profitable growth.
10. Key Takeaways from G-III’s Q3 Results
It was good to see G-III beat analysts’ EPS expectations this quarter. We were also glad its EBITDA outperformed Wall Street’s estimates. On the other hand, its revenue missed and its full-year revenue guidance fell slightly short of Wall Street’s estimates. Zooming out, we think this was a mixed quarter. The stock traded up 10.3% to $32.72 immediately following the results.
11. Is Now The Time To Buy G-III?
Updated: December 9, 2025 at 9:52 PM EST
Before making an investment decision, investors should account for G-III’s business fundamentals and valuation in addition to what happened in the latest quarter.
We cheer for all companies serving everyday consumers, but in the case of G-III, we’ll be cheering from the sidelines. To begin with, its revenue growth was weak over the last five years, and analysts expect its demand to deteriorate over the next 12 months. On top of that, G-III’s projected EPS for the next year is lacking, and its relatively low ROIC suggests management has struggled to find compelling investment opportunities.
G-III’s P/E ratio based on the next 12 months is 11.1x. This multiple tells us a lot of good news is priced in - we think there are better stocks to buy right now.
Wall Street analysts have a consensus one-year price target of $31.25 on the company (compared to the current share price of $30.88).