
Rush Enterprises (RUSHA)
Rush Enterprises is up against the odds. Its poor sales growth and falling returns on capital suggest its growth opportunities are shrinking.― StockStory Analyst Team
1. News


2. Summary
Why We Think Rush Enterprises Will Underperform
Headquartered in Texas, Rush Enterprises (NASDAQ:RUSH.A) provides truck-related services and solutions, including sales, leasing, parts, and maintenance for commercial vehicles.
- Annual sales declines of 3.1% for the past two years show its products and services struggled to connect with the market during this cycle
- Earnings per share have contracted by 11.1% annually over the last two years, a headwind for returns as stock prices often echo long-term EPS performance
- High input costs result in an inferior gross margin of 20.3% that must be offset through higher volumes


Rush Enterprises doesn’t fulfill our quality requirements. We’re hunting for superior stocks elsewhere.
Why There Are Better Opportunities Than Rush Enterprises


Rush Enterprises is trading at $63.80 per share, or 17.3x forward P/E. This multiple is lower than most industrials companies, but for good reason.
Cheap stocks can look like a great deal at first glance, but they can be value traps. They often have less earnings power, meaning there is more reliance on a re-rating to generate good returns - an unlikely scenario for low-quality companies.
3. Rush Enterprises (RUSHA) Research Report: Q4 CY2025 Update
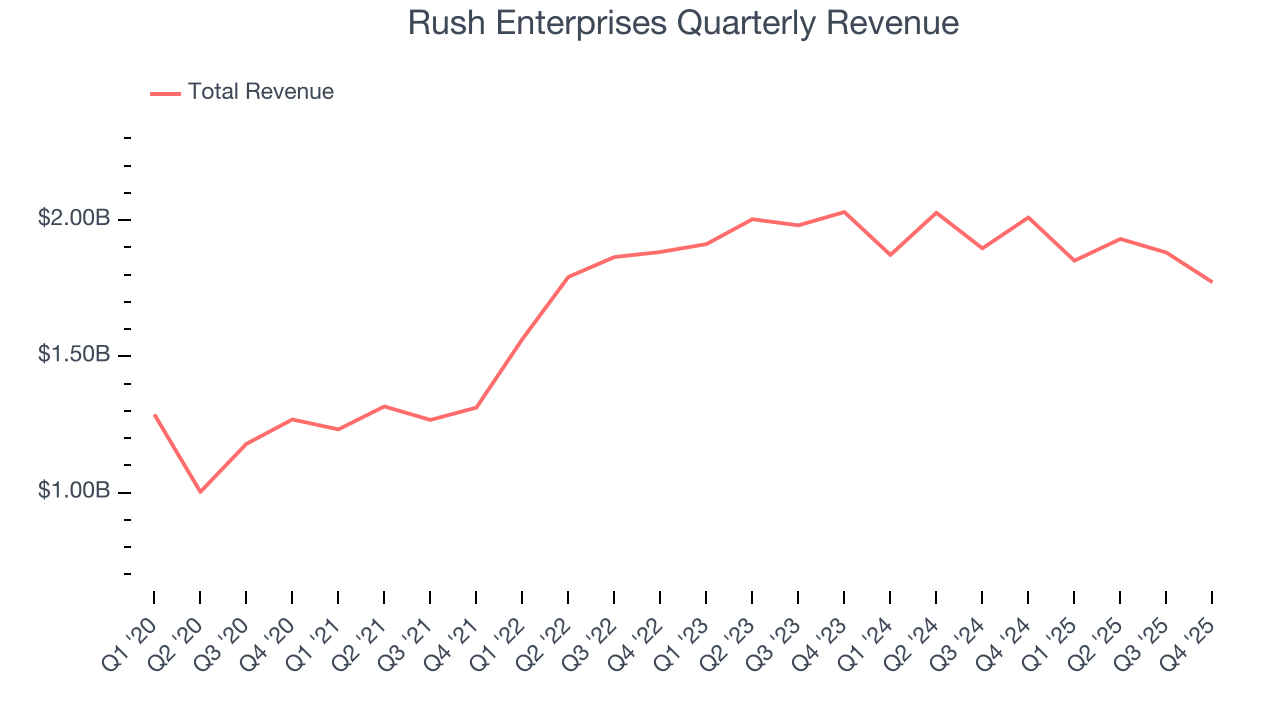
Commercial vehicle retailer Rush Enterprises (NASDAQ:RUSH.A) reported Q4 CY2025 results exceeding the market’s revenue expectations, but sales fell by 11.8% year on year to $1.77 billion. Its GAAP profit of $0.81 per share was 17.1% above analysts’ consensus estimates.
Rush Enterprises (RUSHA) Q4 CY2025 Highlights:
- Revenue: $1.77 billion vs analyst estimates of $1.73 billion (11.8% year-on-year decline, 2.6% beat)
- EPS (GAAP): $0.81 vs analyst estimates of $0.69 (17.1% beat)
- Operating Margin: 5.2%, in line with the same quarter last year
- Market Capitalization: $5.40 billion
Company Overview
Headquartered in Texas, Rush Enterprises (NASDAQ:RUSH.A) provides truck-related services and solutions, including sales, leasing, parts, and maintenance for commercial vehicles.
Rush Enterprises was founded in 1965 to address the growing demand for commercial truck sales and services. The company started as a single dealership and has since expanded to become a significant player in the commercial vehicle industry.
Rush Enterprises provides an array of services, including the sale and leasing of new and used commercial vehicles, parts distribution, and maintenance services. The company supports various industries by ensuring that businesses have access to well-maintained commercial vehicles. For example, Rush Enterprises helps transportation companies keep their fleets operational by providing timely maintenance and readily available replacement parts.
The primary revenue sources for Rush Enterprises come from vehicle sales, leasing agreements, parts sales, and maintenance services. The company's business model focuses on building long-term relationships with customers through a network of dealerships and service centers. Rush Enterprises appeals to businesses seeking comprehensive truck-related solutions, generating recurring revenue through service contracts and ongoing parts sales.
4. Vehicle Parts Distributors
Supply chain and inventory management are themes that grew in focus after COVID wreaked havoc on the global movement of raw materials and components. Transportation parts distributors that boast reliable selection in sometimes specialized areas combined and quickly deliver products to customers can benefit from this theme. Additionally, distributors who earn meaningful revenue streams from aftermarket products can enjoy more steady top-line trends and higher margins. But like the broader industrials sector, transportation parts distributors are also at the whim of economic cycles that impact capital spending, transportation volumes, and demand for discretionary parts and components.
Competitors in the commercial vehicle industry include PACCAR (NASDAQ:PCAR), Penske (NYSE:PAG), and Covenant (NASDAQ:CVLG).
5. Revenue Growth
A company’s long-term sales performance can indicate its overall quality. Any business can have short-term success, but a top-tier one grows for years. Over the last five years, Rush Enterprises grew its sales at a solid 9.4% compounded annual growth rate. Its growth beat the average industrials company and shows its offerings resonate with customers.
We at StockStory place the most emphasis on long-term growth, but within industrials, a half-decade historical view may miss cycles, industry trends, or a company capitalizing on catalysts such as a new contract win or a successful product line. Rush Enterprises’s recent performance marks a sharp pivot from its five-year trend as its revenue has shown annualized declines of 3.1% over the last two years. 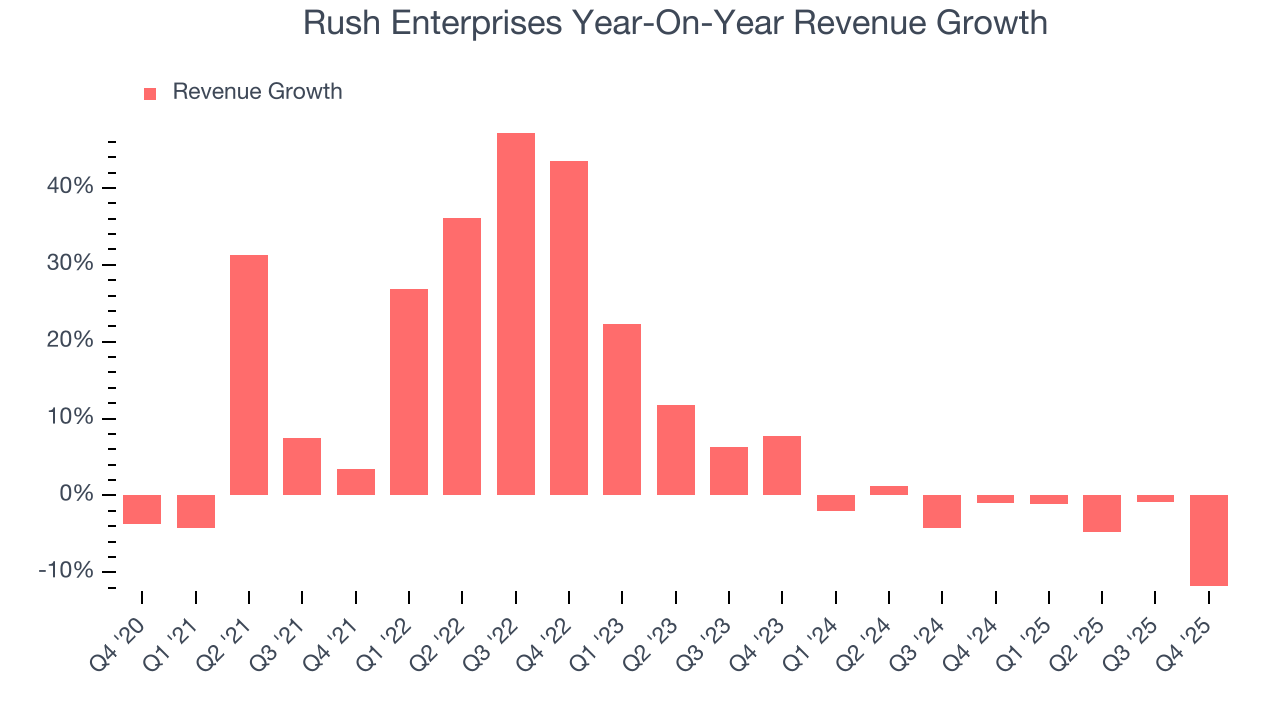
We can dig further into the company’s revenue dynamics by analyzing its most important segments, Vehicles and Aftermarket, which are 32.5% and 18.3% of revenue. Over the last two years, Rush Enterprises’s Vehicles revenue (new and used commercial trucks) averaged 22.6% year-on-year declines while its Aftermarket revenue (parts and services) averaged 17.9% declines. 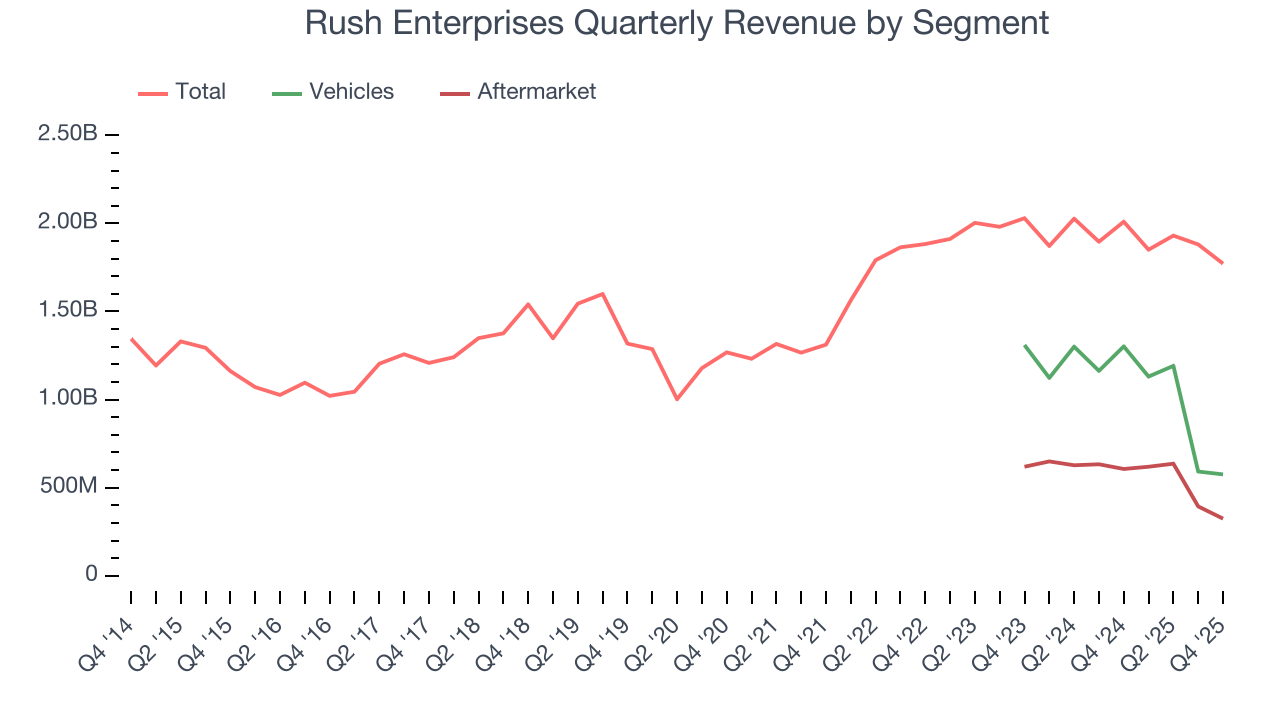
This quarter, Rush Enterprises’s revenue fell by 11.8% year on year to $1.77 billion but beat Wall Street’s estimates by 2.6%.
Looking ahead, sell-side analysts expect revenue to grow 1.2% over the next 12 months. Although this projection implies its newer products and services will spur better top-line performance, it is still below the sector average.
6. Gross Margin & Pricing Power
All else equal, we prefer higher gross margins because they make it easier to generate more operating profits and indicate that a company commands pricing power by offering more differentiated products.
Rush Enterprises has bad unit economics for an industrials business, signaling it operates in a competitive market. As you can see below, it averaged a 20.3% gross margin over the last five years. Said differently, Rush Enterprises had to pay a chunky $79.68 to its suppliers for every $100 in revenue. 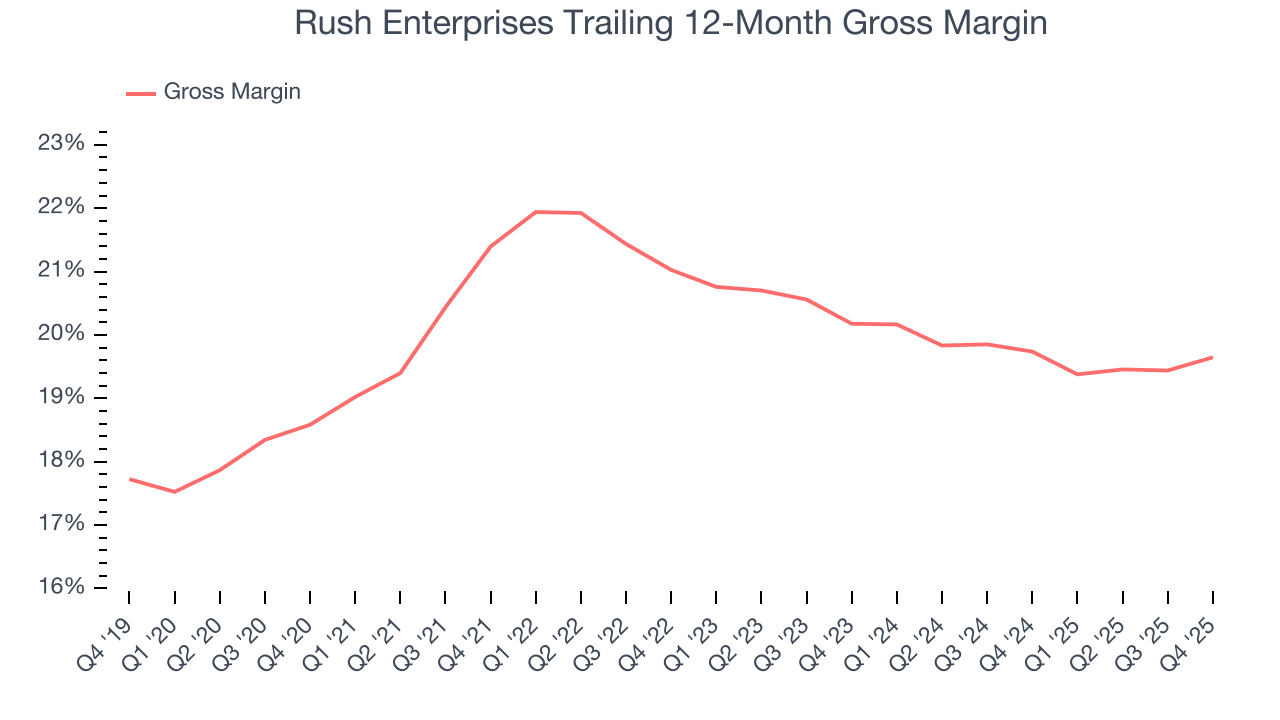
Rush Enterprises produced a 19.7% gross profit margin in Q4, in line with the same quarter last year. On a wider time horizon, the company’s full-year margin has remained steady over the past four quarters, suggesting its input costs (such as raw materials and manufacturing expenses) have been stable and it isn’t under pressure to lower prices.
7. Operating Margin
Rush Enterprises’s operating margin might fluctuated slightly over the last 12 months but has generally stayed the same, averaging 6.2% over the last five years. This profitability was paltry for an industrials business and caused by its suboptimal cost structureand low gross margin.
Looking at the trend in its profitability, Rush Enterprises’s operating margin might fluctuated slightly but has generally stayed the same over the last five years. This raises questions about the company’s expense base because its revenue growth should have given it leverage on its fixed costs, resulting in better economies of scale and profitability.
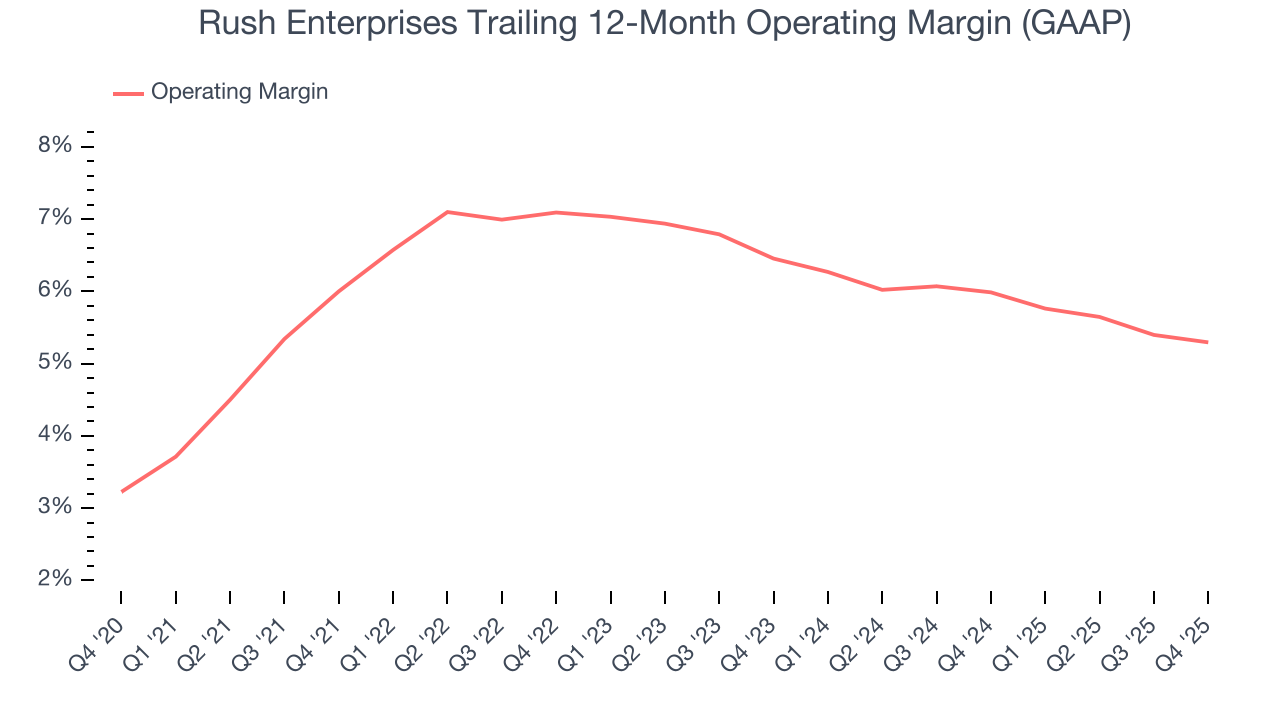
This quarter, Rush Enterprises generated an operating margin profit margin of 5.2%, in line with the same quarter last year. This indicates the company’s cost structure has recently been stable.
8. Earnings Per Share
We track the long-term change in earnings per share (EPS) for the same reason as long-term revenue growth. Compared to revenue, however, EPS highlights whether a company’s growth is profitable.
Rush Enterprises’s EPS grew at an astounding 19.2% compounded annual growth rate over the last five years, higher than its 9.4% annualized revenue growth. However, this alone doesn’t tell us much about its business quality because its operating margin didn’t improve.
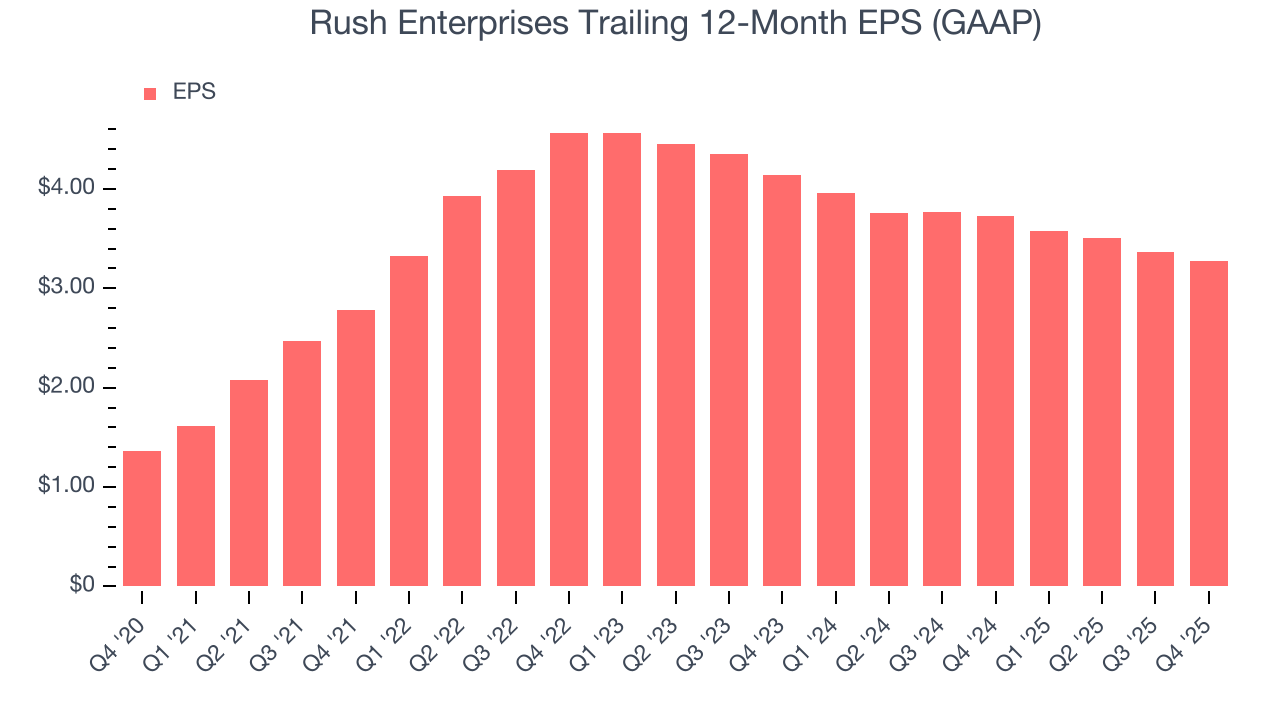
We can take a deeper look into Rush Enterprises’s earnings to better understand the drivers of its performance. A five-year view shows that Rush Enterprises has repurchased its stock, shrinking its share count by 7.4%. This tells us its EPS outperformed its revenue not because of increased operational efficiency but financial engineering, as buybacks boost per share earnings. 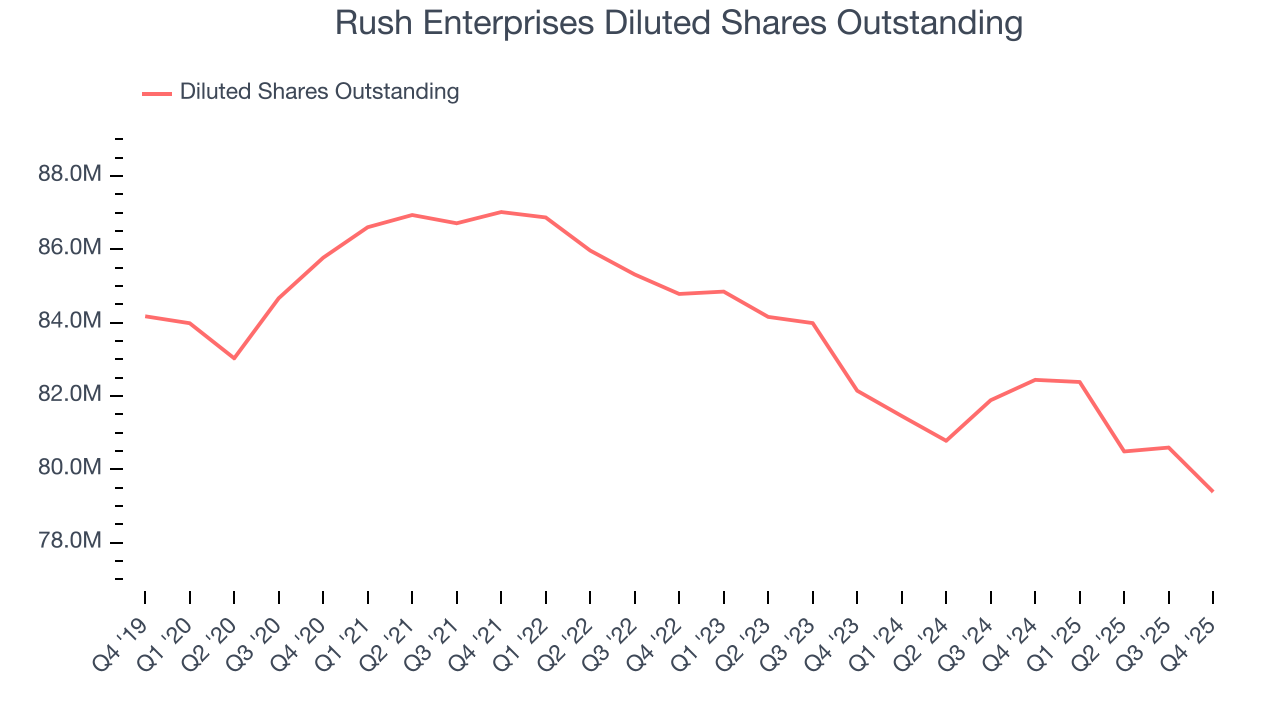
Like with revenue, we analyze EPS over a more recent period because it can provide insight into an emerging theme or development for the business.
For Rush Enterprises, its two-year annual EPS declines of 11.2% mark a reversal from its (seemingly) healthy five-year trend. We hope Rush Enterprises can return to earnings growth in the future.
In Q4, Rush Enterprises reported EPS of $0.81, down from $0.91 in the same quarter last year. Despite falling year on year, this print easily cleared analysts’ estimates. Over the next 12 months, Wall Street expects Rush Enterprises’s full-year EPS of $3.27 to grow 13.5%.
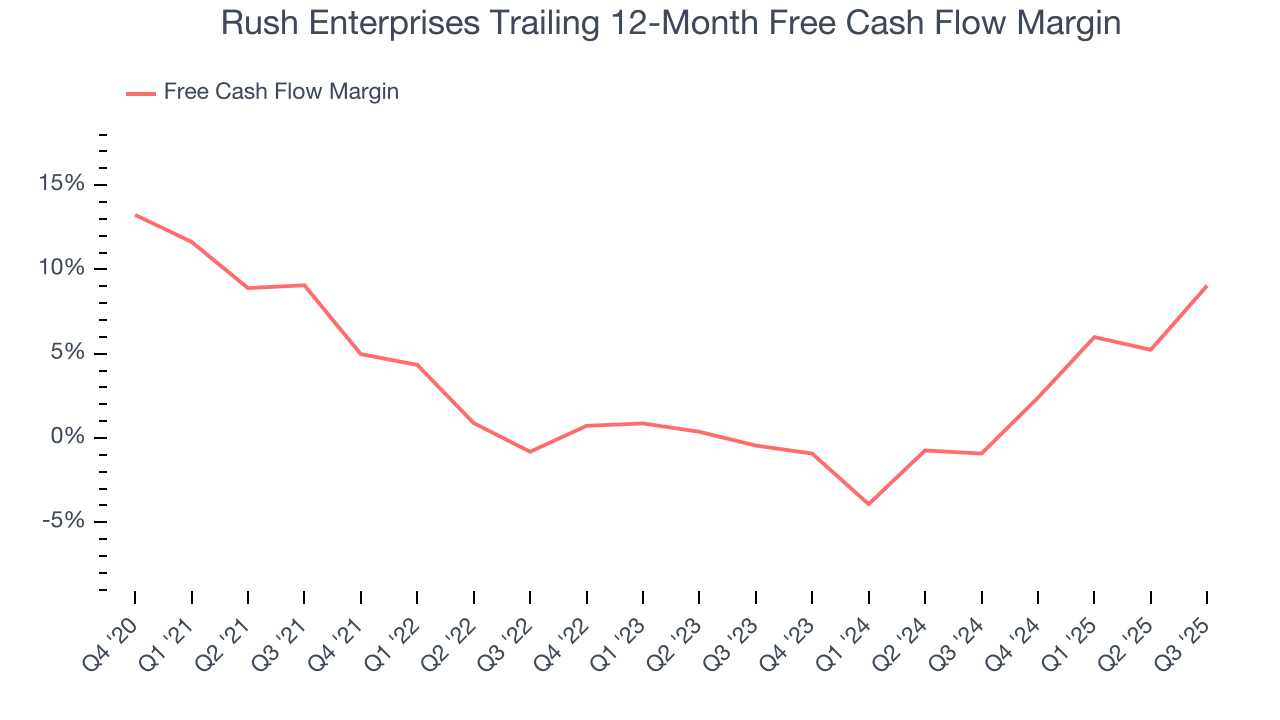
9. Cash Is King
Although earnings are undoubtedly valuable for assessing company performance, we believe cash is king because you can’t use accounting profits to pay the bills.
Rush Enterprises has shown poor cash profitability over the last five years, giving the company limited opportunities to return capital to shareholders. Its free cash flow margin averaged 2.5%, lousy for an industrials business.
10. Return on Invested Capital (ROIC)
EPS and free cash flow tell us whether a company was profitable while growing its revenue. But was it capital-efficient? A company’s ROIC explains this by showing how much operating profit it makes compared to the money it has raised (debt and equity).
Rush Enterprises’s management team makes decent investment decisions and generates value for shareholders. Its five-year average ROIC was 11.9%, slightly better than typical industrials business.
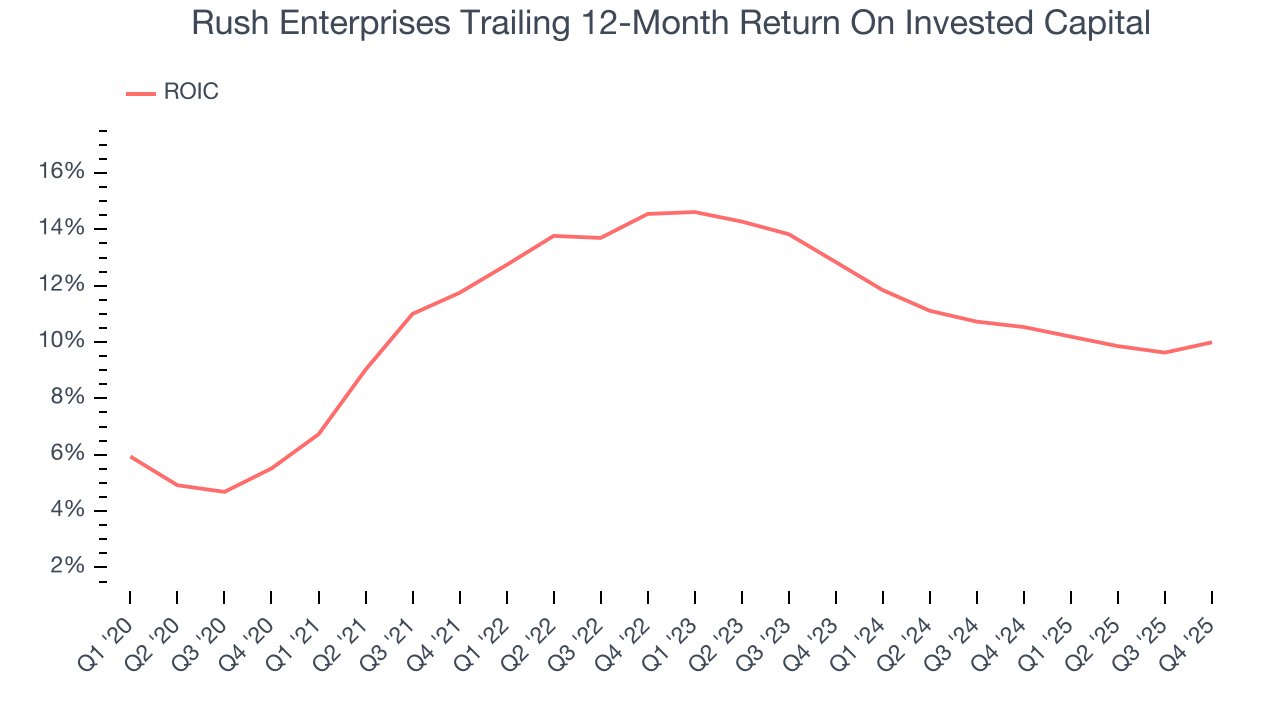
We like to invest in businesses with high returns, but the trend in a company’s ROIC is what often surprises the market and moves the stock price. On average, Rush Enterprises’s ROIC decreased by 2.9 percentage points annually each year over the last few years. We like what management has done in the past, but its declining returns are perhaps a symptom of fewer profitable growth opportunities.
11. Balance Sheet Assessment
Rush Enterprises reported $212.6 million of cash and $524.6 million of debt on its balance sheet in the most recent quarter. As investors in high-quality companies, we primarily focus on two things: 1) that a company’s debt level isn’t too high and 2) that its interest payments are not excessively burdening the business.
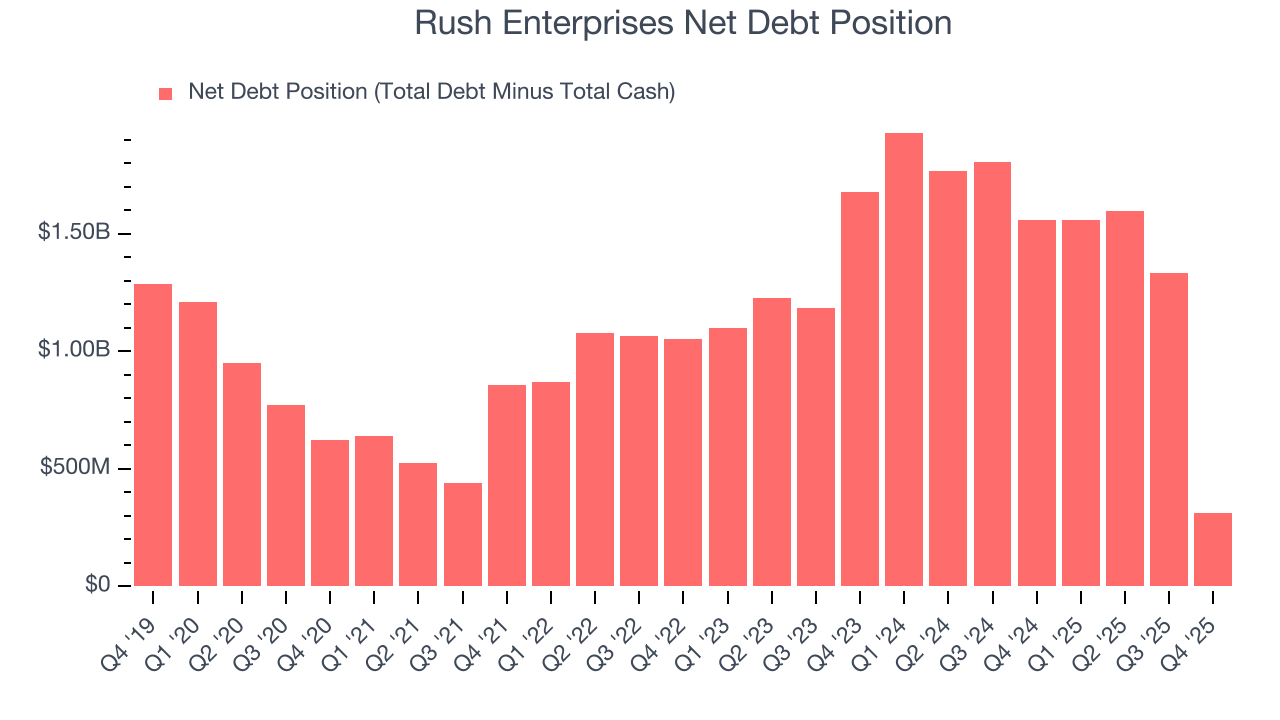
With $625.8 million of EBITDA over the last 12 months, we view Rush Enterprises’s 0.5× net-debt-to-EBITDA ratio as safe. We also see its $28.38 million of annual interest expenses as appropriate. The company’s profits give it plenty of breathing room, allowing it to continue investing in growth initiatives.
12. Key Takeaways from Rush Enterprises’s Q4 Results
We enjoyed seeing Rush Enterprises beat analysts’ revenue expectations this quarter. We were also glad its EPS outperformed Wall Street’s estimates. Overall, this print had some key positives. The stock remained flat at $70.21 immediately after reporting.
13. Is Now The Time To Buy Rush Enterprises?
Updated: March 22, 2026 at 11:31 PM EDT
We think that the latest earnings result is only one piece of the bigger puzzle. If you’re deciding whether to own Rush Enterprises, you should also grasp the company’s longer-term business quality and valuation.
We see the value of companies helping their customers, but in the case of Rush Enterprises, we’re out. Although its revenue growth was solid over the last five years, it’s expected to deteriorate over the next 12 months and its low gross margins indicate some combination of competitive pressures and high production costs. And while the company’s astounding EPS growth over the last five years shows its profits are trickling down to shareholders, the downside is its low free cash flow margins give it little breathing room.
Rush Enterprises’s P/E ratio based on the next 12 months is 17.3x. This valuation is reasonable, but the company’s shaky fundamentals present too much downside risk. There are better investments elsewhere.
Wall Street analysts have a consensus one-year price target of $78.67 on the company (compared to the current share price of $63.80).
Although the price target is bullish, readers should exercise caution because analysts tend to be overly optimistic. The firms they work for, often big banks, have relationships with companies that extend into fundraising, M&A advisory, and other rewarding business lines. As a result, they typically hesitate to say bad things for fear they will lose out. We at StockStory do not suffer from such conflicts of interest, so we’ll always tell it like it is.