
Stitch Fix (SFIX)
We wouldn’t buy Stitch Fix. Not only did its demand evaporate but also its negative returns on capital show it destroyed shareholder value.― StockStory Analyst Team
1. News


2. Summary
Why We Think Stitch Fix Will Underperform
One of the original subscription box companies, Stitch Fix (NASDAQ:SFIX) is an online personal styling and fashion service that curates personalized clothing selections for customers.
- Annual revenue declines of 6% over the last five years indicate problems with its market positioning
- Poor expense management has led to operating margin losses
- Low free cash flow margin gives it little breathing room, constraining its ability to self-fund growth or return capital to shareholders


Stitch Fix doesn’t meet our quality standards. Better businesses are for sale in the market.
Why There Are Better Opportunities Than Stitch Fix


Stitch Fix is trading at $3.29 per share, or 0.3x forward price-to-sales. The market typically values companies like Stitch Fix based on their anticipated profits for the next 12 months, but it expects the business to lose money. We also think the upside isn’t great compared to the potential downside here - there are more exciting stocks to buy.
We’d rather pay a premium for quality. Cheap stocks can look like a great deal at first glance, but they can be value traps. Less earnings power means more reliance on a re-rating to generate good returns; this can be an unlikely scenario for low-quality companies.
3. Stitch Fix (SFIX) Research Report: Q3 CY2025 Update
Personalized clothing company Stitch Fix (NASDAQ:SFIX) reported Q3 CY2025 results exceeding the market’s revenue expectations, with sales up 7.3% year on year to $342.1 million. On top of that, next quarter’s revenue guidance ($337.5 million at the midpoint) was surprisingly good and 9.6% above what analysts were expecting. Its GAAP loss of $0.05 per share was in line with analysts’ consensus estimates.
Stitch Fix (SFIX) Q3 CY2025 Highlights:
- Revenue: $342.1 million vs analyst estimates of $337.2 million (7.3% year-on-year growth, 1.5% beat)
- EPS (GAAP): -$0.05 vs analyst estimates of -$0.04 (in line)
- Adjusted EBITDA: $13.43 million vs analyst estimates of $10.1 million (3.9% margin, 33% beat)
- The company lifted its revenue guidance for the full year to $1.34 billion at the midpoint from $1.31 billion, a 2.3% increase
- EBITDA guidance for the full year is $43 million at the midpoint, above analyst estimates of $36.97 million
- Operating Margin: -2.5%, in line with the same quarter last year
- Free Cash Flow Margin: 1.6%, down from 3.1% in the same quarter last year
- Active Clients: 2.31 million, down 127,000 year on year
- Market Capitalization: $601.3 million
Company Overview
One of the original subscription box companies, Stitch Fix (NASDAQ:SFIX) is an online personal styling and fashion service that curates personalized clothing selections for customers.
The company’s vision is to create a convenient shopping experience that uses data to help people discover and buy clothing that truly suits their style.
Stitch Fix’s unique selling point is its combination of technology and human stylists. Customers fill out detailed online style surveys, and the company’s algorithms and human stylists select clothing items that are a potential match. This apparel, which includes everything from t-shirts to socks, is then shipped to the customer, who can select which items they'd like to purchase and send the rest back.
Stitch Fix operates as a subscription-based personal styling service, generating revenue from subscription fees and the clothing its customers purchase. Consumers who are not subscribed to Stitch Fix can also receive boxes by paying a styling fee to the company.
4. Apparel and Accessories
Thanks to social media and the internet, not only are styles changing more frequently today than in decades past but also consumers are shifting the way they buy their goods, favoring omnichannel and e-commerce experiences. Some apparel and accessories companies have made concerted efforts to adapt while those who are slower to move may fall behind.
Stitch Fix’s competitors are Trunk Club (owned by Nordstrom, NYSE:JWN), Amazon Prime Wardrobe (NASDAQ:AMZN), and private companies Wantable and Le Tote.
5. Revenue Growth
A company’s long-term sales performance is one signal of its overall quality. Any business can have short-term success, but a top-tier one grows for years. Stitch Fix’s demand was weak over the last five years as its sales fell at a 6% annual rate. This wasn’t a great result and is a sign of poor business quality.
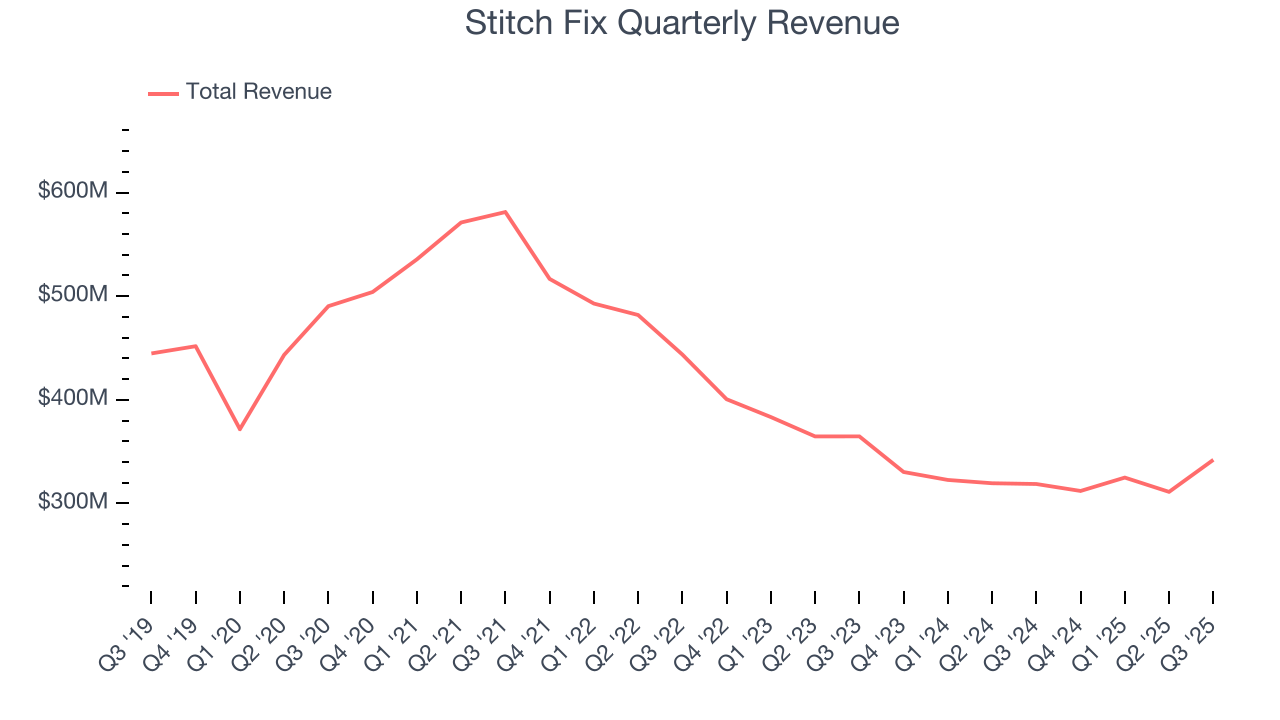
We at StockStory place the most emphasis on long-term growth, but within consumer discretionary, a stretched historical view may miss a company riding a successful new product or trend. Stitch Fix’s recent performance shows its demand remained suppressed as its revenue has declined by 7.7% annually over the last two years. 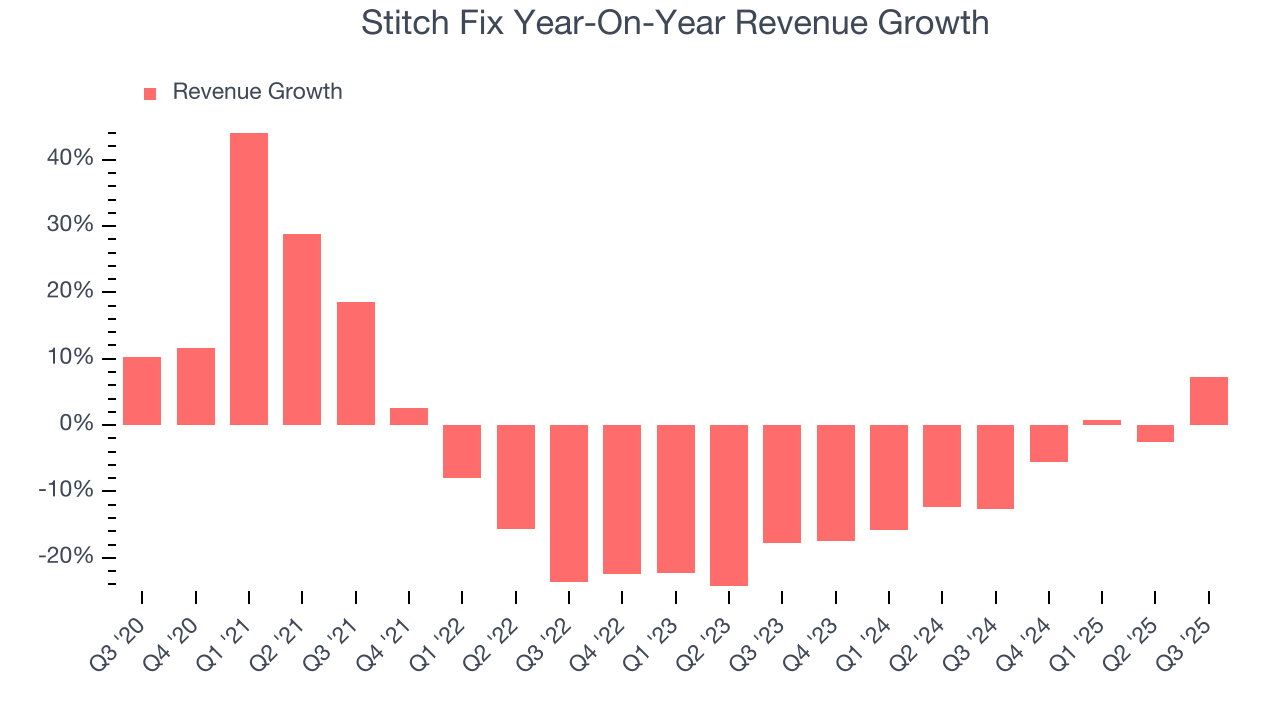
We can better understand the company’s revenue dynamics by analyzing its number of active clients, which reached 2.31 million in the latest quarter. Over the last two years, Stitch Fix’s active clients averaged 14.3% year-on-year declines. Because this number is lower than its revenue growth during the same period, we can see the company’s monetization has risen. 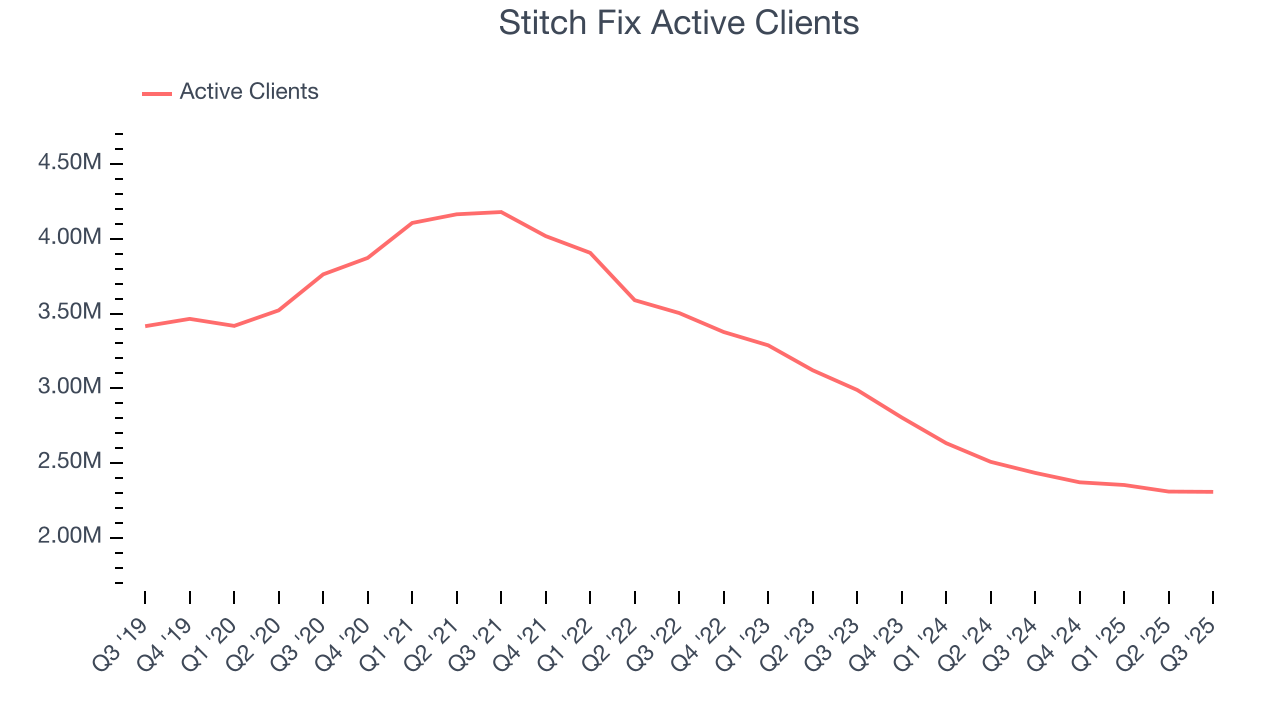
This quarter, Stitch Fix reported year-on-year revenue growth of 7.3%, and its $342.1 million of revenue exceeded Wall Street’s estimates by 1.5%. Company management is currently guiding for a 8.1% year-on-year increase in sales next quarter.
Looking further ahead, sell-side analysts expect revenue to grow 2.4% over the next 12 months. While this projection suggests its newer products and services will fuel better top-line performance, it is still below the sector average.
6. Operating Margin
Stitch Fix’s operating margin has been trending up over the last 12 months, but it still averaged negative 5.9% over the last two years. This is due to its large expense base and inefficient cost structure.
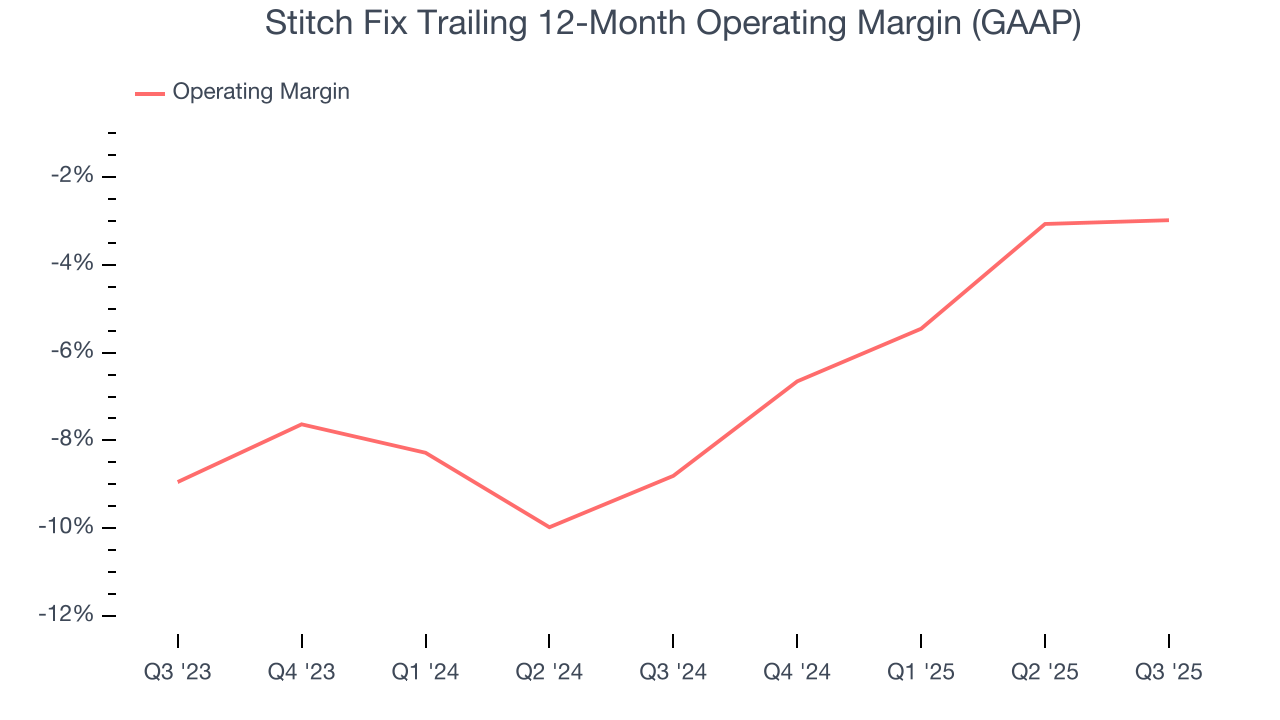
This quarter, Stitch Fix generated a negative 2.5% operating margin. The company's consistent lack of profits raise a flag.
7. Earnings Per Share
Revenue trends explain a company’s historical growth, but the long-term change in earnings per share (EPS) points to the profitability of that growth – for example, a company could inflate its sales through excessive spending on advertising and promotions.
Although Stitch Fix’s full-year earnings are still negative, it reduced its losses and improved its EPS by 16.4% annually over the last five years. The next few quarters will be critical for assessing its long-term profitability.
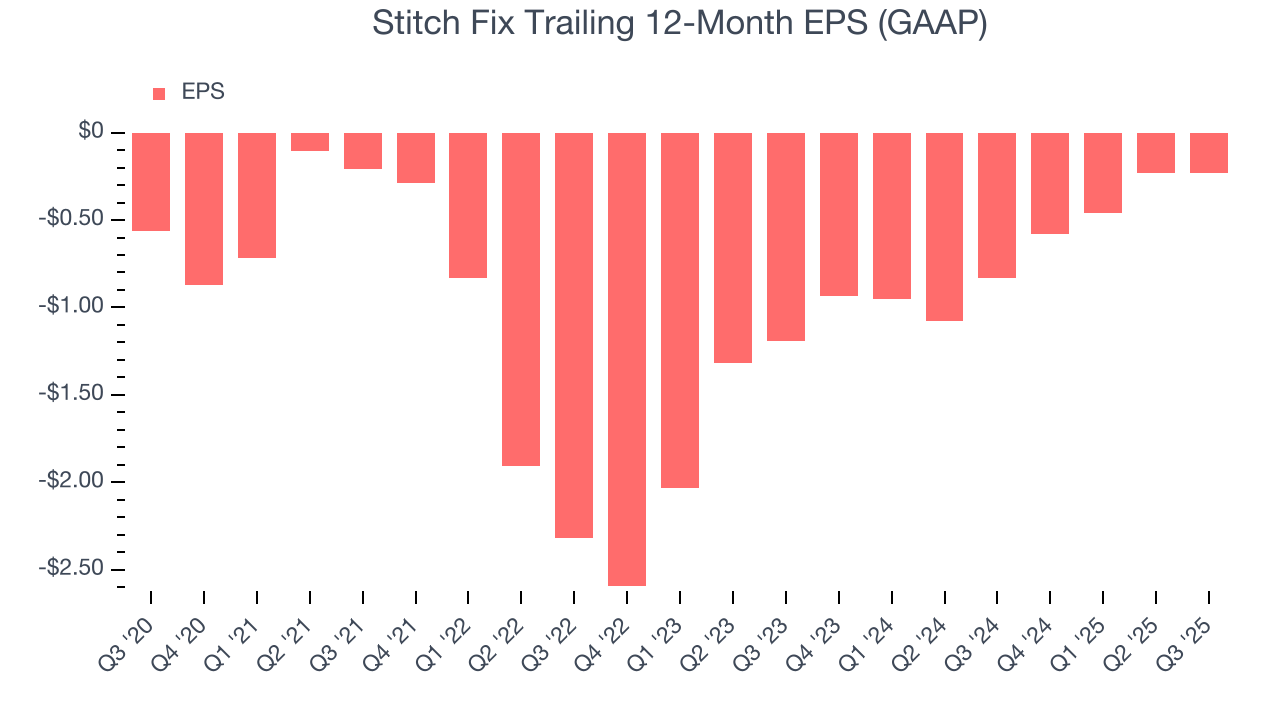
In Q3, Stitch Fix reported EPS of negative $0.05, in line with the same quarter last year. This print missed analysts’ estimates. Over the next 12 months, Wall Street expects Stitch Fix to improve its earnings losses. Analysts forecast its full-year EPS of negative $0.23 will advance to negative $0.17.
8. Cash Is King
Free cash flow isn't a prominently featured metric in company financials and earnings releases, but we think it's telling because it accounts for all operating and capital expenses, making it tough to manipulate. Cash is king.
Stitch Fix broke even from a free cash flow perspective over the last two years, giving the company limited opportunities to return capital to shareholders.
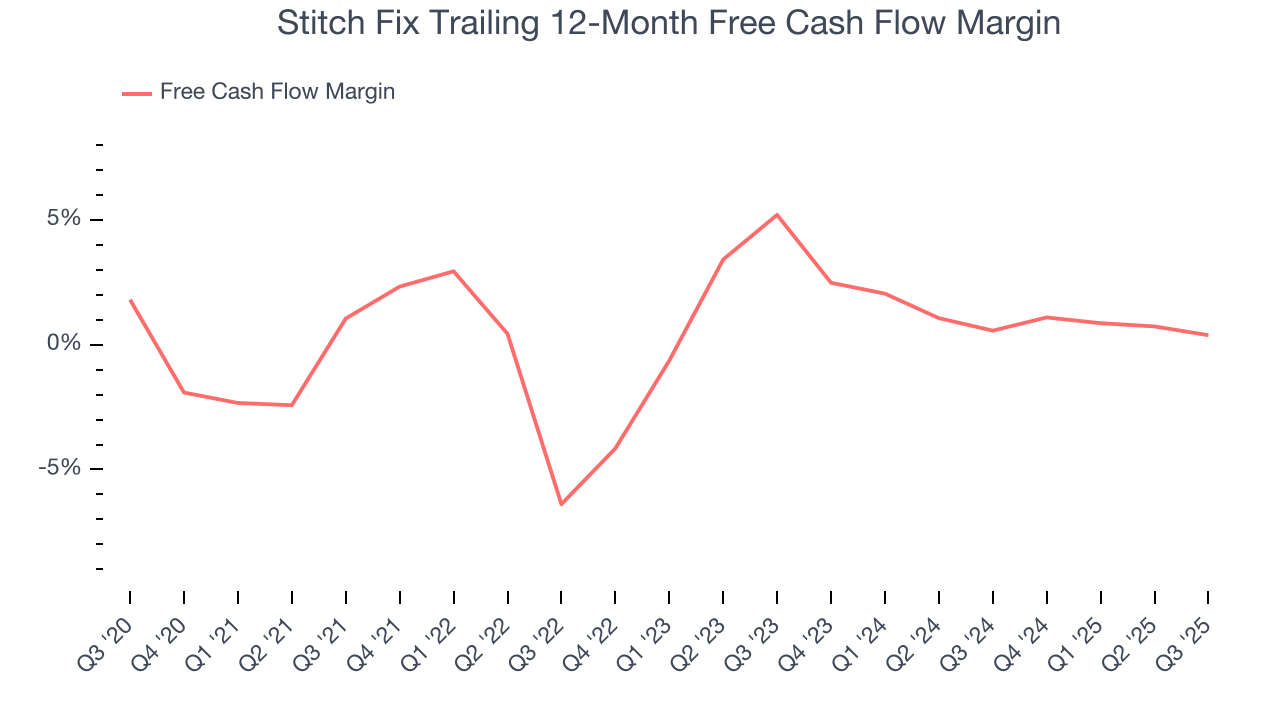
Stitch Fix’s free cash flow clocked in at $5.57 million in Q3, equivalent to a 1.6% margin. The company’s cash profitability regressed as it was 1.5 percentage points lower than in the same quarter last year, but it’s still above its two-year average. We wouldn’t read too much into this quarter’s decline because investment needs can be seasonal, leading to short-term swings. Long-term trends carry greater meaning.
9. Return on Invested Capital (ROIC)
EPS and free cash flow tell us whether a company was profitable while growing its revenue. But was it capital-efficient? A company’s ROIC explains this by showing how much operating profit it makes compared to the money it has raised (debt and equity).
Stitch Fix’s five-year average ROIC was negative 61%, meaning management lost money while trying to expand the business. Its returns were among the worst in the consumer discretionary sector.
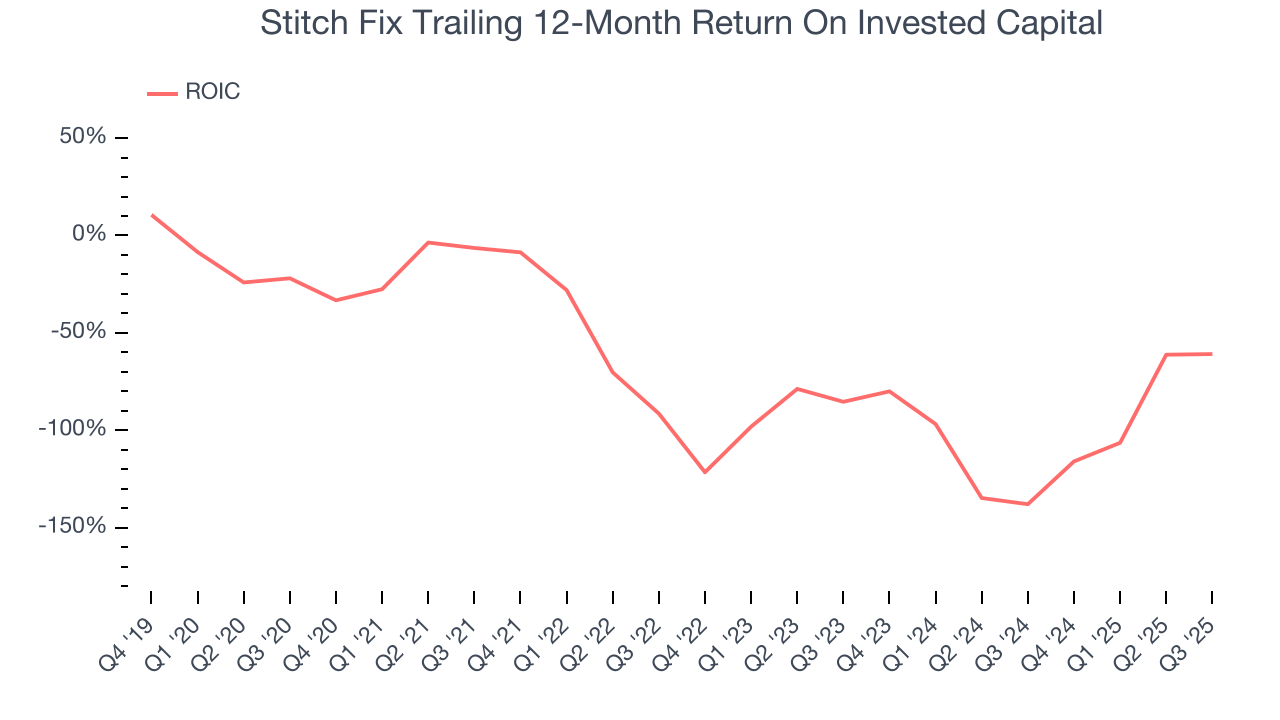
We like to invest in businesses with high returns, but the trend in a company’s ROIC is what often surprises the market and moves the stock price. Unfortunately, Stitch Fix’s ROIC has decreased significantly over the last few years. Paired with its already low returns, these declines suggest its profitable growth opportunities are few and far between.
10. Balance Sheet Assessment
Companies with more cash than debt have lower bankruptcy risk.
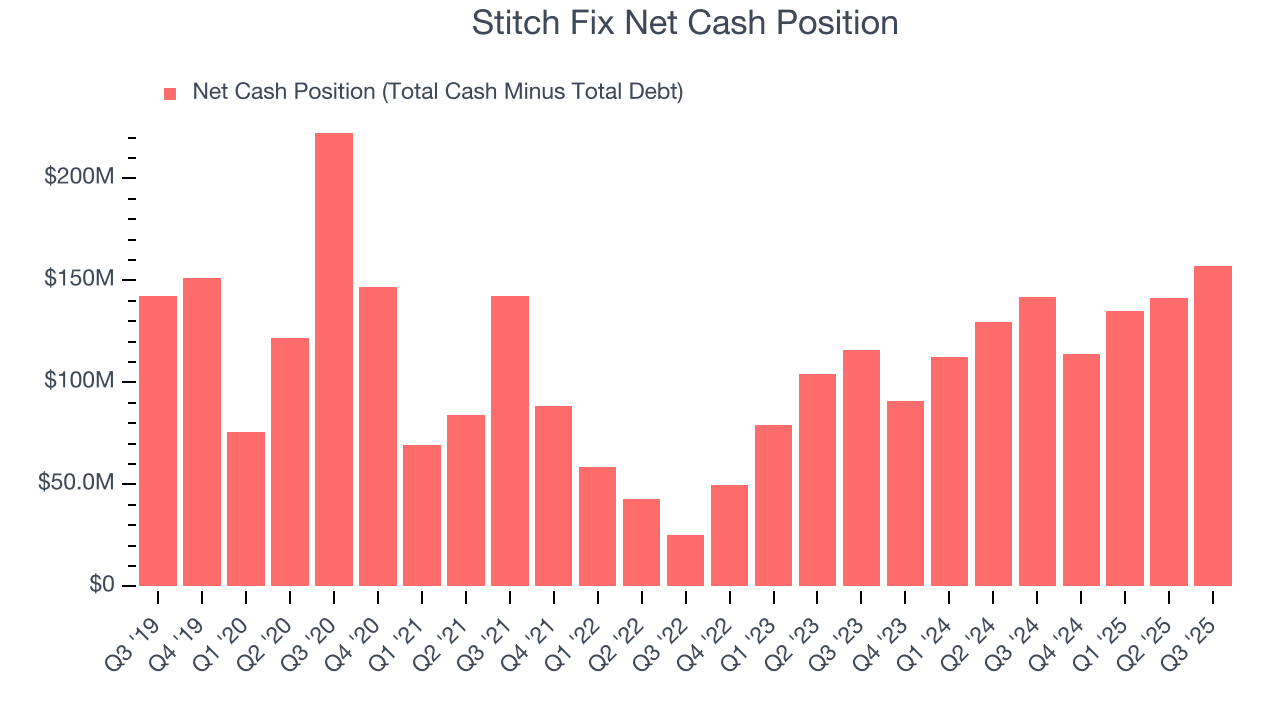
Stitch Fix is a well-capitalized company with $244.2 million of cash and $86.95 million of debt on its balance sheet. This $157.2 million net cash position is 26.1% of its market cap and gives it the freedom to borrow money, return capital to shareholders, or invest in growth initiatives. Leverage is not an issue here.
11. Key Takeaways from Stitch Fix’s Q3 Results
We were impressed by Stitch Fix’s optimistic EBITDA guidance for next quarter, which blew past analysts’ expectations. We were also excited its EBITDA outperformed Wall Street’s estimates by a wide margin. On the other hand, its EPS was in line. Zooming out, we think this was a solid print. The stock traded up 3.3% to $4.77 immediately following the results.
12. Is Now The Time To Buy Stitch Fix?
Updated: March 9, 2026 at 10:28 PM EDT
The latest quarterly earnings matters, sure, but we actually think longer-term fundamentals and valuation matter more. Investors should consider all these pieces before deciding whether or not to invest in Stitch Fix.
We cheer for all companies serving everyday consumers, but in the case of Stitch Fix, we’ll be cheering from the sidelines. On top of that, Stitch Fix’s number of active clients has disappointed, and its relatively low ROIC suggests management has struggled to find compelling investment opportunities.
Stitch Fix’s forward price-to-sales ratio is 0.3x. The market typically values companies like Stitch Fix based on their anticipated profits for the next 12 months, but it expects the business to lose money. We also think the upside isn’t great compared to the potential downside here - there are more exciting stocks to buy.
Wall Street analysts have a consensus one-year price target of $4.75 on the company (compared to the current share price of $3.29).
Although the price target is bullish, readers should exercise caution because analysts tend to be overly optimistic. The firms they work for, often big banks, have relationships with companies that extend into fundraising, M&A advisory, and other rewarding business lines. As a result, they typically hesitate to say bad things for fear they will lose out. We at StockStory do not suffer from such conflicts of interest, so we’ll always tell it like it is.