ABM (ABM)
We’re cautious of ABM. Its weak sales growth and low returns on capital show it struggled to generate demand and profits.― StockStory Analyst Team
1. News


2. Summary
Why We Think ABM Will Underperform
With roots dating back to 1909 as a window washing company, ABM Industries (NYSE:ABM) provides integrated facility management, infrastructure, and mobility solutions across various sectors including commercial, manufacturing, education, and aviation.
- Earnings growth underperformed the sector average over the last five years as its EPS grew by just 2.1% annually
- Poor free cash flow generation means it has few chances to reinvest for growth, repurchase shares, or distribute capital
- On the plus side, its economies of scale give it some operating leverage when demand rises


ABM doesn’t meet our quality standards. There are more promising prospects in the market.
Why There Are Better Opportunities Than ABM


At $41.04 per share, ABM trades at 10.6x forward P/E. This multiple is lower than most business services companies, but for good reason.
Our advice is to pay up for elite businesses whose advantages are tailwinds to earnings growth. Don’t get sucked into lower-quality businesses just because they seem like bargains. These mediocre businesses often never achieve a higher multiple as hoped, a phenomenon known as a “value trap”.
3. ABM (ABM) Research Report: Q4 CY2025 Update
Facility services provider ABM Industries (NYSE:ABM) announced better-than-expected revenue in Q4 CY2025, with sales up 6.1% year on year to $2.24 billion. Its non-GAAP profit of $0.83 per share was 4.8% below analysts’ consensus estimates.
ABM (ABM) Q4 CY2025 Highlights:
- Revenue: $2.24 billion vs analyst estimates of $2.20 billion (6.1% year-on-year growth, 2.1% beat)
- Adjusted EPS: $0.83 vs analyst expectations of $0.87 (4.8% miss)
- Adjusted EBITDA: $117.8 million vs analyst estimates of $126.7 million (5.3% margin, 7% miss)
- Management reiterated its full-year Adjusted EPS guidance of $4 at the midpoint
- Operating Margin: 3.3%, in line with the same quarter last year
- Free Cash Flow was $48.9 million, up from -$122.9 million in the same quarter last year
- Organic Revenue rose 5.5% year on year (beat)
- Market Capitalization: $2.54 billion
Company Overview
With roots dating back to 1909 as a window washing company, ABM Industries (NYSE:ABM) provides integrated facility management, infrastructure, and mobility solutions across various sectors including commercial, manufacturing, education, and aviation.
ABM operates through five distinct business segments, each targeting specific market sectors. The Business & Industry segment delivers janitorial, facilities engineering, and parking services for commercial properties, sports venues, and healthcare facilities. For manufacturing clients, ABM handles specialized facility services tailored to production environments and data centers. Its Education segment maintains school and university campuses with custodial, landscaping, and facilities management services.
The Aviation segment supports airlines and airports with a range of services from passenger assistance to cabin maintenance and transportation logistics. Meanwhile, the Technical Solutions segment focuses on infrastructure projects including electrical services, EV charging station installation, and microgrid systems design.
A typical ABM client might be a large corporate office complex that contracts the company to handle all facility maintenance, from daily cleaning to HVAC system management, allowing the client to focus on their core business rather than building operations. A university might rely on ABM to maintain grounds, clean buildings, and manage parking operations across an entire campus.
The company generates revenue primarily through monthly fixed-price contracts, square-foot pricing arrangements, cost-plus models, and transaction-based services. These contracts are typically secured through competitive bidding processes and can range from basic janitorial services to comprehensive facility management solutions.
ABM enhances its service offerings with proprietary programs like ABM EnhancedClean and ABM EnhancedFacility, which provide standardized approaches to cleaning and maintenance. The company has also expanded its technological capabilities through acquisitions, such as Quality Uptime Services, which strengthened its position in critical power infrastructure maintenance for data centers.
4. Industrial & Environmental Services
Growing regulatory pressure on environmental compliance and increasing corporate ESG commitments should buoy the sector for years to come. On the other hand, environmental regulations continue to evolve, and this may require costly upgrades, volatility in commodity waste and recycling markets, and labor shortages in industrial services. As for digitization, a theme that is impacting nearly every industry, the increasing use of data, analytics, and automation will give rise to improved efficiency of operations. Conversely, though, the benefits of digitization also come with challenges of integrating new technologies into legacy systems.
ABM Industries competes with other facility services providers such as Aramark (NYSE:ARMK), Sodexo (OTC:SDXAY), ISS A/S (CPH:ISS), and EMCOR Group (NYSE:EME), as well as numerous regional and specialized service providers in each of its business segments.
5. Revenue Growth
A company’s long-term performance is an indicator of its overall quality. Any business can put up a good quarter or two, but the best consistently grow over the long haul.
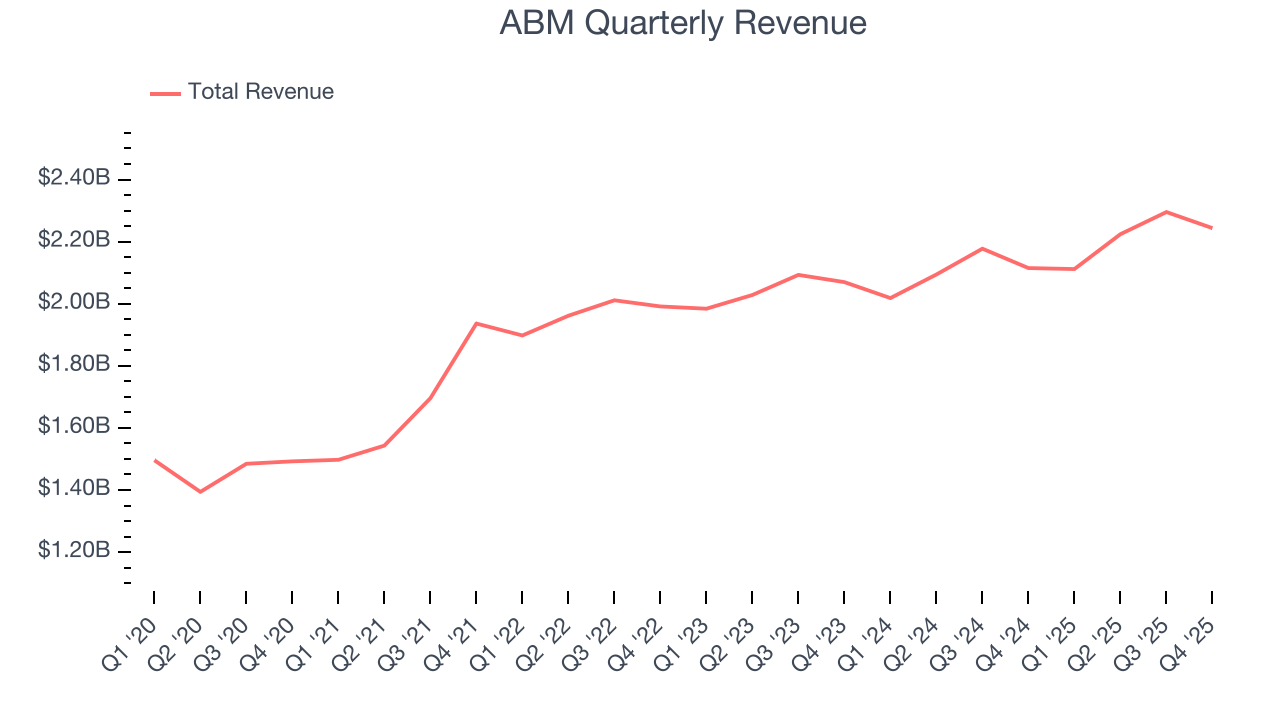
With $8.87 billion in revenue over the past 12 months, ABM is one of the larger companies in the business services industry and benefits from a well-known brand that influences purchasing decisions.
As you can see below, ABM’s sales grew at a solid 8.6% compounded annual growth rate over the last five years. This shows it had high demand, a useful starting point for our analysis.
Long-term growth is the most important, but within business services, a half-decade historical view may miss new innovations or demand cycles. ABM’s recent performance shows its demand has slowed as its annualized revenue growth of 4.2% over the last two years was below its five-year trend. We’re wary when companies in the sector see decelerations in revenue growth, as it could signal changing consumer tastes aided by low switching costs. 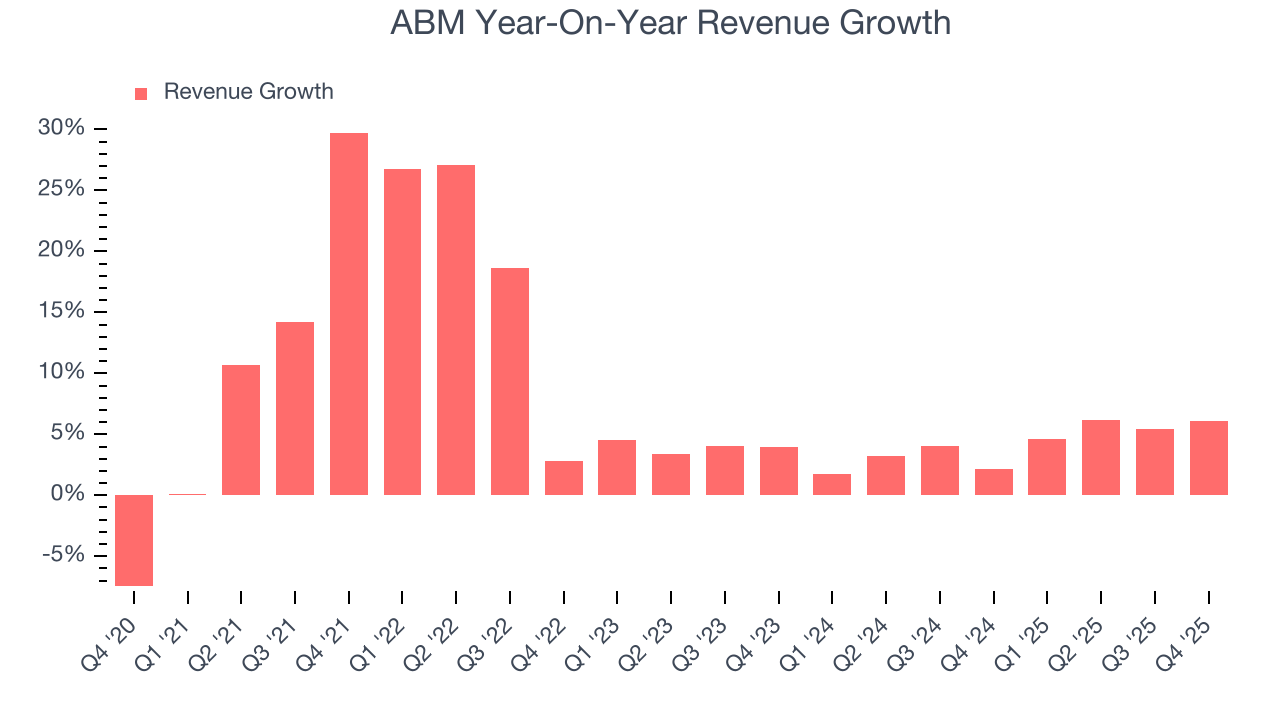
ABM also reports organic revenue, which strips out one-time events like acquisitions and currency fluctuations that don’t accurately reflect its fundamentals. Over the last two years, ABM’s organic revenue averaged 3.6% year-on-year growth. Because this number aligns with its two-year revenue growth, we can see the company’s core operations (not acquisitions and divestitures) drove most of its results. 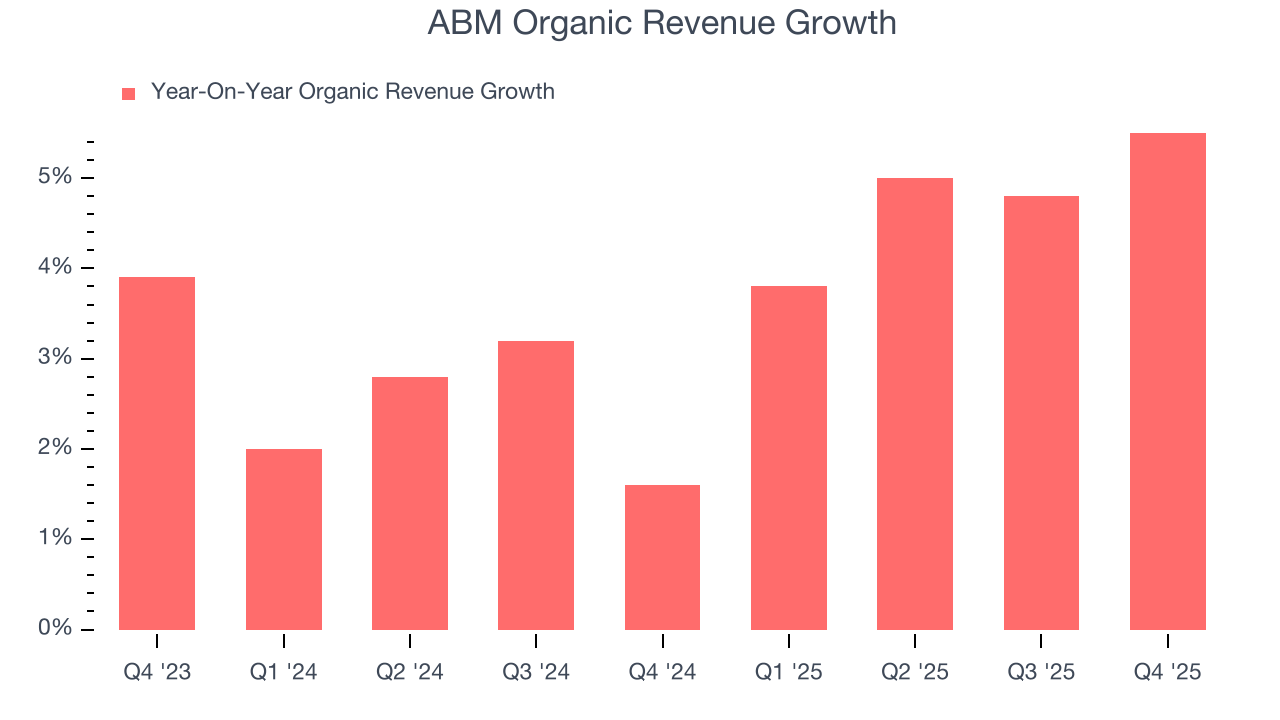
This quarter, ABM reported year-on-year revenue growth of 6.1%, and its $2.24 billion of revenue exceeded Wall Street’s estimates by 2.1%.
Looking ahead, sell-side analysts expect revenue to grow 4.5% over the next 12 months, similar to its two-year rate. This projection is underwhelming and implies its newer products and services will not catalyze better top-line performance yet.
6. Operating Margin
ABM’s operating margin has more or less stayed the same over the last 12 months , averaging 3.6% over the last five years. This profitability was lousy for a business services business and caused by its suboptimal cost structure.
Looking at the trend in its profitability, ABM’s operating margin might fluctuated slightly but has generally stayed the same over the last five years. This raises questions about the company’s expense base because its revenue growth should have given it leverage on its fixed costs, resulting in better economies of scale and profitability.
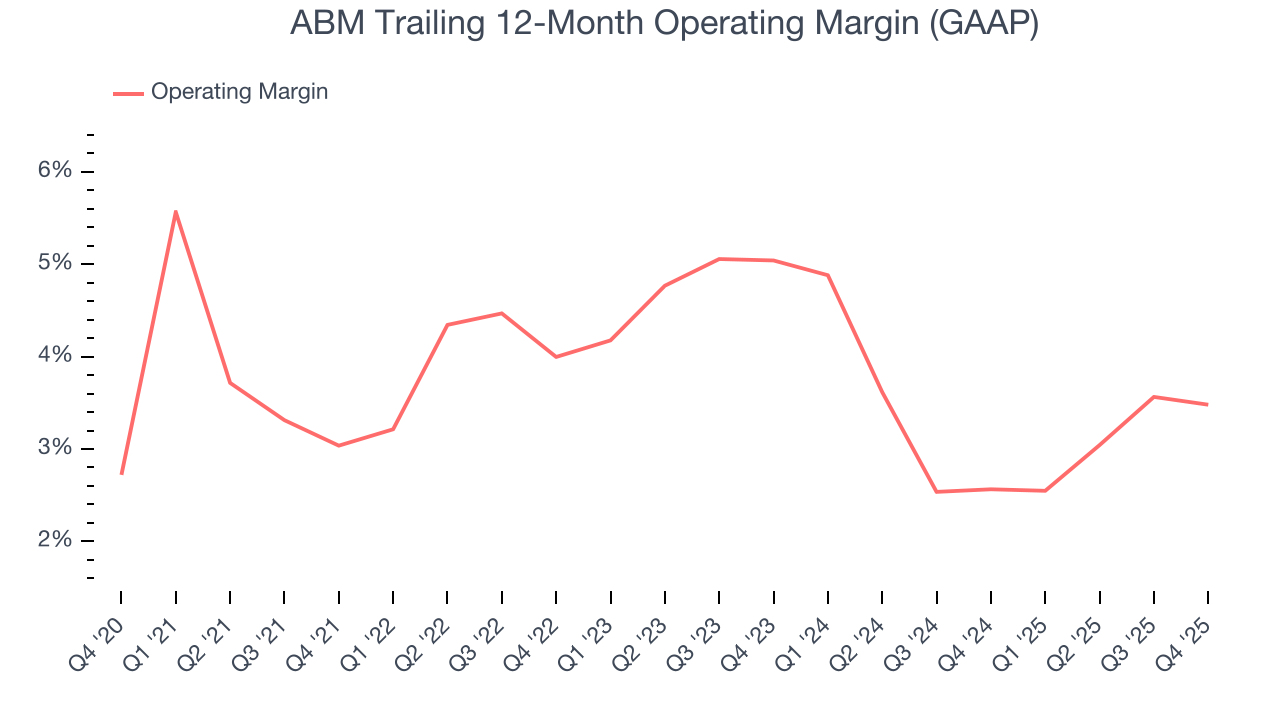
In Q4, ABM generated an operating margin profit margin of 3.3%, in line with the same quarter last year. This indicates the company’s overall cost structure has been relatively stable.
7. Earnings Per Share
We track the long-term change in earnings per share (EPS) for the same reason as long-term revenue growth. Compared to revenue, however, EPS highlights whether a company’s growth is profitable.
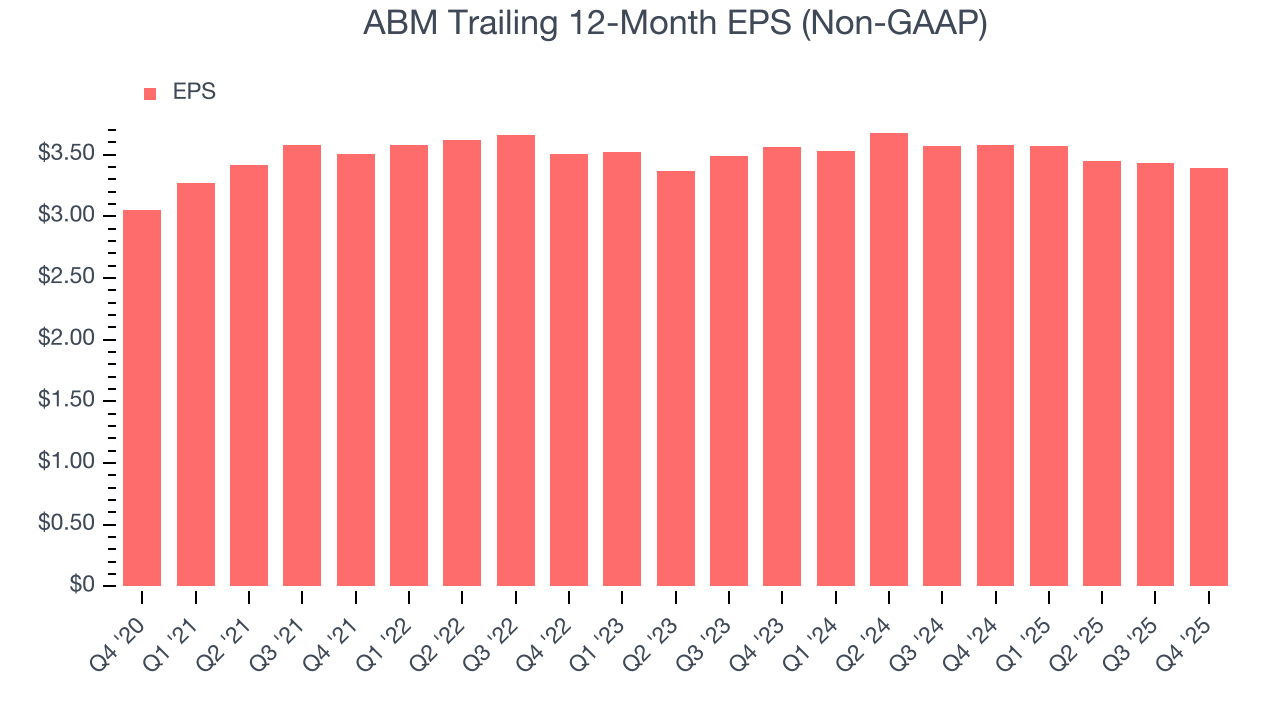
ABM’s EPS grew at a weak 2.1% compounded annual growth rate over the last five years, lower than its 8.6% annualized revenue growth. However, its operating margin didn’t change during this time, telling us that non-fundamental factors such as interest and taxes affected its ultimate earnings.
Like with revenue, we analyze EPS over a shorter period to see if we are missing a change in the business.
For ABM, its two-year annual EPS declines of 2.4% show it’s continued to underperform. These results were bad no matter how you slice the data.
In Q4, ABM reported adjusted EPS of $0.83, down from $0.87 in the same quarter last year. This print missed analysts’ estimates. Over the next 12 months, Wall Street expects ABM’s full-year EPS of $3.39 to grow 20%.
8. Cash Is King
Although earnings are undoubtedly valuable for assessing company performance, we believe cash is king because you can’t use accounting profits to pay the bills.
ABM has shown poor cash profitability relative to peers over the last five years, giving the company fewer opportunities to return capital to shareholders. Its free cash flow margin averaged 1.9%, below what we’d expect for a business services business.
Taking a step back, an encouraging sign is that ABM’s margin expanded by 1.6 percentage points during that time. The company’s improvement shows it’s heading in the right direction, and we can see it became a less capital-intensive business because its free cash flow profitability rose while its operating profitability was flat.
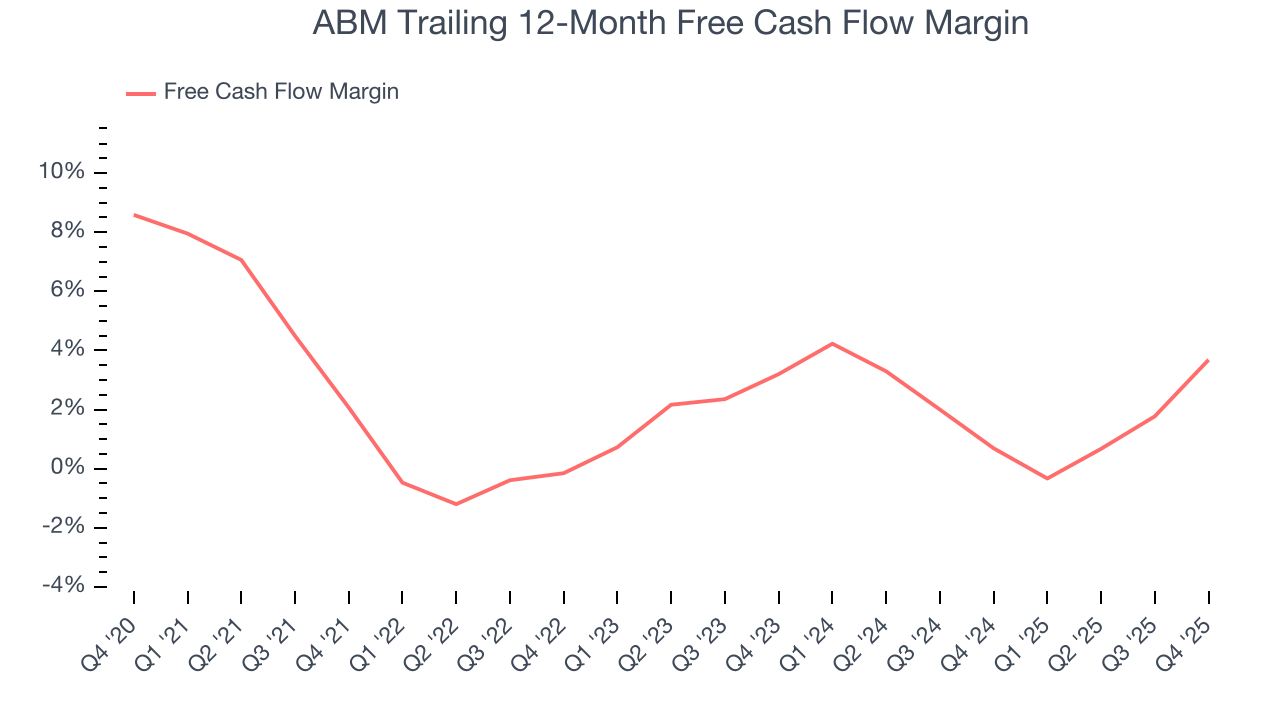
ABM’s free cash flow clocked in at $48.9 million in Q4, equivalent to a 2.2% margin. Its cash flow turned positive after being negative in the same quarter last year, building on its favorable historical trend.
9. Return on Invested Capital (ROIC)
EPS and free cash flow tell us whether a company was profitable while growing its revenue. But was it capital-efficient? A company’s ROIC explains this by showing how much operating profit it makes compared to the money it has raised (debt and equity).
ABM historically did a mediocre job investing in profitable growth initiatives. Its five-year average ROIC was 8%, somewhat low compared to the best business services companies that consistently pump out 25%+.
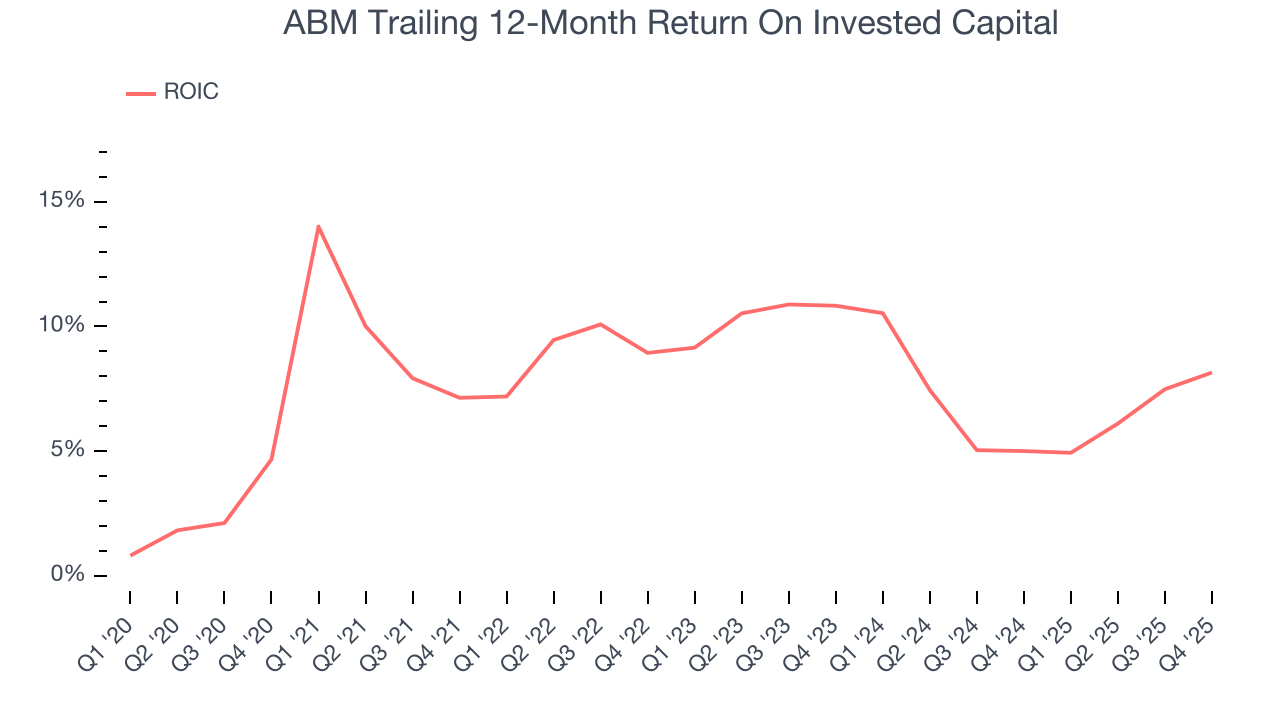
We like to invest in businesses with high returns, but the trend in a company’s ROIC is what often surprises the market and moves the stock price. Unfortunately, ABM’s ROIC averaged 1.5 percentage point decreases each year over the last few years. Paired with its already low returns, these declines suggest its profitable growth opportunities are few and far between.
10. Balance Sheet Assessment
ABM reported $100.4 million of cash and $1.74 billion of debt on its balance sheet in the most recent quarter. As investors in high-quality companies, we primarily focus on two things: 1) that a company’s debt level isn’t too high and 2) that its interest payments are not excessively burdening the business.
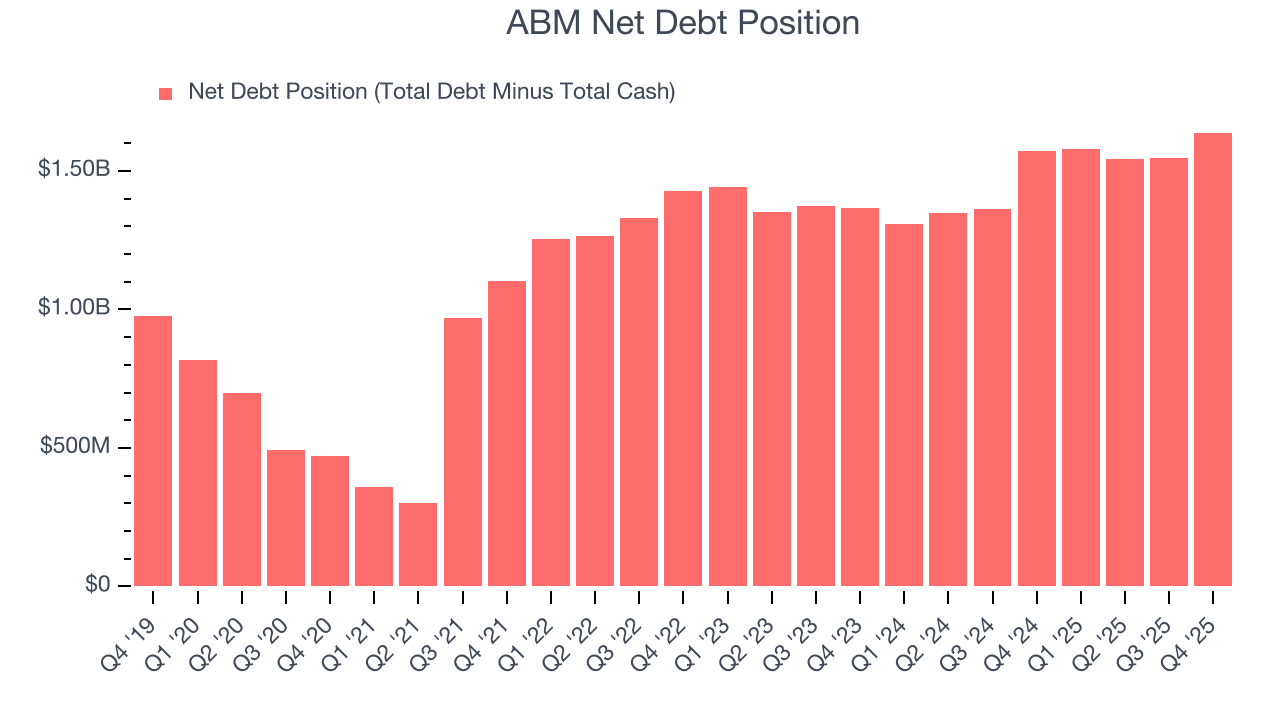
With $493.7 million of EBITDA over the last 12 months, we view ABM’s 3.3× net-debt-to-EBITDA ratio as safe. We also see its $49.5 million of annual interest expenses as appropriate. The company’s profits give it plenty of breathing room, allowing it to continue investing in growth initiatives.
11. Key Takeaways from ABM’s Q4 Results
We enjoyed seeing ABM beat analysts’ organic revenue expectations this quarter. We were also happy its revenue outperformed Wall Street’s estimates. On the other hand, its EPS missed. Overall, this was a mixed quarter. The stock traded up 2.4% to $44.34 immediately following the results.
12. Is Now The Time To Buy ABM?
Updated: March 10, 2026 at 11:42 PM EDT
Before investing in or passing on ABM, we urge you to understand the company’s business quality (or lack thereof), valuation, and the latest quarterly results - in that order.
ABM’s business quality ultimately falls short of our standards. Although its revenue growth was solid over the last five years, it’s expected to deteriorate over the next 12 months and its weak EPS growth over the last five years shows it’s failed to produce meaningful profits for shareholders. And while the company’s projected EPS for the next year implies the company’s fundamentals will improve, the downside is its low free cash flow margins give it little breathing room.
ABM’s P/E ratio based on the next 12 months is 10.6x. This valuation is reasonable, but the company’s shakier fundamentals present too much downside risk. We're pretty confident there are superior stocks to buy right now.
Wall Street analysts have a consensus one-year price target of $54.33 on the company (compared to the current share price of $41.04).
Although the price target is bullish, readers should exercise caution because analysts tend to be overly optimistic. The firms they work for, often big banks, have relationships with companies that extend into fundraising, M&A advisory, and other rewarding business lines. As a result, they typically hesitate to say bad things for fear they will lose out. We at StockStory do not suffer from such conflicts of interest, so we’ll always tell it like it is.