Best Buy (BBY)
We wouldn’t recommend Best Buy. Its plummeting sales and returns on capital show its profits are shrinking as demand fizzles out.― StockStory Analyst Team
1. News


2. Summary
Why We Think Best Buy Will Underperform
With humble beginnings as a stereo equipment seller, Best Buy (NYSE:BBY) now sells a broad selection of consumer electronics, appliances, and home office products.
- Commoditized inventory, bad unit economics, and high competition are reflected in its low gross margin of 22.5%
- Operating margin falls short of the industry average, and the smaller profit dollars make it harder to react to unexpected market developments
- Recent store closures and weak same-store sales point to soft demand and an operational restructuring


Best Buy’s quality is insufficient. There are more promising alternatives.
Why There Are Better Opportunities Than Best Buy


Best Buy’s stock price of $66.66 implies a valuation ratio of 10.2x forward P/E. While valuation is appropriate for the quality you get, we’re still on the sidelines for now.
There are stocks out there similarly priced with better business quality. We prefer owning these.
3. Best Buy (BBY) Research Report: Q3 CY2025 Update
Electronics retailer Best Buy (NYSE:BBY) reported Q3 CY2025 results exceeding the market’s revenue expectations, with sales up 2.4% year on year to $9.67 billion. The company expects the full year’s revenue to be around $41.8 billion, close to analysts’ estimates. Its non-GAAP profit of $1.40 per share was 6.7% above analysts’ consensus estimates.
Best Buy (BBY) Q3 CY2025 Highlights:
- Revenue: $9.67 billion vs analyst estimates of $9.58 billion (2.4% year-on-year growth, 1% beat)
- Adjusted EPS: $1.40 vs analyst estimates of $1.31 (6.7% beat)
- The company slightly lifted its revenue guidance for the full year to $41.8 billion at the midpoint from $41.5 billion
- Management raised its full-year Adjusted EPS guidance to $6.30 at the midpoint, a 1.2% increase
- Operating Margin: 2%, down from 3.7% in the same quarter last year
- Free Cash Flow was -$287 million compared to -$449 million in the same quarter last year
- Same-Store Sales rose 2.7% year on year (-2.9% in the same quarter last year)
- Market Capitalization: $15.89 billion
Company Overview
With humble beginnings as a stereo equipment seller, Best Buy (NYSE:BBY) now sells a broad selection of consumer electronics, appliances, and home office products.
Whether you need a new gaming headset, a speaker for your home audio system, or a blender for making smoothies, Best Buy has you covered. The company can serve the tech savvy consumer, who appreciates Best Buy’s selection and competitive pricing. Best Buy can also serve the electronics novice providing expert service and advice through its knowledgeable sales associates, who can recommend products and help with technical support and installation. These sales associates, famously known as the ‘Geek Squad’, are one key way the company can compete effectively with larger competitors.
The size of an average Best Buy store is around 40,000 square feet and is typically located in high-traffic areas, such as shopping centers and malls. The stores are typically organized by product categories such as TVs, laptops and computers, home theater/audio, and home appliances among others. The mid-sized footprint, straightforward layout, and displays allow those who know what they want to easily find it but also encourage discovery among those who may be browsing. Best Buy has an e-commerce presence, launched in 1998, that allows customers to purchase products for home delivery or to pick up in-store.
4. Electronics & Gaming Retailer
After a long day, some of us want to just watch TV, play video games, listen to music, or scroll through our phones; electronics and gaming retailers sell the technology that makes this possible, plus more. Shoppers can find everything from surround-sound speakers to gaming controllers to home appliances in their stores. Competitive prices and helpful store associates that can talk through topics like the latest technology in gaming and installation keep customers coming back. This is a category that has moved rapidly online over the last few decades, so these electronics and gaming retailers have needed to be nimble and aggressive with their e-commerce and omnichannel investments.
Retailers offering consumer electronics and home appliances include Walmart (NYSE:WMT), Target (NYSE:TGT), and Amazon.com (NASDAQ:AMZN).
5. Revenue Growth
A company’s long-term sales performance can indicate its overall quality. Any business can put up a good quarter or two, but the best consistently grow over the long haul.
With $41.83 billion in revenue over the past 12 months, Best Buy is larger than most consumer retail companies and benefits from economies of scale, enabling it to gain more leverage on its fixed costs than smaller competitors. This also gives it the flexibility to offer lower prices. However, its scale is a double-edged sword because it’s harder to find incremental growth when you’ve penetrated most of the market. To expand meaningfully, Best Buy likely needs to tweak its prices or enter new markets.
As you can see below, Best Buy’s revenue declined by 4.4% per year over the last three years (we compare to 2019 to normalize for COVID-19 impacts) as it didn’t open many new stores and observed lower sales at existing, established locations.

This quarter, Best Buy reported modest year-on-year revenue growth of 2.4% but beat Wall Street’s estimates by 1%.
Looking ahead, sell-side analysts expect revenue to remain flat over the next 12 months. Although this projection indicates its newer products will fuel better top-line performance, it is still below the sector average.
6. Store Performance
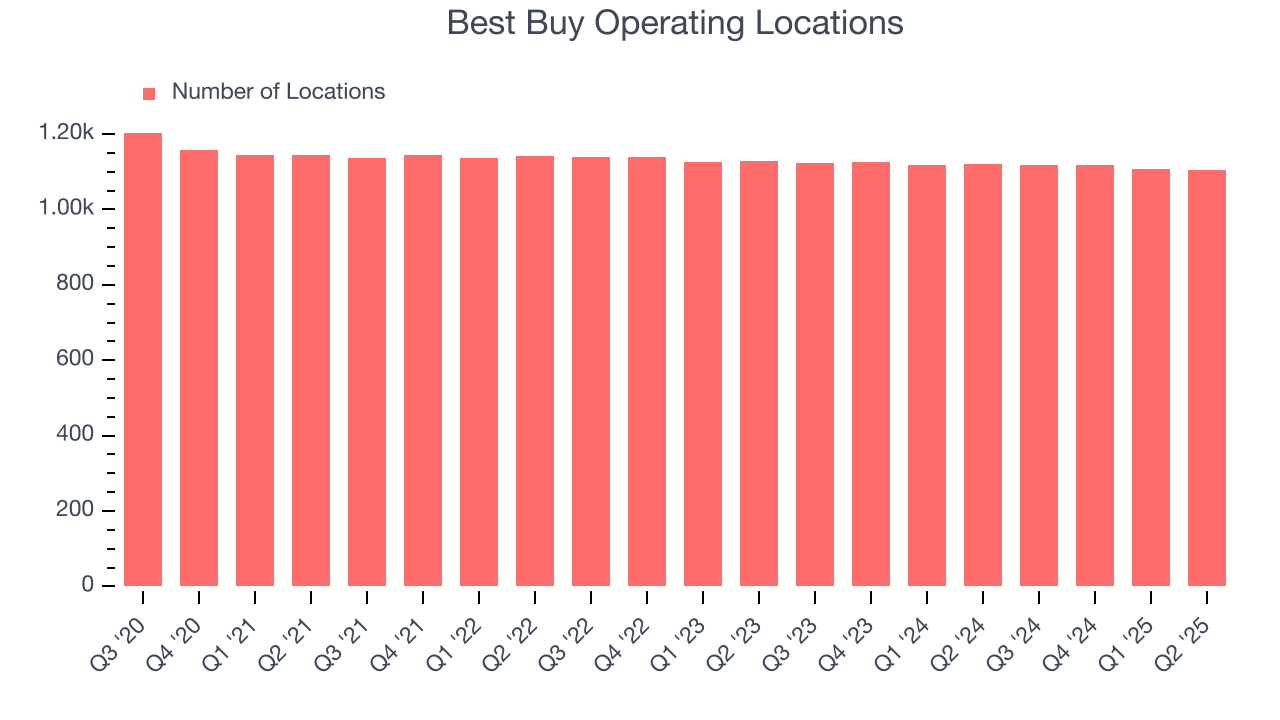
Number of Stores
A retailer’s store count often determines how much revenue it can generate.
Over the last two years, Best Buy has kept its store count flat while other consumer retail businesses have opted for growth.
When a retailer keeps its store footprint steady, it usually means demand is stable and it’s focusing on operational efficiency to increase profitability.
Note that Best Buy reports its store count intermittently, so some data points are missing in the chart below.
Same-Store Sales
A company's store base only paints one part of the picture. When demand is high, it makes sense to open more. But when demand is low, it’s prudent to close some locations and use the money in other ways. Same-store sales provides a deeper understanding of this issue because it measures organic growth at brick-and-mortar shops for at least a year.
Best Buy’s demand has been shrinking over the last two years as its same-store sales have averaged 1.5% annual declines. This performance isn’t ideal, and we’d be concerned if Best Buy starts opening new stores to artificially boost revenue growth.

In the latest quarter, Best Buy’s same-store sales rose 2.7% year on year. This growth was a well-appreciated turnaround from its historical levels, showing the business is regaining momentum.
7. Gross Margin & Pricing Power
Best Buy has bad unit economics for a retailer, signaling it operates in a competitive market and lacks pricing power because its inventory is sold in many places. As you can see below, it averaged a 22.5% gross margin over the last two years. Said differently, Best Buy had to pay a chunky $77.54 to its suppliers for every $100 in revenue. 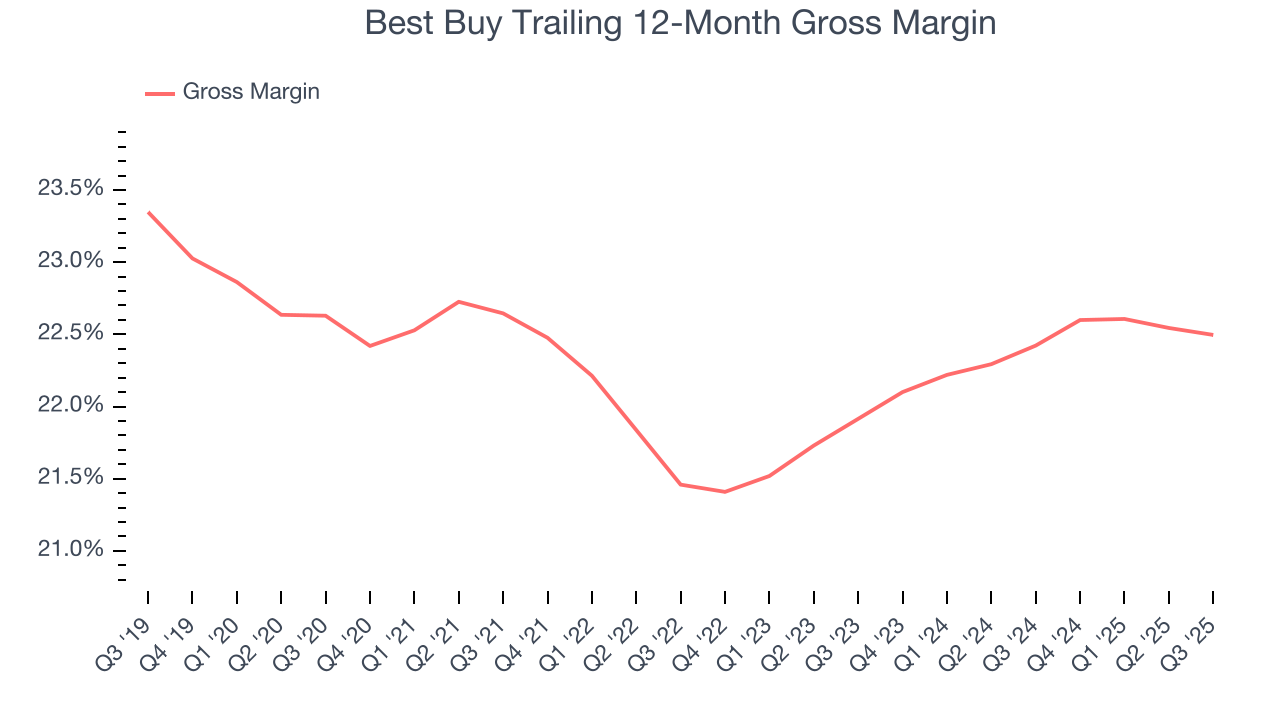
Best Buy’s gross profit margin came in at 23.2% this quarter, in line with the same quarter last year. Zooming out, the company’s full-year margin has remained steady over the past 12 months, suggesting it strives to keep prices low for customers and has stable input costs (such as labor and freight expenses to transport goods).
8. Operating Margin
Operating margin is a key measure of profitability. Think of it as net income - the bottom line - excluding the impact of taxes and interest on debt, which are less connected to business fundamentals.
Best Buy was profitable over the last two years but held back by its large cost base. Its average operating margin of 3% was weak for a consumer retail business. This result isn’t too surprising given its low gross margin as a starting point.
Looking at the trend in its profitability, Best Buy’s operating margin decreased by 1.7 percentage points over the last year. Best Buy’s performance was poor no matter how you look at it - it shows that costs were rising and it couldn’t pass them onto its customers.
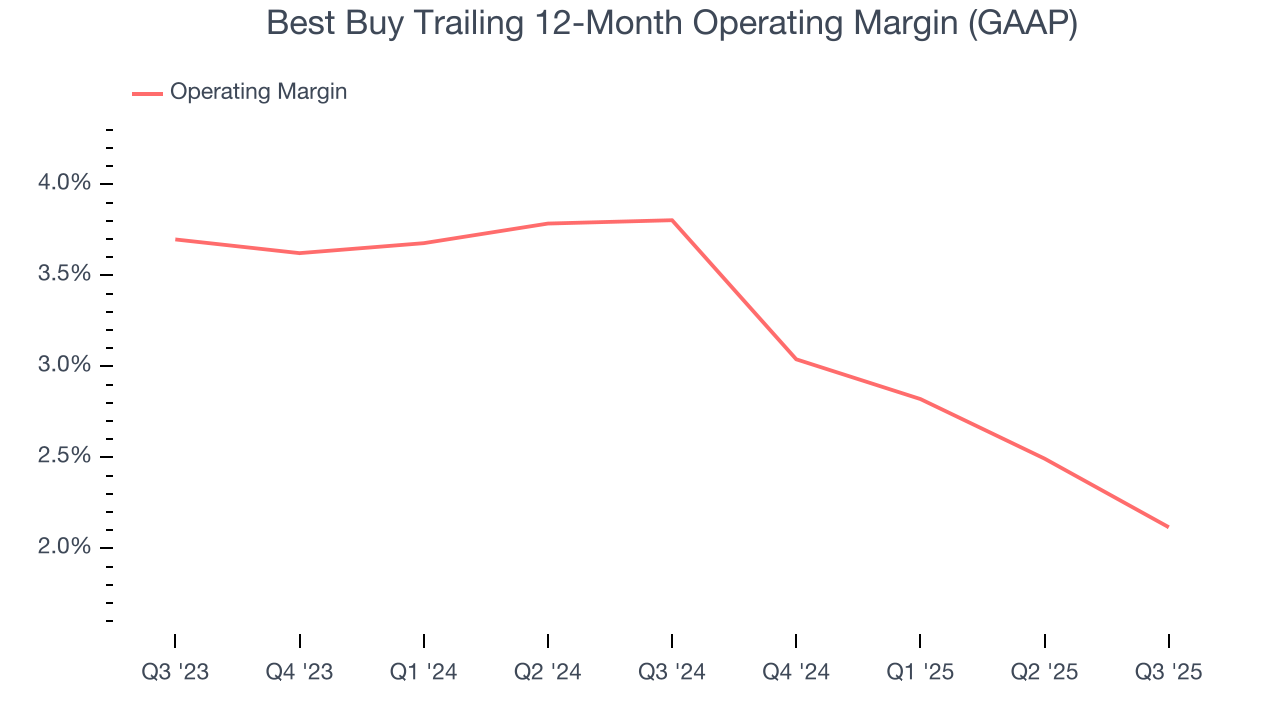
This quarter, Best Buy generated an operating margin profit margin of 2%, down 1.7 percentage points year on year. Since Best Buy’s operating margin decreased more than its gross margin, we can assume it was less efficient because expenses such as marketing, and administrative overhead increased.
9. Cash Is King
Although earnings are undoubtedly valuable for assessing company performance, we believe cash is king because you can’t use accounting profits to pay the bills.
Best Buy has shown decent cash profitability, giving it some flexibility to reinvest or return capital to investors. The company’s free cash flow margin averaged 3% over the last two years, slightly better than the broader consumer retail sector.
Taking a step back, we can see that Best Buy’s margin expanded by 1.2 percentage points over the last year. This shows the company is heading in the right direction, and we can see it became a less capital-intensive business because its free cash flow profitability rose while its operating profitability fell.
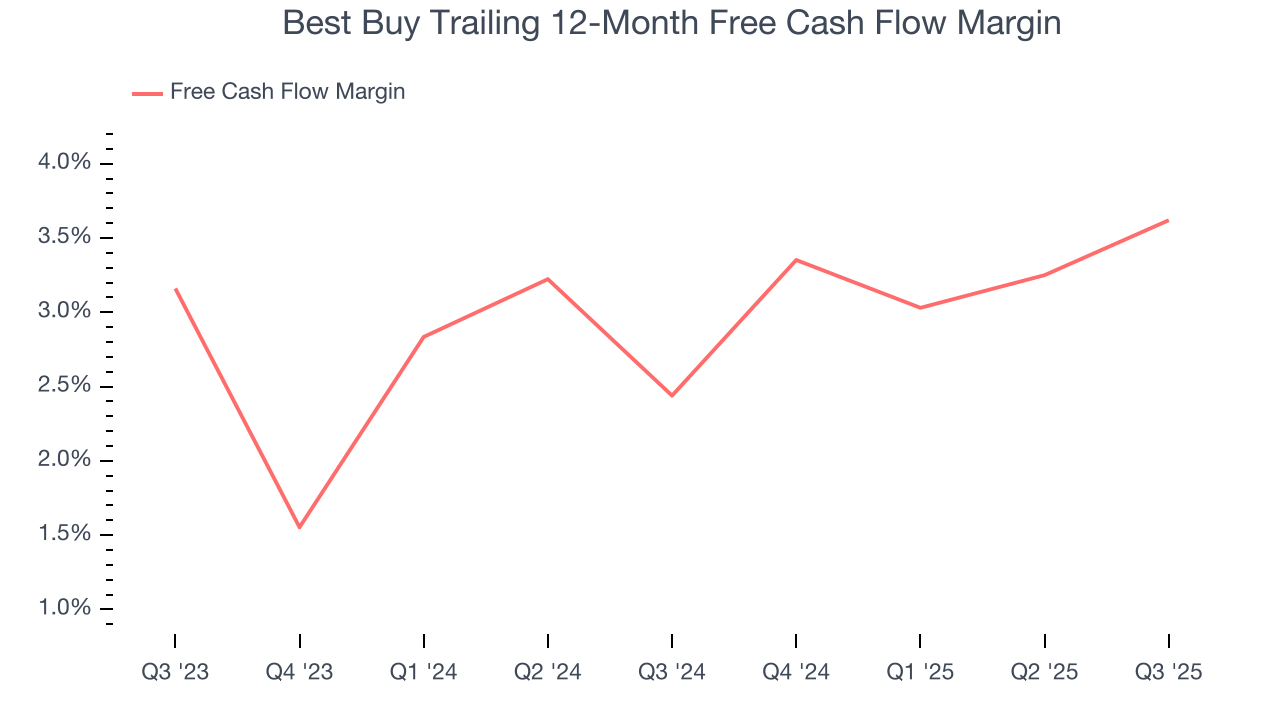
Best Buy burned through $287 million of cash in Q3, equivalent to a negative 3% margin. The company’s cash burn slowed from $449 million of lost cash in the same quarter last year. These numbers deviate from its longer-term margin, indicating it is a seasonal business that must build up inventory during certain quarters.
10. Return on Invested Capital (ROIC)
EPS and free cash flow tell us whether a company was profitable while growing its revenue. But was it capital-efficient? A company’s ROIC explains this by showing how much operating profit it makes compared to the money it has raised (debt and equity).
Although Best Buy hasn’t been the highest-quality company lately because of its poor top-line performance, it found a few growth initiatives in the past that worked out wonderfully. Its five-year average ROIC was 29.2%, splendid for a consumer retail business.
11. Balance Sheet Assessment
Best Buy reported $923 million of cash and $4.09 billion of debt on its balance sheet in the most recent quarter. As investors in high-quality companies, we primarily focus on two things: 1) that a company’s debt level isn’t too high and 2) that its interest payments are not excessively burdening the business.
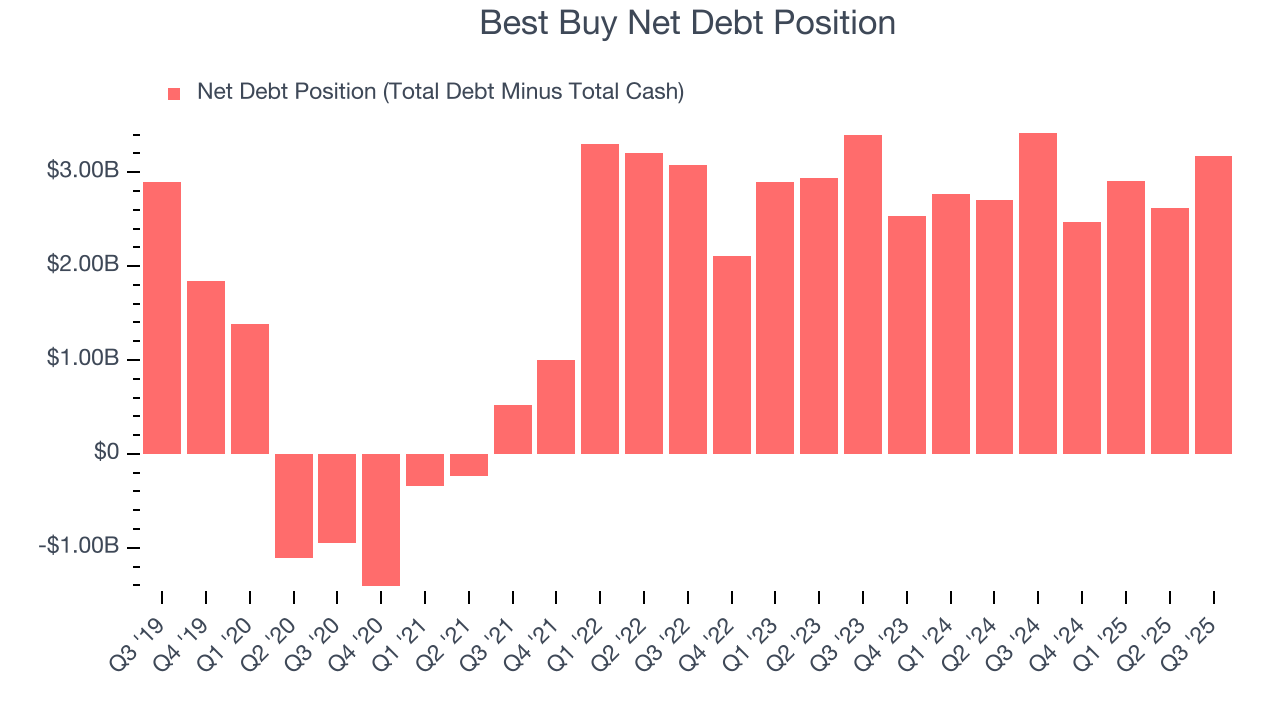
With $2.36 billion of EBITDA over the last 12 months, we view Best Buy’s 1.3× net-debt-to-EBITDA ratio as safe. We also see its $8 million of annual interest expenses as appropriate. The company’s profits give it plenty of breathing room, allowing it to continue investing in growth initiatives.
12. Key Takeaways from Best Buy’s Q3 Results
It was good to see Best Buy narrowly top analysts’ revenue expectations this quarter. We were also glad its EPS outperformed Wall Street’s estimates. Looking ahead, guidance for the full year was raised for both revenue and EPS. Overall, this was a solid quarter. The stock traded up 2.4% to $77.42 immediately after reporting.
13. Is Now The Time To Buy Best Buy?
Updated: January 14, 2026 at 9:30 PM EST
Are you wondering whether to buy Best Buy or pass? We urge investors to not only consider the latest earnings results but also longer-term business quality and valuation as well.
Best Buy falls short of our quality standards. To begin with, its revenue has declined over the last three years. And while its stellar ROIC suggests it has been a well-run company historically, the downside is its gross margins make it more challenging to reach positive operating profits compared to other consumer retail businesses. On top of that, its shrinking same-store sales tell us it will need to change its strategy to succeed.
Best Buy’s P/E ratio based on the next 12 months is 10.2x. This valuation multiple is fair, but we don’t have much confidence in the company. There are better stocks to buy right now.
Wall Street analysts have a consensus one-year price target of $82.67 on the company (compared to the current share price of $66.66).
Although the price target is bullish, readers should exercise caution because analysts tend to be overly optimistic. The firms they work for, often big banks, have relationships with companies that extend into fundraising, M&A advisory, and other rewarding business lines. As a result, they typically hesitate to say bad things for fear they will lose out. We at StockStory do not suffer from such conflicts of interest, so we’ll always tell it like it is.