
BKV (BKV)
We’re not sold on BKV. Its underwhelming revenue growth and failure to generate meaningful free cash flow is a concerning trend.― StockStory Analyst Team
1. News


2. Summary
Why BKV Is Not Exciting
Operating a "closed-loop" model linking gas production to carbon capture, BKV (NYSE:BKV) produces natural gas from shale formations in Texas and Pennsylvania, selling it to utilities, industrial users, and exporters.
- 3.6% annual revenue growth over the last four years was slower than its energy upstream and integrated energy peers
- Revenue base of $1.01 billion puts it at a disadvantage compared to larger competitors exhibiting economies of scale
- On the plus side, its EBITDA margin improvement of 36.7 percentage points over the last five years demonstrates its ability to scale efficiently


BKV lacks the business quality we seek. We’re looking for better stocks elsewhere.
Why There Are Better Opportunities Than BKV


BKV’s stock price of $28.59 implies a valuation ratio of 15.2x forward P/E. Yes, this valuation multiple is lower than that of other energy upstream and integrated energy peers, but we’ll remind you that you often get what you pay for.
Cheap stocks can look like a great deal at first glance, but they can be value traps. They often have less earnings power, meaning there is more reliance on a re-rating to generate good returns - an unlikely scenario for low-quality companies.
3. BKV (BKV) Research Report: Q4 CY2025 Update
Natural gas producer BKV (NYSE:BKV) beat Wall Street’s revenue expectations in Q4 CY2025, with sales up 176% year on year to $330.1 million. Its GAAP profit of $0.76 per share was significantly above analysts’ consensus estimates.
BKV (BKV) Q4 CY2025 Highlights:
- Revenue: $330.1 million vs analyst estimates of $260.8 million (176% year-on-year growth, 26.5% beat)
- EPS (GAAP): $0.76 vs analyst estimates of $0.30 (significant beat)
- Adjusted EBITDA: $100.7 million vs analyst estimates of $95.94 million (30.5% margin, 5% beat)
- Operating Margin: 30.5%, up from -47% in the same quarter last year
- Free Cash Flow was -$21.81 million compared to -$4.38 million in the same quarter last year
- Market Capitalization: $2.95 billion
Company Overview
Operating a "closed-loop" model linking gas production to carbon capture, BKV (NYSE:BKV) produces natural gas from shale formations in Texas and Pennsylvania, selling it to utilities, industrial users, and exporters.
The company's operations center on two major shale regions: the Barnett Shale in North Texas and the Marcellus Shale in Northeast Pennsylvania. In the Barnett, BKV controls roughly 462,000 net acres and produces both natural gas and natural gas liquids (NGLs), which are valuable byproducts like ethane and propane. In the Marcellus, it holds about 19,100 net acres producing primarily dry natural gas. A substantial portion of this production has earned Gold certification from Project Canary's TrustWell program, designating it as Responsibly Sourced Gas based on environmental performance metrics.
Beyond extraction, BKV owns midstream infrastructure including hundreds of miles of gathering pipelines and processing facilities that collect, treat, and transport gas from wellheads to market. This integration allows the company to control costs and timing as it moves product through the value chain. The company markets all its natural gas through a third-party agent to purchasers ranging from electric utilities and liquefied natural gas export terminals to large industrial customers. To access premium markets, BKV maintains firm transportation contracts on major interstate pipelines, including routes that deliver gas to New England and Gulf Coast destinations.
The company also holds a 50% stake in two combined-cycle power plants near Temple, Texas, which together generate roughly 1,500 megawatts of electricity and sell power into the state's ERCOT grid. A retail electricity marketing arm serves over 55,000 residential and commercial customers in deregulated Texas markets.
BKV's carbon capture, utilization, and sequestration business captures carbon dioxide waste from natural gas processing plants and other industrial sources, then injects it underground for permanent storage. The Barnett Zero Project, which began commercial operations in late 2023, sequesters approximately 165,000 metric tons of CO2 annually from a third-party processing facility. The company is developing additional projects across several states, having secured pore space rights on over 42,000 acres with estimated total storage capacity exceeding one billion metric tons of CO2. It intends to use carbon credits generated by these sequestration activities to offset emissions from its own operations and to market Carbon Sequestered Gas, a product that would be certified as carbon neutral across its lifecycle.
4. Upstream Natural Gas E&P
Natural gas-focused E&P companies explore, develop, and produce natural gas resources serving power generation, industrial, and export markets. Natural gas is often positioned as a transition fuel given lower carbon intensity versus coal and oil. Tailwinds include growing LNG (liquefied natural gas) export demand, power generation switching from coal, and industrial consumption growth. Headwinds include natural gas price volatility driven by weather, storage levels, and competing supply sources. Infrastructure constraints may limit market access, while long-term demand faces uncertainty from renewable energy expansion and electrification trends potentially reducing gas consumption.
BKV competes with other natural gas producers in its operating regions, including EQT Corporation (NYSE:EQT), Comstock Resources (NYSE:CRK), and Range Resources (NYSE:RRC), as well as larger integrated energy companies.
5. Revenue Scale
The size of the revenue base is a way to assess topline, and it tells an investor whether an Energy producer has crossed the line between being a more vulnerable commodity taker and a durable operating platform. Scaled businesses tend to produce and generate revenue from many wells, pads, takeaway routes, and geographies, not just a single field or drilling program. BKV’s $1.01 billion of revenue in the last year is pretty small for the industry, suggesting the company hasn’t hit a level of diversification where investors can sleep easy at night.
6. Revenue Growth
Cyclical sectors like Energy often flatter weaker operators during favorable price environments, but a longer-term lens separates those from businesses that can consistently perform across market cycles. Over the last four years, BKV grew its sales at a weak 3.6% compounded annual growth rate. This was below our standard for the energy upstream and integrated energy sector and is a rough starting point for our analysis.
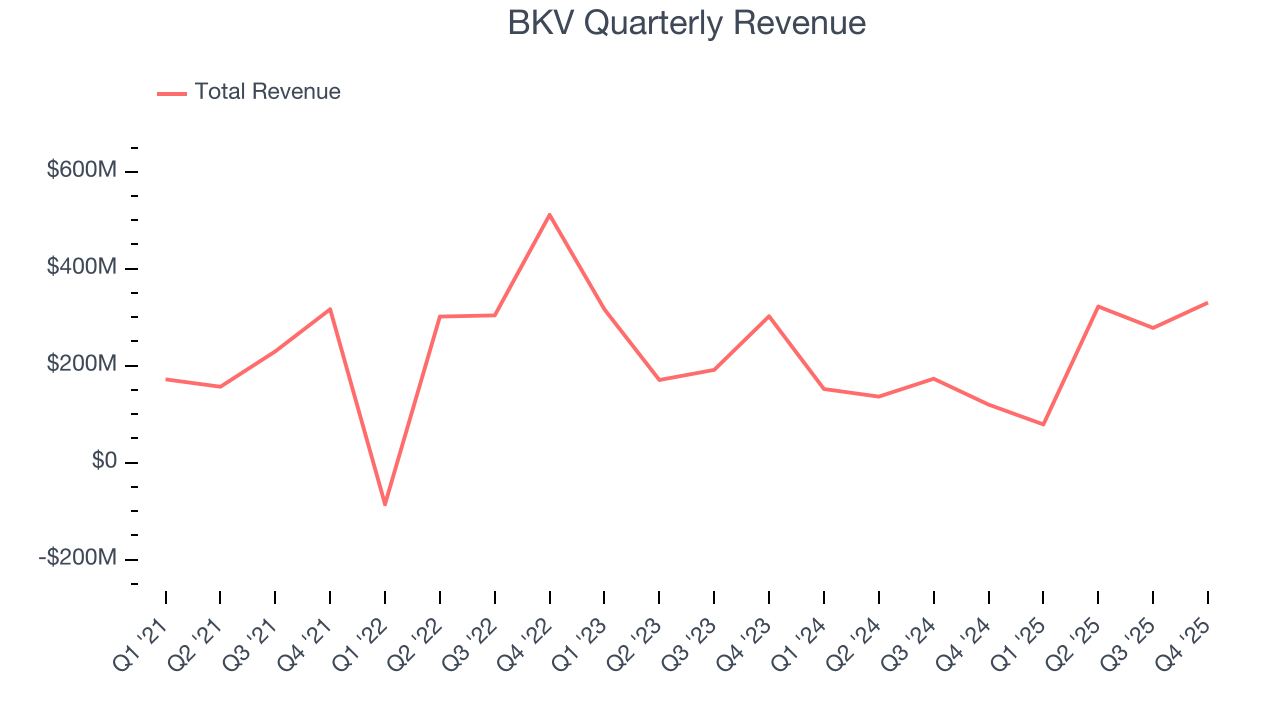
This quarter, BKV reported magnificent year-on-year revenue growth of 176%, and its $330.1 million of revenue beat Wall Street’s estimates by 26.5%.
7. Gross Margin
While energy gross margins can be distorted by commodity prices, hedging, and short-term cost swings, sustained margins across a full cycle reflect a producer’s underlying asset quality, infrastructure position, and cost structure.
BKV, which averaged 60.4% gross margin over the last five years, exhibits good unit economics in the sector. It means the company will remain profitable at lower commodity prices than peers with inferior gross margins and serves as an encouraging starting point for ultimate operating profits and free cash flow generation. 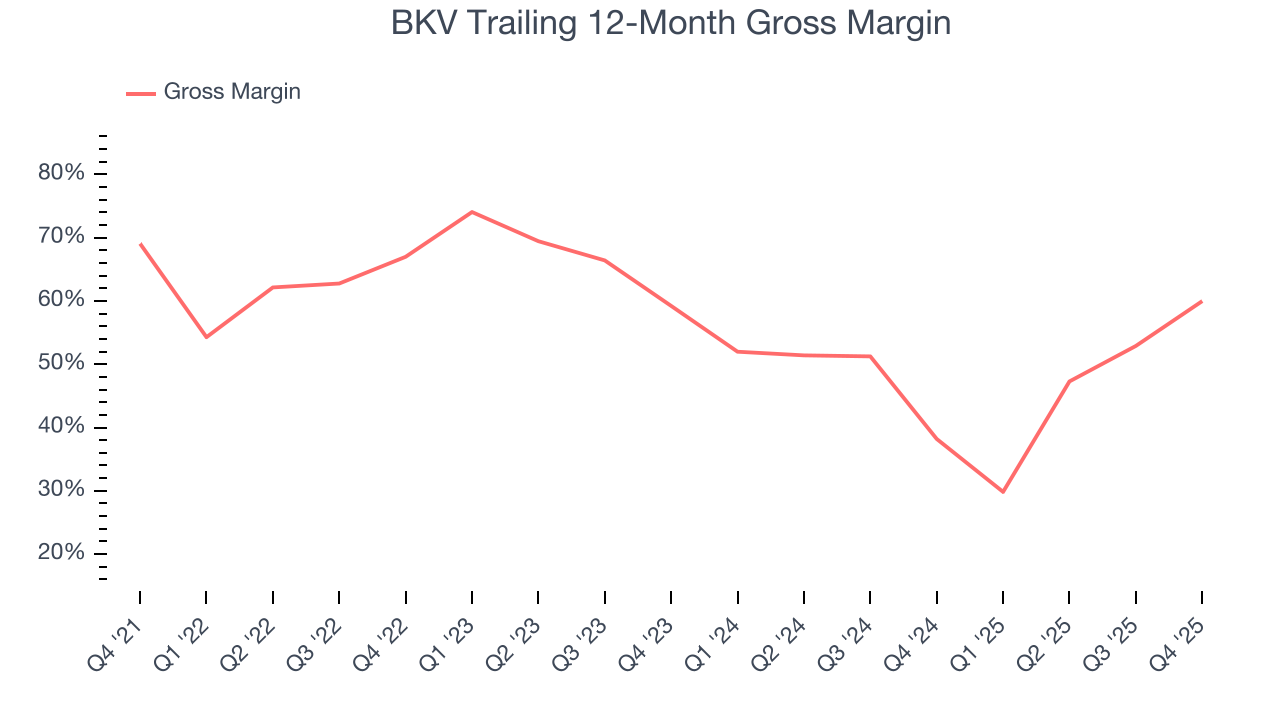
In Q4, BKV produced a 64.6% gross profit margin , marking a 39.2 percentage point increase from 25.4% in the same quarter last year. Note that energy margins can be volatile due to commodity price changes.
8. Adjusted EBITDA Margin
BKV was profitable over the last five years but held back by its large cost base. Its average EBITDA margin of 30.3% was weak for an upstream and integrated energy business.
On the plus side, BKV’s EBITDA margin rose by 36.7 percentage points over the last year.
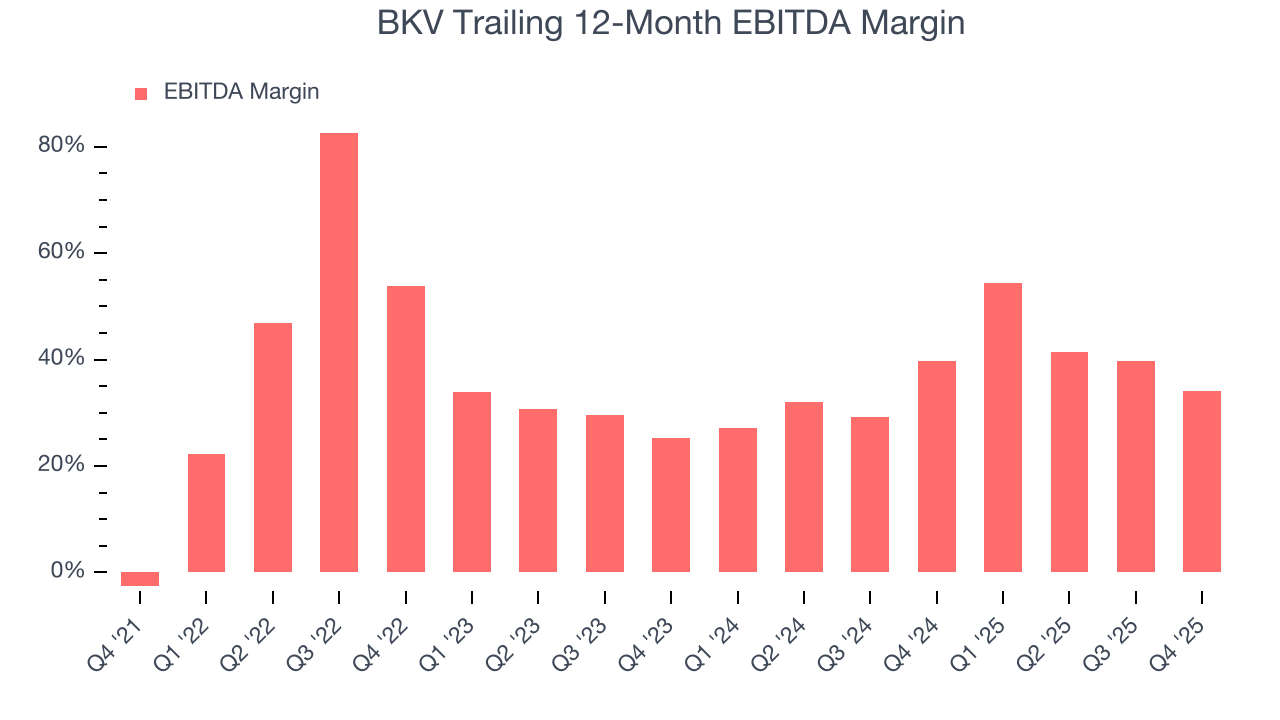
This quarter, BKV generated an EBITDA margin profit margin of 30.5%, down 31.1 percentage points year on year. This contraction shows it was less efficient because its expenses grew faster than its revenue. This adjusted EBITDA beat Wall Street’s estimates by 5%.
9. Cash Is King
Adjusted EBITDA shows how profitable a company’s existing “rock” is before financing and reinvestment, while free cash flow shows how much value remains after paying to replace those wells. Because production declines over time, strong EBITDA can coexist with weak FCF if drilling is expensive or declines are steep. FCF therefore captures both operating efficiency and the cost of sustaining production.
BKV has shown mediocre cash profitability relative to peers over the last five years, giving the company fewer opportunities to return capital to shareholders. Its free cash flow margin averaged 6.3%, below what we’d expect for an upstream and integrated energy business.
The level of free cash flow is important, but its durability across cycles is just as critical. Consistent margins are far more valuable than volatile swings driven by commodity prices.
BKV’s ratio of quarterly free cash flow volatility to Henry Hub gas-price volatility over the past five years was 6.9 (lower is better), indicating great insulation from commodity swings. indicating that its cash generation is relatively insulated from swings in commodity prices compared with most peers. This resilience supports access to capital in downturns and positions the company to act as a consolidator when distressed assets come to market at attractive prices.
You may be asking why we wait until the free cash flow line to perform this stability analysis versus commodity prices. Why not compare revenue or EBITDA to Henry Hub in the case of BKV? Because what ultimately matters is not how much revenue or profit you earn when prices are high but how much cash you can generate when prices are low. Free cash flow is the superior metric because it includes everything from hedging prowess to growth and maintenance capex to management behavior during good times and bad.
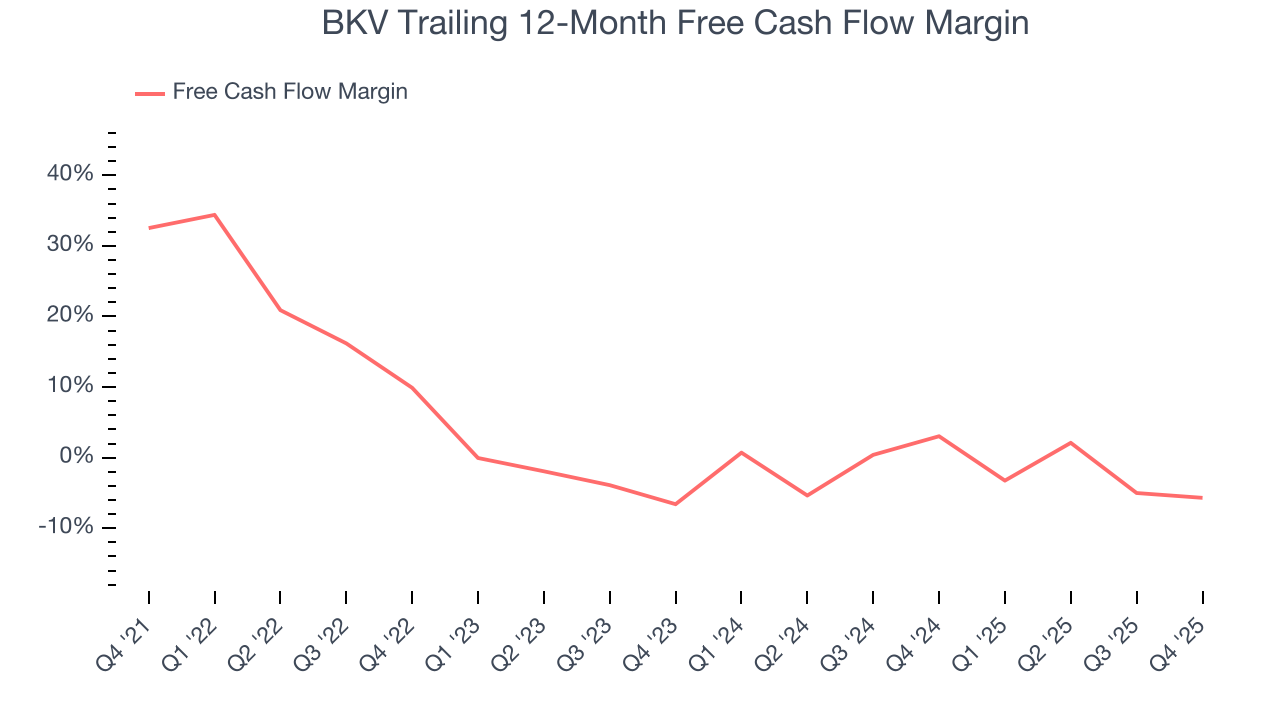
BKV burned through $21.81 million of cash in Q4, equivalent to a negative 6.6% margin. The company’s cash burn was similar to its $4.38 million of lost cash in the same quarter last year. These numbers deviate from its longer-term margin, indicating it is a seasonal business that must build up inventory during certain quarters.
10. Balance Sheet Assessment
BKV reported $199.4 million of cash and $494.4 million of debt on its balance sheet in the most recent quarter. As investors in high-quality companies, we primarily focus on two things: 1) that a company’s debt level isn’t too high and 2) that its interest payments are not excessively burdening the business.
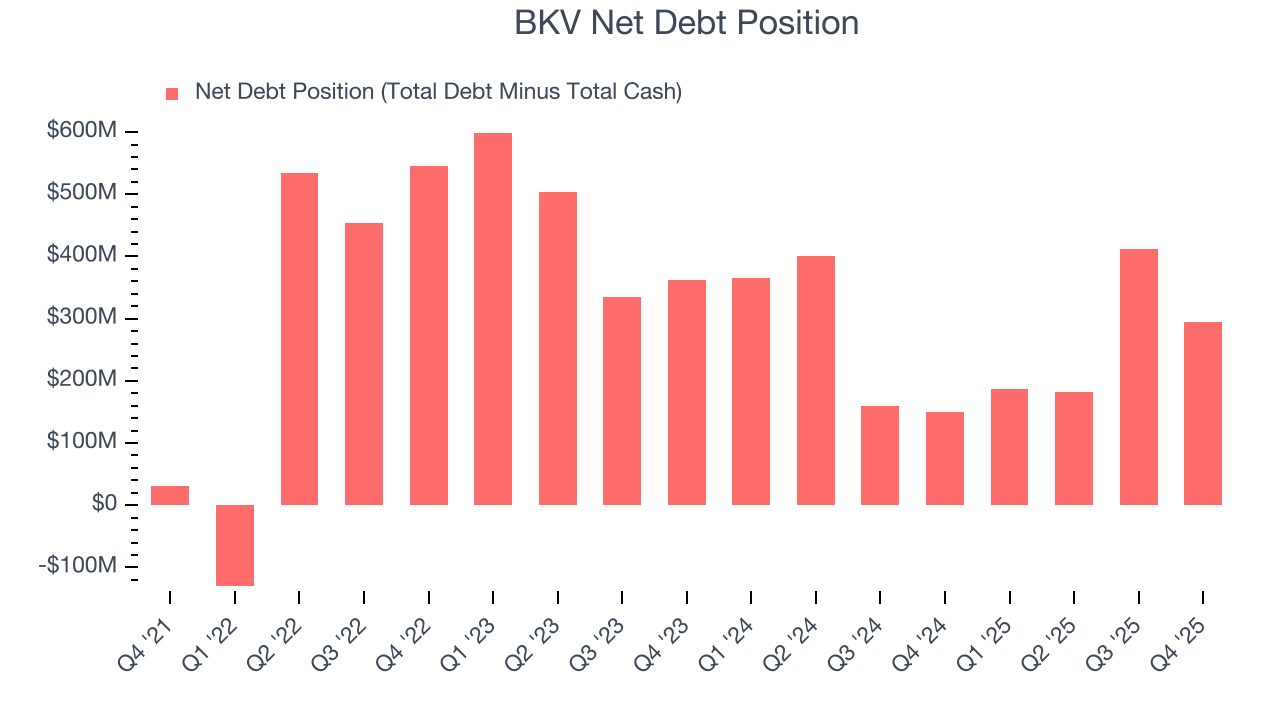
With $343.7 million of EBITDA over the last 12 months, we view BKV’s 0.9× net-debt-to-EBITDA ratio as safe. We also see its $27.07 million of annual interest expenses as appropriate. The company’s profits give it plenty of breathing room, allowing it to continue investing in growth initiatives.
11. Key Takeaways from BKV’s Q4 Results
It was good to see BKV beat analysts’ EPS expectations this quarter. We were also excited its revenue outperformed Wall Street’s estimates by a wide margin. Zooming out, we think this was a good print with some key areas of upside. The market seemed to be hoping for more, and the stock traded down 3.5% to $27.94 immediately following the results.
12. Is Now The Time To Buy BKV?
Updated: March 17, 2026 at 12:52 AM EDT
Before making an investment decision, investors should account for BKV’s business fundamentals and valuation in addition to what happened in the latest quarter.
BKV doesn’t top our investment wishlist, but we understand that it’s not a bad business. Although its revenue growth over the last four years was bottom-tier for the sector, its growth over the next 12 months is expected to be higher. And while BKV’s subscale operations hasn't hit a level of diversification where investors can sleep easy at night, its expanding EBITDA margin shows the business has become more efficient.
BKV’s P/E ratio based on the next 12 months is 15.2x. While this valuation is reasonable, we don’t really see a big opportunity at the moment. We're pretty confident there are superior stocks to buy right now.
Wall Street analysts have a consensus one-year price target of $33.90 on the company (compared to the current share price of $28.59).