EQT (EQT)
EQT sets the gold standard. Its fusion of high growth and profitability makes it an unstoppable force with big upside.― StockStory Analyst Team
1. News
2. Summary
Why We Like EQT
The largest natural gas producer in the United States by daily volume, EQT (NYSE:EQT) produces natural gas and natural gas liquids from wells drilled in the Appalachian Basin.
- Market share has increased this cycle as its 14.5% annual revenue growth over the last ten years was exceptional
- Unparalleled revenue scale of $8.23 billion gives it advantageous pricing and terms with suppliers
- EBITDA profits increased over the last five years as the company gained some leverage on its fixed costs and became more efficient


EQT is a no-brainer. The valuation looks fair based on its quality, and we think now is an opportune time to buy.
Why Is Now The Time To Buy EQT?


EQT’s stock price of $64.30 implies a valuation ratio of 13.6x forward P/E. Most energy upstream and integrated energy companies are more expensive, so we think EQT is a good deal when considering its quality characteristics.
Our work shows, time and again, that buying high-quality companies and holding them routinely leads to market outperformance. If you can get an attractive entry price, that’s icing on the cake.
3. EQT (EQT) Research Report: Q4 CY2025 Update
Natural gas producer EQT (NYSE:EQT) reported Q4 CY2025 results topping the market’s revenue expectations, with sales up 13.9% year on year to $2.26 billion. Its non-GAAP profit of $0.90 per share was 17.7% above analysts’ consensus estimates.
EQT (EQT) Q4 CY2025 Highlights:
- Revenue: $2.26 billion vs analyst estimates of $2.12 billion (13.9% year-on-year growth, 6.9% beat)
- Adjusted EPS: $0.90 vs analyst estimates of $0.76 (17.7% beat)
- Adjusted EBITDA: $1.64 billion vs analyst estimates of $1.41 billion (72.3% margin, 15.8% beat)
- Operating Margin: 44.9%, up from 39.3% in the same quarter last year
- Free Cash Flow Margin: 22.6%, up from 8.3% in the same quarter last year
- Market Capitalization: $38.72 billion
Company Overview
The largest natural gas producer in the United States by daily volume, EQT (NYSE:EQT) produces natural gas and natural gas liquids from wells drilled in the Appalachian Basin.
The company operates exclusively in the Appalachian Basin, which spans parts of Pennsylvania, West Virginia, and Ohio, focusing on developing large, contiguous acreage positions across approximately 2.1 million gross acres. Using horizontal drilling and hydraulic fracturing techniques, EQT extracts natural gas trapped in underground shale formations, primarily the Marcellus and Utica shales. The company's operational approach emphasizes "combo-development" projects—coordinated, large-scale drilling programs that develop multiple wells simultaneously to maximize efficiency and reduce per-unit costs.
Once extracted, EQT's natural gas flows through gathering pipelines to processing facilities operated by partners like MarkWest Energy Partners and Williams Ohio Valley Midstream. These processors separate the raw natural gas into pipeline-quality methane (the natural gas sold to end users) and natural gas liquids, which are heavier hydrocarbon components including ethane, propane, and butane. A utility purchasing EQT's natural gas might use it to generate electricity for homes and businesses, while an industrial customer could use it as feedstock for manufacturing plastics or chemicals.
EQT sells its production to marketers, utilities, and industrial customers through its marketing subsidiary, EQT Energy. The company has secured access to firm pipeline capacity that transports gas beyond the Appalachian Basin to higher-priced markets in the Gulf Coast, Midwest, and Northeast, as well as into Canada. This transportation network is crucial because local Appalachian pricing typically trades below the benchmark NYMEX Henry Hub price due to regional supply abundance and historical pipeline constraints. The company generates revenue by selling both the natural gas and the extracted natural gas liquids at prevailing market prices.
4. Upstream Natural Gas E&P
Natural gas-focused E&P companies explore, develop, and produce natural gas resources serving power generation, industrial, and export markets. Natural gas is often positioned as a transition fuel given lower carbon intensity versus coal and oil. Tailwinds include growing LNG (liquefied natural gas) export demand, power generation switching from coal, and industrial consumption growth. Headwinds include natural gas price volatility driven by weather, storage levels, and competing supply sources. Infrastructure constraints may limit market access, while long-term demand faces uncertainty from renewable energy expansion and electrification trends potentially reducing gas consumption.
EQT's competitors in Appalachian natural gas production include Chesapeake Energy (NASDAQ:CHK), Southwestern Energy (NYSE:SWN), Coterra Energy (NYSE:CTRA), Range Resources (NYSE:RRC), and Antero Resources (NYSE:AR).
5. Economies of Scale
The size of the revenue base is a way to assess topline, and it tells an investor whether an Energy producer has crossed the line between being a more vulnerable commodity taker and a durable operating platform. Scaled businesses tend to produce and generate revenue from many wells, pads, takeaway routes, and geographies, not just a single field or drilling program. EQT’s $8.23 billion of revenue in the last year is top-tier for the industry, suggesting the type of diversification that reduces operational risk.
6. Revenue Growth
Cyclical industries such as Energy can make mediocre companies look great for a time, but a long-term view reveals which businesses can actually withstand and adapt to changing conditions. Thankfully, EQT’s 18.2% annualized revenue growth over the last five years was impressive. Its growth surpassed the average energy upstream and integrated energy company and shows its offerings resonate with customers, a great starting point for our analysis.
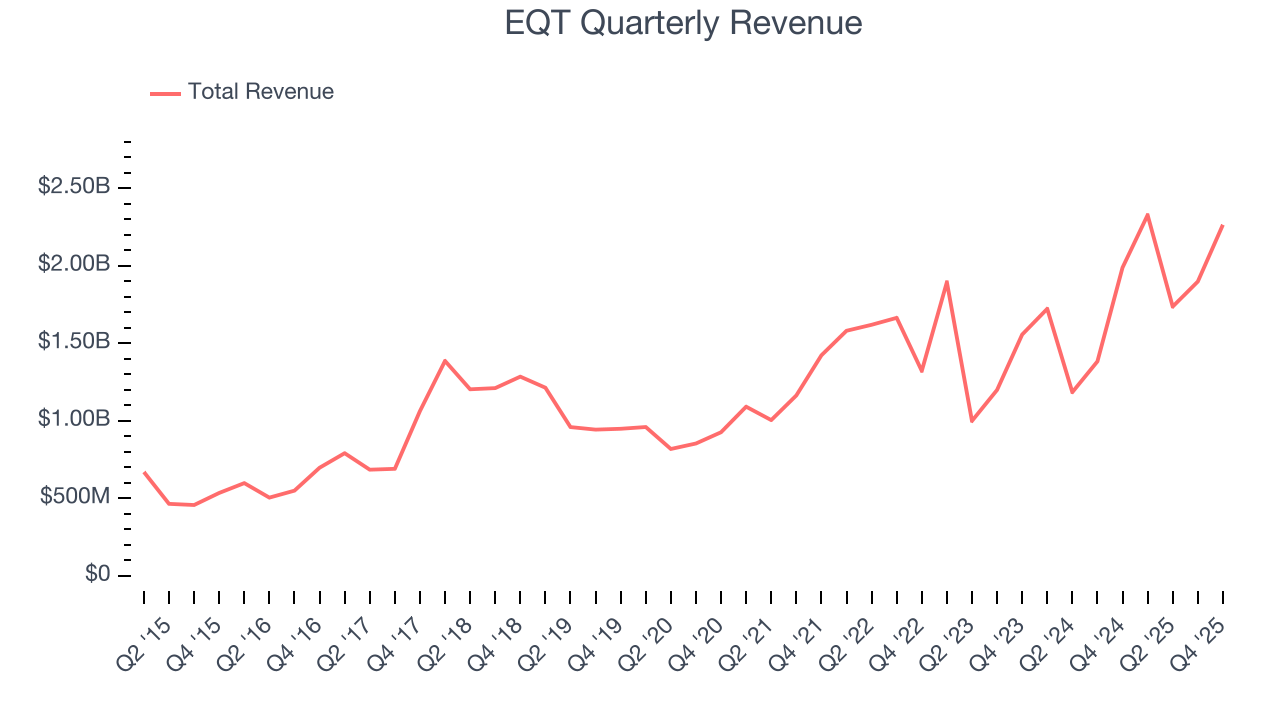
Energy cycles can be long enough that a single five-year period can still reflect one price environment, which is why an additional, decade-long view can help capture through-cycle performance. EQT’s annualized revenue growth of 14.5% over the last ten years is below its five-year trend, but we still think the results suggest decent demand.
While looking at revenue is important, it can also introduce noise around commodity prices and M&A. Analyzing production, on the other hand, highlights what is happening inside the asset base and whether the economic footprint of a company is expanding. Over the last two years, EQT’s total oil volume per day - Upstream averaged 17.2% year-on-year growth while natural gas volume per day - Upstream averaged 8.5% year-on-year growth, which was good. 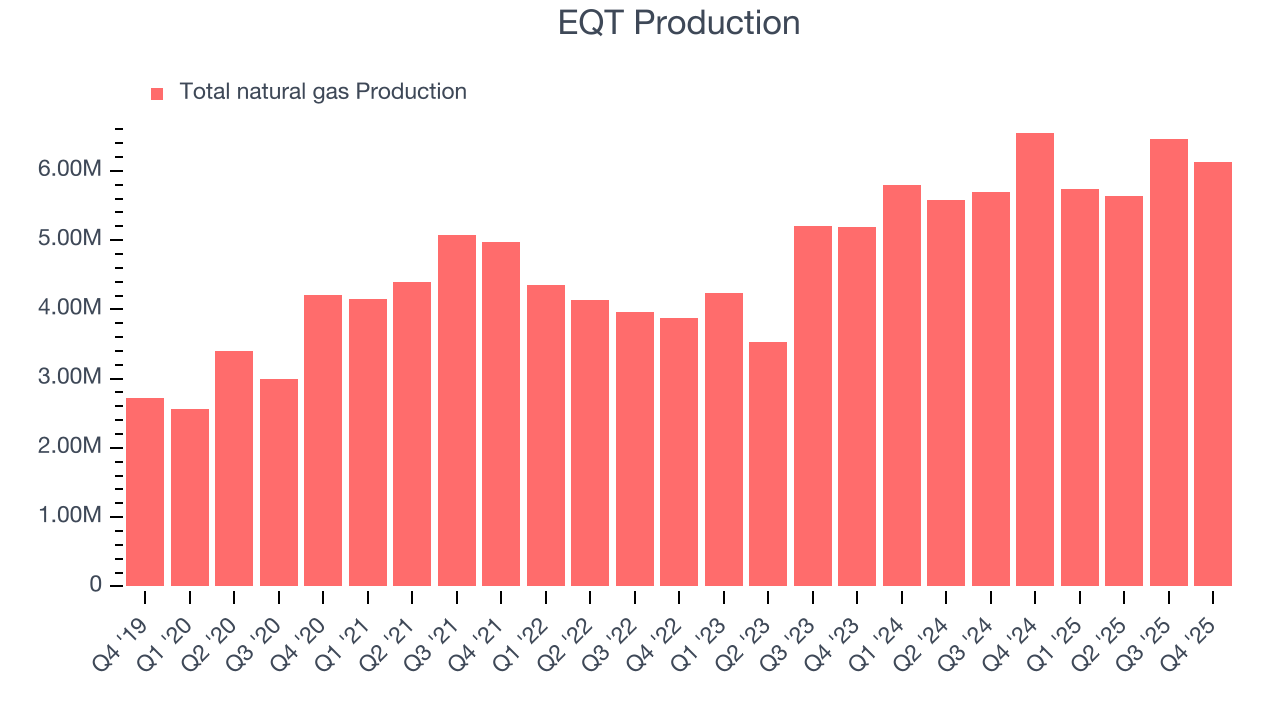
This quarter, EQT reported year-on-year revenue growth of 13.9%, and its $2.26 billion of revenue exceeded Wall Street’s estimates by 6.9%. This quarter, EQT reported a rather uninspiring 6.5% year-on-year production decline to 6,127 Mboe (thousand barrels of oil equivalent) of production, in line with Wall Street’s estimates.
7. Gross Margin
In any given year, energy gross margins are heavily influenced by prices, hedging, and cost inflation, but over a full cycle these gross margins reveal which producers are structurally advantaged through superior “rock” quality, infrastructure access, and cost position.
EQT, which averaged 66.1% gross margin over the last five years, exhibits good unit economics in the sector. It means the company will remain profitable at lower commodity prices than peers with inferior gross margins and serves as an encouraging starting point for ultimate operating profits and free cash flow generation. 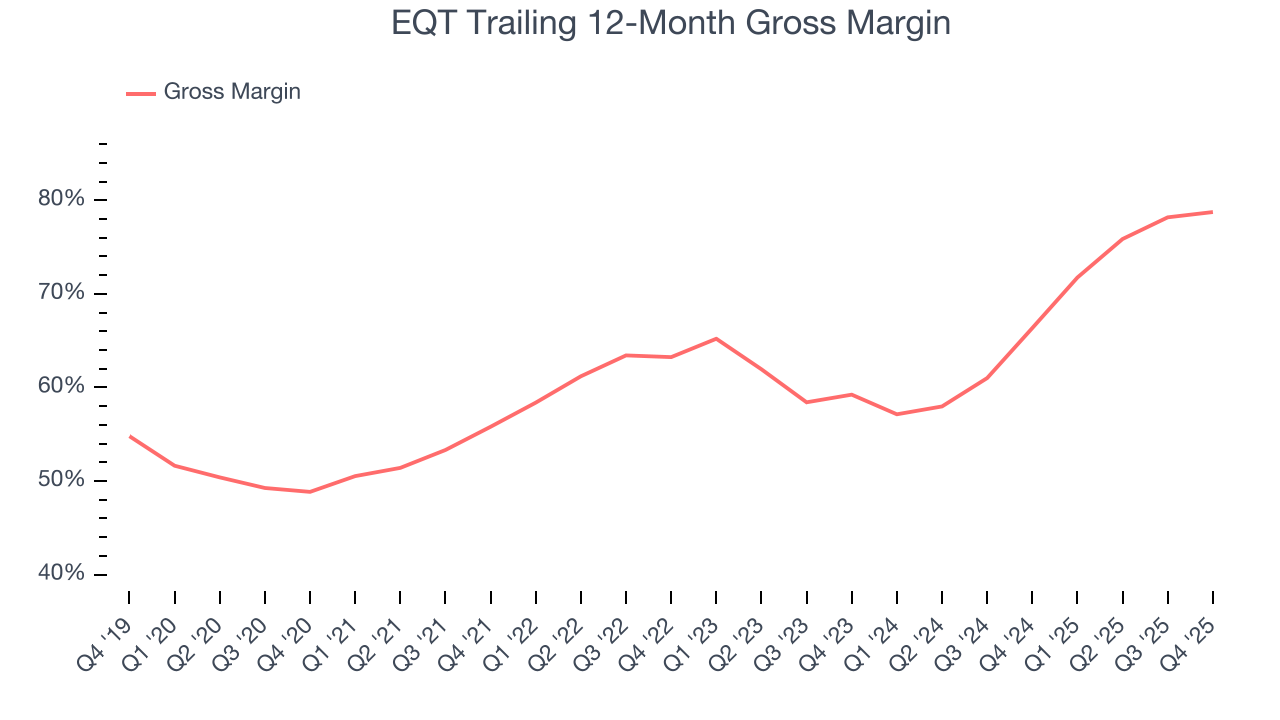
This quarter, EQT’s gross profit margin was 80%, up 2.1 percentage points year on year.
8. Adjusted EBITDA Margin
Adjusted EBITDA margin is an important measure of profitability for the sector and accounts for the gross margins and operating costs mentioned previously. Unlike operating margin, it is not distorted by accounting conventions around reserves, drilling costs, and assumptions on commodity consumption from the well or basin. Adjusted EBITDA highlights the economic reality of how much cash the rock produces before the capital structure (debt service) and the drilling budget (capex) are considered.
EQT has been a well-oiled machine over the last five years. It demonstrated elite profitability for an upstream and integrated energy business, boasting an average EBITDA margin of 58.3%.
Looking at the trend in its profitability, EQT’s EBITDA margin rose by 17.2 percentage points over the last year, as its sales growth gave it immense operating leverage.
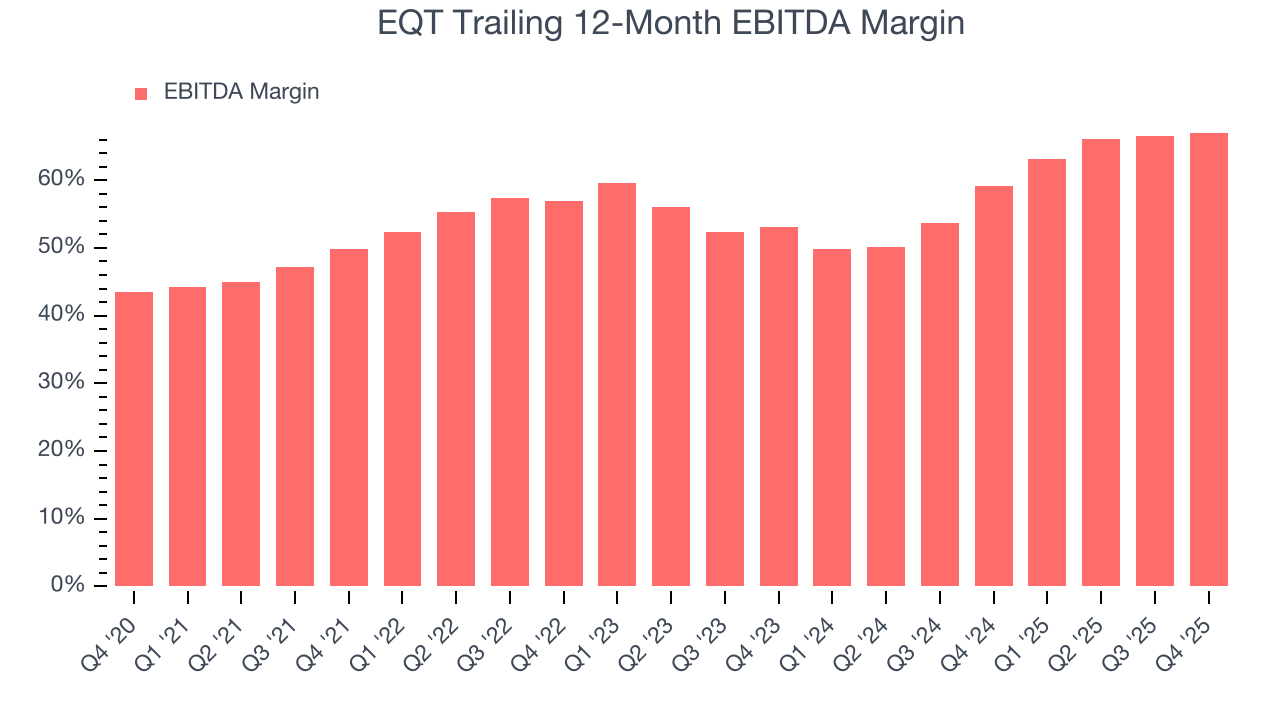
In Q4, EQT generated an EBITDA margin profit margin of 72.3%, up 1.3 percentage points year on year. This increase was a welcome development and shows it was more efficient. This adjusted EBITDA beat Wall Street’s estimates by 15.8%.
9. Cash Is King
As mentioned above, adjusted EBITDA ignores capital structure and drilling expenditure decisions. These are two huge aspects of an Energy producer, so in order to understand a comprehensive picture of business quality, an investor needs to account for these. Said differently, adjusted EBITDA margins could be solid but free cash flow is abysmal because decline rates of the asset are extreme and the drilling is expensive. Free cash flow tells you about not only the economics of the production that has happened but how much it costs to stay in business as well (further drilling or extraction).
EQT has shown terrific cash profitability, driven by its lucrative business model that enables it to reinvest, return capital to investors, and stay ahead of the competition. The company’s free cash flow margin was among the best in the energy upstream and integrated energy sector, averaging 23.4% over the last five years.
While the level of free cash flow margins is important, their consistency matters just as much.
EQT’s ratio of quarterly free cash flow volatility to Henry Hub gas-price volatility over the past five years was 2.9 (lower is better), indicating unusually strong insulation from commodity swings. This stability supports superior capital access in downturns and positions EQT to act as a consolidator when weaker peers are forced to retrench.
You may be asking why we wait until the free cash flow line to perform this stability analysis versus commodity prices. Why not compare revenue or EBITDA to Henry Hub in the case of EQT? Because what ultimately matters is not how much revenue or profit you earn when prices are high but how much cash you can generate when prices are low. Free cash flow is the superior metric because it includes everything from hedging prowess to growth and maintenance capex to management behavior during good times and bad.
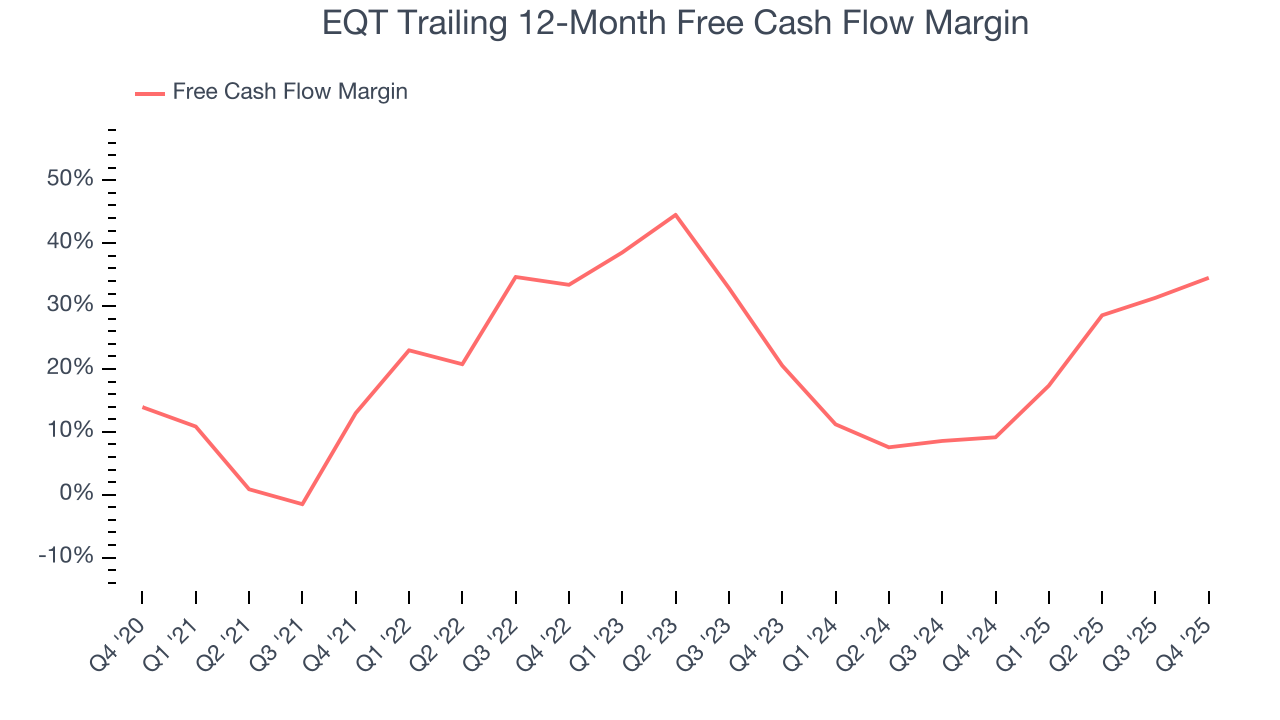
EQT’s free cash flow clocked in at $512.7 million in Q4, equivalent to a 22.6% margin. This result was good as its margin was 14.4 percentage points higher than in the same quarter last year, building on its favorable historical trend.
10. Return on Invested Capital (ROIC)
Free cash flow shows how much money a producer generated, while ROIC shows how efficiently that money was earned. ROIC measures the operating profit produced for each dollar of capital invested, whether from debt or equity. Cash generation measures quantity while ROIC measures the quality of value creation.
We at StockStory like to look at ROIC over a ten-year period because energy investment cycles can involve up to five years of ramping production and another five years of harvesting. A decade view captures buying, extracting, and monetizing rather than just part of that picture. Although EQT has shown solid fundamentals lately, it historically did a mediocre job investing in profitable growth initiatives. Its ten-year average ROIC was 0.5%, lower than the typical cost of capital (how much it costs to raise money) for energy upstream and integrated energy companies.
We like to invest in businesses with high returns, but the trend in a company’s ROIC is what often surprises the market and moves the stock price. Over the last few years, EQT’s ROIC averaged 1.8 percentage point increases each year. its rising ROIC is a good sign and could suggest its competitive advantage or profitable growth opportunities are expanding.
11. Balance Sheet Assessment
EQT reported $110.8 million of cash and $7.8 billion of debt on its balance sheet in the most recent quarter. As investors in high-quality companies, we primarily focus on two things: 1) that a company’s debt level isn’t too high and 2) that its interest payments are not excessively burdening the business.
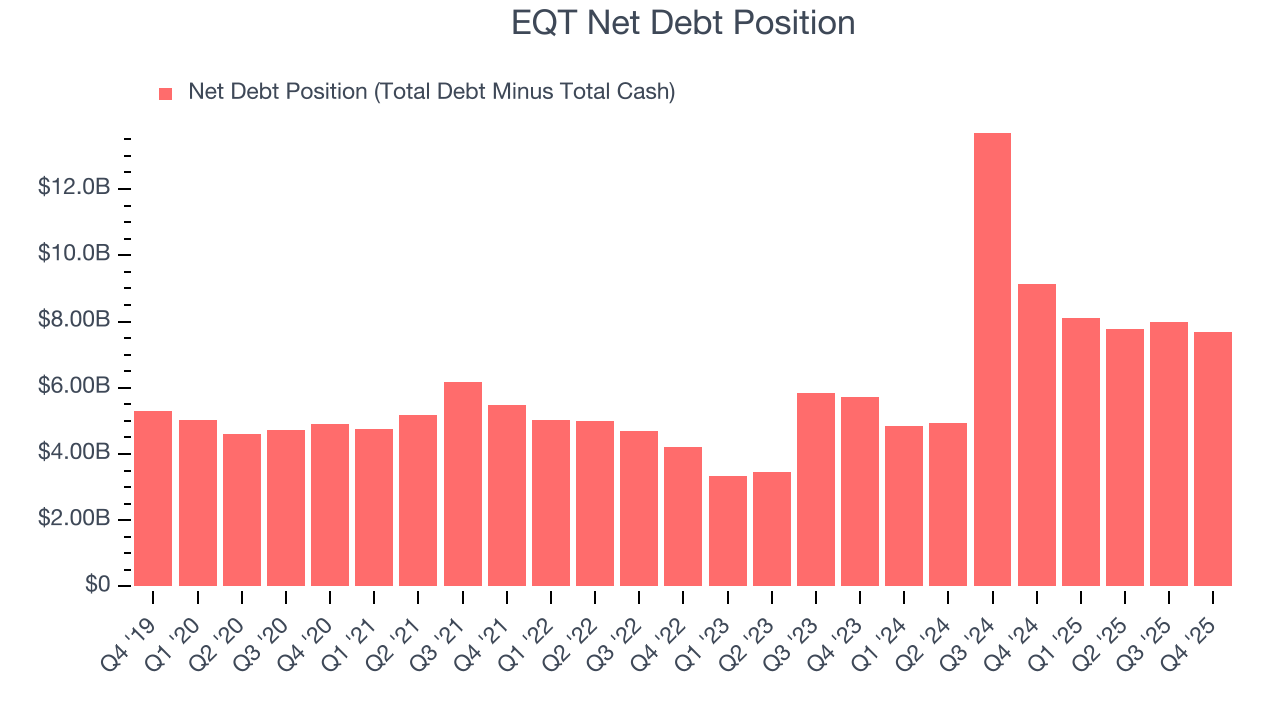
With $5.51 billion of EBITDA over the last 12 months, we view EQT’s 1.4× net-debt-to-EBITDA ratio as safe. We also see its $254.3 million of annual interest expenses as appropriate. The company’s profits give it plenty of breathing room, allowing it to continue investing in growth initiatives.
12. Key Takeaways from EQT’s Q4 Results
We were impressed by how significantly EQT blew past analysts’ EBITDA expectations this quarter. We were also excited its revenue outperformed Wall Street’s estimates by a wide margin. On the other hand, its production was in line. Zooming out, we think this was a good print with some key areas of upside. The stock remained flat at $62.45 immediately following the results.
13. Is Now The Time To Buy EQT?
Updated: March 17, 2026 at 1:16 AM EDT
We think that the latest earnings result is only one piece of the bigger puzzle. If you’re deciding whether to own EQT, you should also grasp the company’s longer-term business quality and valuation.
There is a lot to like about EQT. For starters, its revenue growth over the last five years was impressive for the sector. And while its relatively low ROIC suggests management has struggled to find compelling investment opportunities, its revenue growth over the last ten years was top-tier for the sector. Additionally, EQT’s top-tier scale enables operational efficiencies, capital market access, and investment in advanced technologies.
EQT’s P/E ratio based on the next 12 months is 13.6x. Looking at the energy upstream and integrated energy space today, EQT’s qualities as one of the best businesses really stand out, and we like it at this price.
Wall Street analysts have a consensus one-year price target of $66.15 on the company (compared to the current share price of $64.30), implying they see 2.9% upside in buying EQT in the short term.