
CNX Resources (CNX)
We aren’t fans of CNX Resources. Its sales have underperformed and its low returns on capital show it has few growth opportunities.― StockStory Analyst Team
1. News
2. Summary
Why CNX Resources Is Not Exciting
Tracing back to operations that began in 1860, CNX Resources (NYSE:CNX) drills for and produces natural gas from underground shale formations in Pennsylvania, Ohio, and West Virginia.
- Products and services are facing significant end-market challenges during this cycle as sales have declined by 4.5% annually over the last ten years
- Low returns on capital reflect management’s struggle to allocate funds effectively
- On the bright side, its excellent EBITDA margin highlights the strength of its business model


CNX Resources fails to meet our quality criteria. We’d rather invest in businesses with stronger moats.
Why There Are Better Opportunities Than CNX Resources


CNX Resources’s stock price of $42.07 implies a valuation ratio of 14.1x forward P/E. CNX Resources’s multiple may seem like a great deal among energy upstream and integrated energy peers, but we think there are valid reasons why it’s this cheap.
We’d rather pay up for companies with elite fundamentals than get a bargain on weak ones. Cheap stocks can be value traps, and as their performance deteriorates, they will stay cheap or get even cheaper.
3. CNX Resources (CNX) Research Report: Q4 CY2025 Update
Natural gas producer CNX Resources (NYSE:CNX) announced better-than-expected revenue in Q4 CY2025, with sales up 8.9% year on year to $450 million. Its non-GAAP profit of $0.67 per share was 72.4% above analysts’ consensus estimates.
CNX Resources (CNX) Q4 CY2025 Highlights:
- Revenue: $450 million vs analyst estimates of $428 million (8.9% year-on-year growth, 5.1% beat)
- Adjusted EPS: $0.67 vs analyst estimates of $0.39 (72.4% beat)
- Adjusted EBITDA: $288.2 million vs analyst estimates of $266.3 million (64% margin, 8.2% beat)
- Operating Margin: 59.8%, up from -45.1% in the same quarter last year
- Free Cash Flow Margin: 27.3%, down from 39.5% in the same quarter last year
- Market Capitalization: $5.91 billion
Company Overview
Tracing back to operations that began in 1860, CNX Resources (NYSE:CNX) drills for and produces natural gas from underground shale formations in Pennsylvania, Ohio, and West Virginia.
The company focuses on extracting natural gas from two primary underground rock formations: the Marcellus Shale and the Utica Shale. These formations, buried thousands of feet below the surface, contain natural gas trapped within the rock. CNX uses horizontal drilling and hydraulic fracturing techniques to access this gas, drilling down vertically and then turning horizontally to maximize contact with the gas-bearing rock. The company controls drilling rights on approximately 528,000 net acres of Marcellus Shale and 606,000 net acres of Utica Shale, with about 339,000 acres where both formations overlap. CNX also produces coalbed methane in Virginia, capturing gas from coal seams and abandoned mines that would otherwise escape into the atmosphere.
Beyond production, CNX operates an extensive midstream infrastructure consisting of roughly 2,700 miles of gathering pipelines and several processing facilities. These systems collect raw natural gas from wells and transport it to interstate pipelines or directly to customers. The company sells its natural gas to various buyers including gas marketers who resell to end users, industrial facilities that use gas for manufacturing, local distribution companies that supply homes and businesses, and power plants that generate electricity. For example, a chemical plant in the region might purchase CNX's gas to fuel its production processes, or a utility company might buy it to generate power for residential customers.
CNX has developed a portfolio of firm transportation capacity contracts that guarantee space on interstate pipelines to move its gas to markets across the United States. The company also generates revenue from environmental attributes, particularly by capturing methane from coal mines and selling carbon credits through programs like Pennsylvania's Alternative Energy Portfolio Standard or to companies seeking to offset their emissions.
4. Upstream Natural Gas E&P
Natural gas-focused E&P companies explore, develop, and produce natural gas resources serving power generation, industrial, and export markets. Natural gas is often positioned as a transition fuel given lower carbon intensity versus coal and oil. Tailwinds include growing LNG (liquefied natural gas) export demand, power generation switching from coal, and industrial consumption growth. Headwinds include natural gas price volatility driven by weather, storage levels, and competing supply sources. Infrastructure constraints may limit market access, while long-term demand faces uncertainty from renewable energy expansion and electrification trends potentially reducing gas consumption.
CNX Resources competes with other Appalachian Basin natural gas producers including EQT Corporation (NYSE:EQT), Southwestern Energy (NYSE:SWN), Range Resources (NYSE:RRC), and Coterra Energy (NYSE:CTRA).
5. Revenue Scale
In Energy, scale separates fragile single-asset producers from platform-style businesses that generate revenue across entire basins and infrastructure networks. CNX Resources’s $1.85 billion of revenue in the last year is pretty small for the industry, suggesting the company hasn’t hit a level of diversification where investors can sleep easy at night. is a small company in an industry where scale matters.
6. Revenue Growth
A company’s long-term performance can give signals about its business quality. Even a bad business, especially in a cyclical industry, can shine for a year or so, but a top-tier one should exhibit resilience through cycles. Over the last five years, CNX Resources grew its sales at a sluggish 4.9% compounded annual growth rate. This was below our standard for the energy upstream and integrated energy sector and is a poor baseline for our analysis.
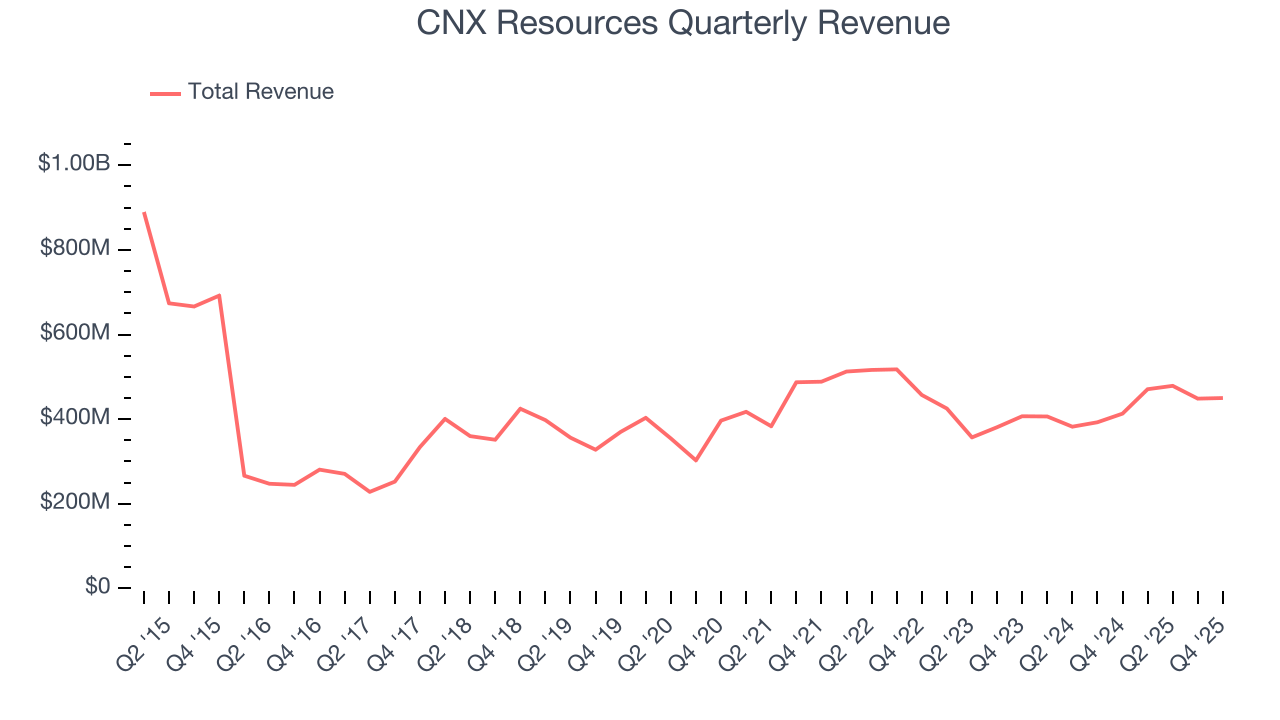
Energy cycles can be long enough that a single five-year period can still reflect one price environment, which is why an additional, decade-long view can help capture through-cycle performance. CNX Resources’s performance shows it grew in the past five-year but relinquished its gains over the last ten years, as its revenue fell by 4.5% annually.
While looking at revenue is important, it can also introduce noise around commodity prices and M&A. Analyzing drivers of revenue, on the other hand, highlights what is happening inside the asset base and whether the economic footprint of a company is expanding. Over the last two years, CNX Resources’s total oil volume per day - Upstream averaged 6.9% year-on-year growth. 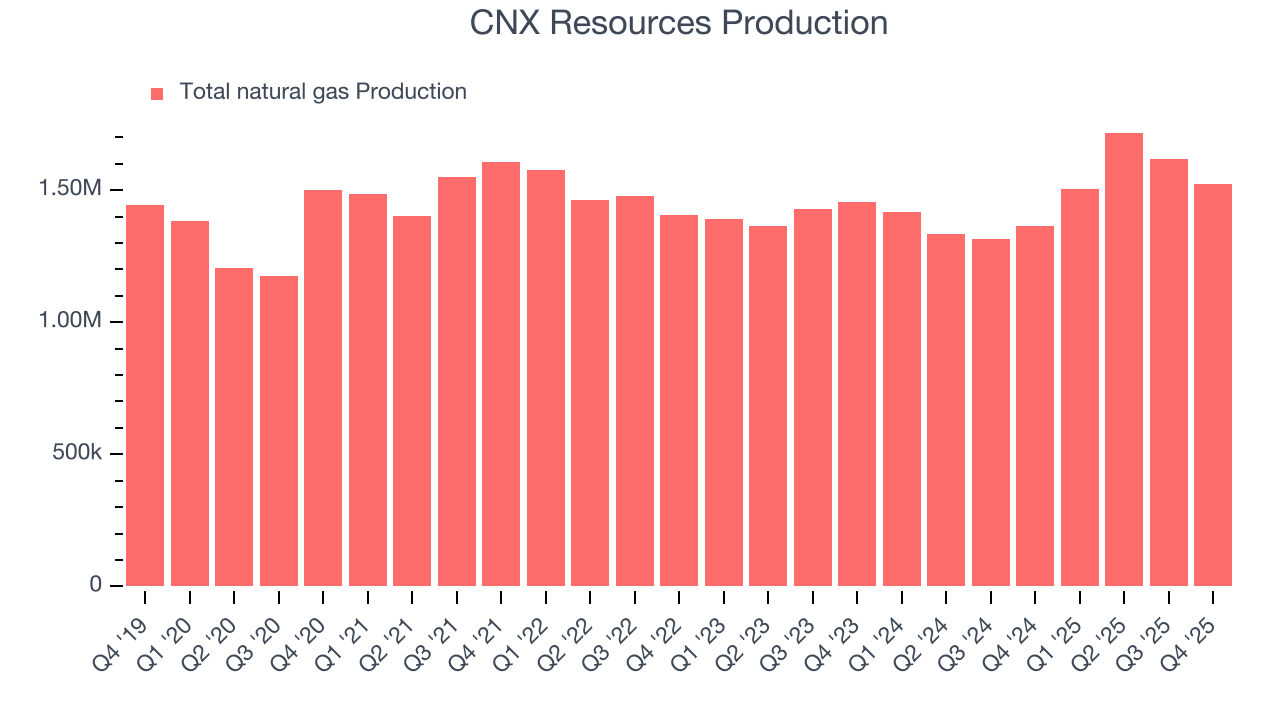
This quarter, CNX Resources reported year-on-year revenue growth of 8.9%, and its $450 million of revenue exceeded Wall Street’s estimates by 5.1%. This quarter, CNX Resources reported year-on-year production growth of 11.6%, and its 1,522 Mboe (thousand barrels of oil equivalent) of production exceeded Wall Street’s estimates by 2%.
7. Gross Margin
In any given year, energy gross margins are heavily influenced by prices, hedging, and cost inflation, but over a full cycle these gross margins reveal which producers are structurally advantaged through superior “rock” quality, infrastructure access, and cost position.
CNX Resources, which averaged 67.9% gross margin over the last five years, exhibits impressive unit economics in the sector. It means the company will remain profitable at lower commodity prices than peers with inferior gross margins and serves as an excellent starting point for ultimate operating profits and free cash flow generation. 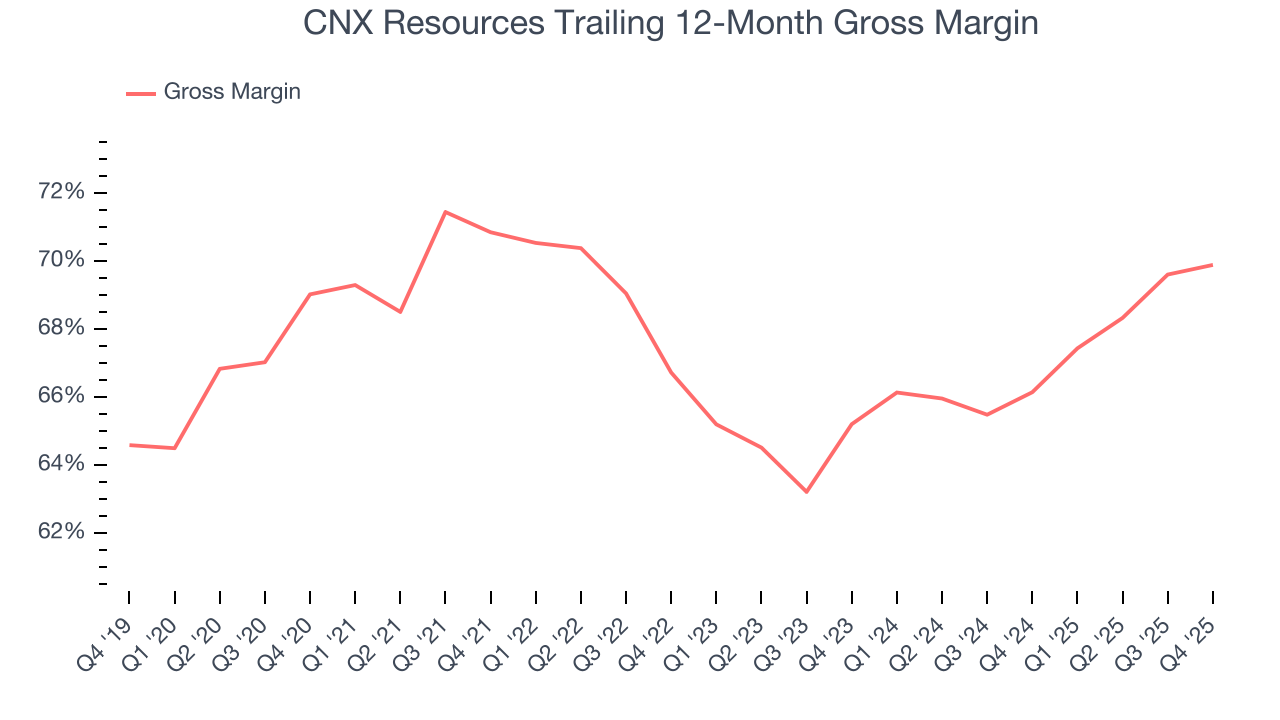
In Q4, CNX Resources produced a 69.8% gross profit margin , marking a 1.2 percentage point increase from 68.6% in the same quarter last year. Note that energy margins can be volatile due to commodity price changes.
8. Adjusted EBITDA Margin
CNX Resources has been a well-oiled machine over the last five years. It demonstrated elite profitability for an upstream and integrated energy business, boasting an average EBITDA margin of 63.7%.
Analyzing the trend in its profitability, CNX Resources’s EBITDA margin might fluctuated slightly but has generally stayed the same over the last year, highlighting the consistency of its expense base.
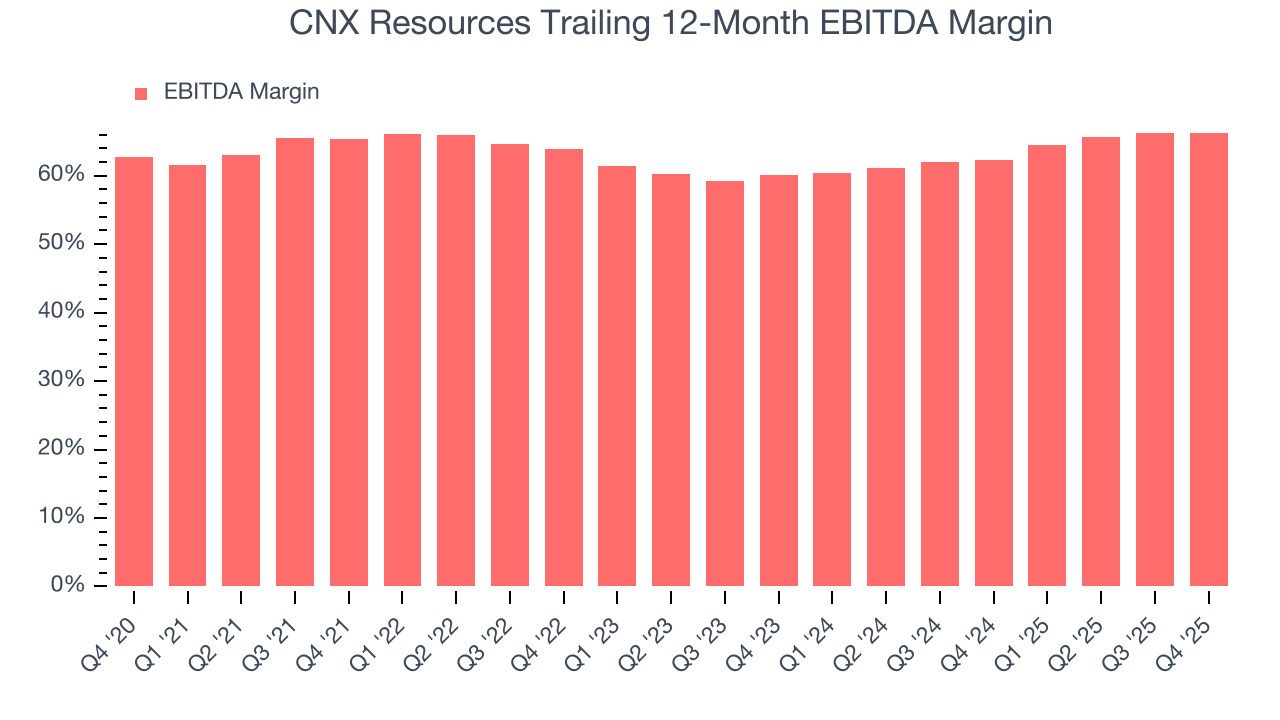
In Q4, CNX Resources generated an EBITDA margin profit margin of 64%, in line with the same quarter last year. This indicates the company’s overall cost structure has been relatively stable. This adjusted EBITDA beat Wall Street’s estimates by 8.5%.
9. Cash Is King
Adjusted EBITDA shows how profitable a company’s existing “rock” is before financing and reinvestment, while free cash flow shows how much value remains after paying to replace those wells. Because production declines over time, strong EBITDA can coexist with weak FCF if drilling is expensive or declines are steep. FCF therefore captures both operating efficiency and the cost of sustaining production.
CNX Resources has shown terrific cash profitability, driven by its lucrative business model that enables it to reinvest, return capital to investors, and stay ahead of the competition. The company’s free cash flow margin was among the best in the energy upstream and integrated energy sector, averaging 23.6% over the last five years.
While the level of free cash flow margins is important, their consistency matters just as much.
CNX Resources’s ratio of quarterly free cash flow volatility to Henry Hub gas-price volatility over the past five years was 1.5 (lower is better), indicating excellent insulation from commodity swings. This stability supports superior capital access in downturns and positions CNX Resources to act as a consolidator when weaker peers are forced to retrench.
You may be asking why we wait until the free cash flow line to perform this stability analysis versus commodity prices. Why not compare revenue or EBITDA to Henry Hub in the case of CNX Resources? Because what ultimately matters is not how much revenue or profit you earn when prices are high but how much cash you can generate when prices are low. Free cash flow is the superior metric because it includes everything from hedging prowess to growth and maintenance capex to management behavior during good times and bad.
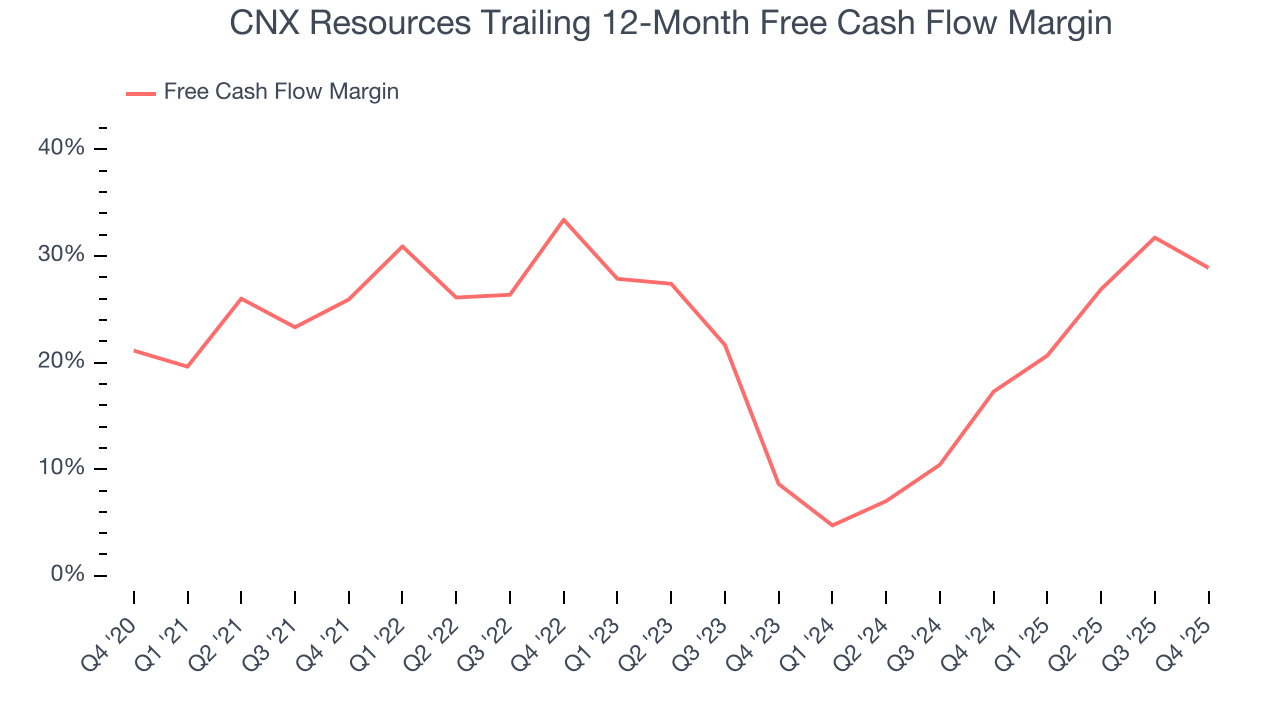
CNX Resources’s free cash flow clocked in at $122.6 million in Q4, equivalent to a 27.3% margin. The company’s cash profitability regressed as it was 12.3 percentage points lower than in the same quarter last year, but it’s still above its five-year average. We wouldn’t read too much into this quarter’s decline because investment needs can be seasonal, leading to short-term swings. Long-term trends are more important.
10. Return on Invested Capital (ROIC)
Free cash flow shows how much money a producer generated, while ROIC shows how efficiently that money was earned. ROIC measures the operating profit produced for each dollar of capital invested, whether from debt or equity. Cash generation measures quantity while ROIC measures the quality of value creation.
We at StockStory like to look at ROIC over a ten-year period because energy investment cycles can involve up to five years of ramping production and another five years of harvesting. A decade view captures buying, extracting, and monetizing rather than just part of that picture. CNX Resources historically did a mediocre job investing in profitable growth initiatives. Its ten-year average ROIC was 3.2%, lower than the typical cost of capital (how much it costs to raise money) for energy upstream and integrated energy companies.
We like to invest in businesses with high returns, but the trend in a company’s ROIC is what often surprises the market and moves the stock price. Over the last few years, CNX Resources’s ROIC has increased significantly. This is a good sign, and if its returns keep rising, there’s a chance it could evolve into an investable business.
11. Balance Sheet Assessment
CNX Resources reported $13.46 million of cash and $2.71 billion of debt on its balance sheet in the most recent quarter. As investors in high-quality companies, we primarily focus on two things: 1) that a company’s debt level isn’t too high and 2) that its interest payments are not excessively burdening the business.
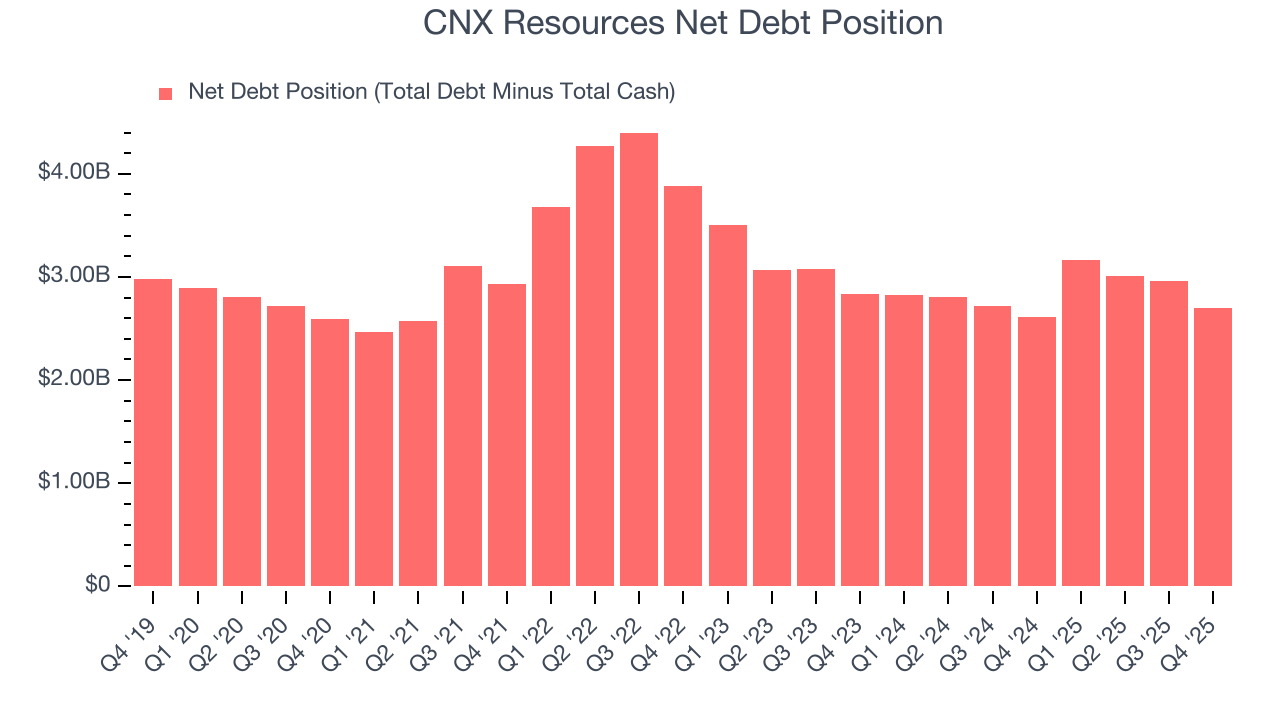
With $1.22 billion of EBITDA over the last 12 months, we view CNX Resources’s 2.2× net-debt-to-EBITDA ratio as safe. We also see its $170.6 million of annual interest expenses as appropriate. The company’s profits give it plenty of breathing room, allowing it to continue investing in growth initiatives.
12. Key Takeaways from CNX Resources’s Q4 Results
It was good to see CNX Resources beat analysts’ EPS expectations this quarter. We were also excited its revenue outperformed Wall Street’s estimates by a wide margin. Zooming out, we think this was a good print with some key areas of upside. Investors were likely hoping for more, and shares traded down 2.1% to $40.62 immediately following the results.
13. Is Now The Time To Buy CNX Resources?
Updated: March 17, 2026 at 1:00 AM EDT
The latest quarterly earnings matters, sure, but we actually think longer-term fundamentals and valuation matter more. Investors should consider all these pieces before deciding whether or not to invest in CNX Resources.
CNX Resources has a few positive attributes, but it doesn’t top our wishlist. Although its revenue growth over the last five years was bottom-tier for the sector, its growth over the next 12 months is expected to be higher. And while CNX Resources’s revenue has declined over the last ten years, its impressive EBITDA margins show it has a highly efficient business model.
CNX Resources’s P/E ratio based on the next 12 months is 14.1x. This valuation multiple is fair, but we don’t have much faith in the company. We're fairly confident there are better investments elsewhere.
Wall Street analysts have a consensus one-year price target of $37.31 on the company (compared to the current share price of $42.07).