
Weatherford (WFRD)
Weatherford doesn’t excite us. Not only has its sales growth been weak but also its negative returns on capital show it destroyed value.― StockStory Analyst Team
1. News
2. Summary
Why We Think Weatherford Will Underperform
Operating in roughly 75 countries with over 300 facilities worldwide, Weatherford (NASDAQ:WFRD) provides equipment and services for drilling, completing, and maintaining oil and gas wells.
- Customers postponed purchases of its products and services this cycle as its revenue declined by 6.3% annually over the last ten years
- Negative returns on capital show management lost money while trying to expand the business
- A silver lining is that its returns on capital are growing as management invests in more worthwhile ventures


Weatherford’s quality isn’t up to par. You should search for better opportunities.
Why There Are Better Opportunities Than Weatherford


Weatherford is trading at $98.09 per share, or 17.4x forward P/E. Yes, this valuation multiple is lower than that of other energy upstream and integrated energy peers, but we’ll remind you that you often get what you pay for.
We’d rather pay up for companies with elite fundamentals than get a bargain on weak ones. Cheap stocks can be value traps, and as their performance deteriorates, they will stay cheap or get even cheaper.
3. Weatherford (WFRD) Research Report: Q4 CY2025 Update
Oilfield services company Weatherford (NASDAQ:WFRD) reported revenue ahead of Wall Street’s expectations in Q4 CY2025, but sales fell by 3.9% year on year to $1.29 billion. Its non-GAAP profit of $1.91 per share was 29.9% above analysts’ consensus estimates.
Weatherford (WFRD) Q4 CY2025 Highlights:
- Revenue: $1.29 billion vs analyst estimates of $1.26 billion (3.9% year-on-year decline, 2.3% beat)
- Adjusted EPS: $1.91 vs analyst estimates of $1.47 (29.9% beat)
- Adjusted EBITDA: $279 million vs analyst estimates of $278.2 million (21.6% margin, in line)
- Operating Margin: 15.4%, in line with the same quarter last year
- Free Cash Flow Margin: 17.2%, up from 12.1% in the same quarter last year
- Market Capitalization: $6.57 billion
Company Overview
Operating in roughly 75 countries with over 300 facilities worldwide, Weatherford (NASDAQ:WFRD) provides equipment and services for drilling, completing, and maintaining oil and gas wells.
The company organizes its business around the lifecycle of an oil or gas well, from initial drilling through production and eventual abandonment. Its Drilling and Evaluation segment helps energy companies drill wells safely and efficiently, offering managed pressure drilling systems that control wellbore pressures, directional drilling tools that steer the drill bit to reach underground reserves, and drilling fluids that cool equipment and carry rock cuttings to the surface. For example, an oil company drilling in a high-pressure offshore environment might use Weatherford's rotating control devices and automated systems to prevent dangerous blowouts.
The Well Construction and Completions segment focuses on well integrity and preparation for production. This includes tubular running services that safely install steel casing pipes into wells, cementation products that seal the space between the casing and rock formation to prevent fluid migration, and completion tools like safety valves and production packers that control how oil and gas flow to the surface. A natural gas producer completing a well might use Weatherford's multistage fracturing systems to stimulate multiple zones of the reservoir in a single operation.
The Production and Intervention segment helps maximize output from existing wells. Its artificial lift systems—including rod pumps, gas-lift equipment, and other mechanical solutions—enable production from wells lacking sufficient natural pressure to push hydrocarbons to the surface. The segment also provides intervention services for troubleshooting and workover operations, subsea equipment for deepwater wells, and pressure pumping services in select international markets. Weatherford generates revenue by selling equipment and charging for services rendered to national oil companies, international oil majors, and independent exploration and production companies.
4. Mixed or Offshore Upstream E&P
This category includes smaller or niche E&P companies operating in specialized basins, geographies, or resource types outside major classifications. These firms may target unconventional resources, frontier regions, or specific commodity niches. Tailwinds include potential for outsized returns from successful exploration, acquisition opportunities during industry downturns, and specialized expertise commanding premium valuations. Headwinds include higher operational and geological risks, limited scale reducing negotiating power and cost efficiencies, and constrained capital market access during challenging commodity environments. Regulatory risks and ESG concerns may disproportionately affect smaller operators with fewer resources for compliance.
Weatherford competes with oilfield services giants SLB (NYSE:SLB), Halliburton (NYSE:HAL), and Baker Hughes (NASDAQ:BKR), along with equipment providers like National Oilwell Varco (NYSE:NOV), ChampionX (NASDAQ:CHX), and Expro (NYSE:XPRO).
5. Economies of Scale
In Energy, scale separates fragile single-asset producers from platform-style businesses that generate revenue across entire basins and infrastructure networks. Weatherford’s $4.92 billion of revenue in the last year is mid-sized for the industry.
6. Revenue Growth
Cyclical sectors like Energy often flatter weaker operators during favorable price environments, but a longer-term lens separates those from businesses that can consistently perform across market cycles. Over the last five years, Weatherford grew its sales at a sluggish 5.9% compounded annual growth rate. This was below our standard for the energy upstream and integrated energy sector and is a tough starting point for our analysis.
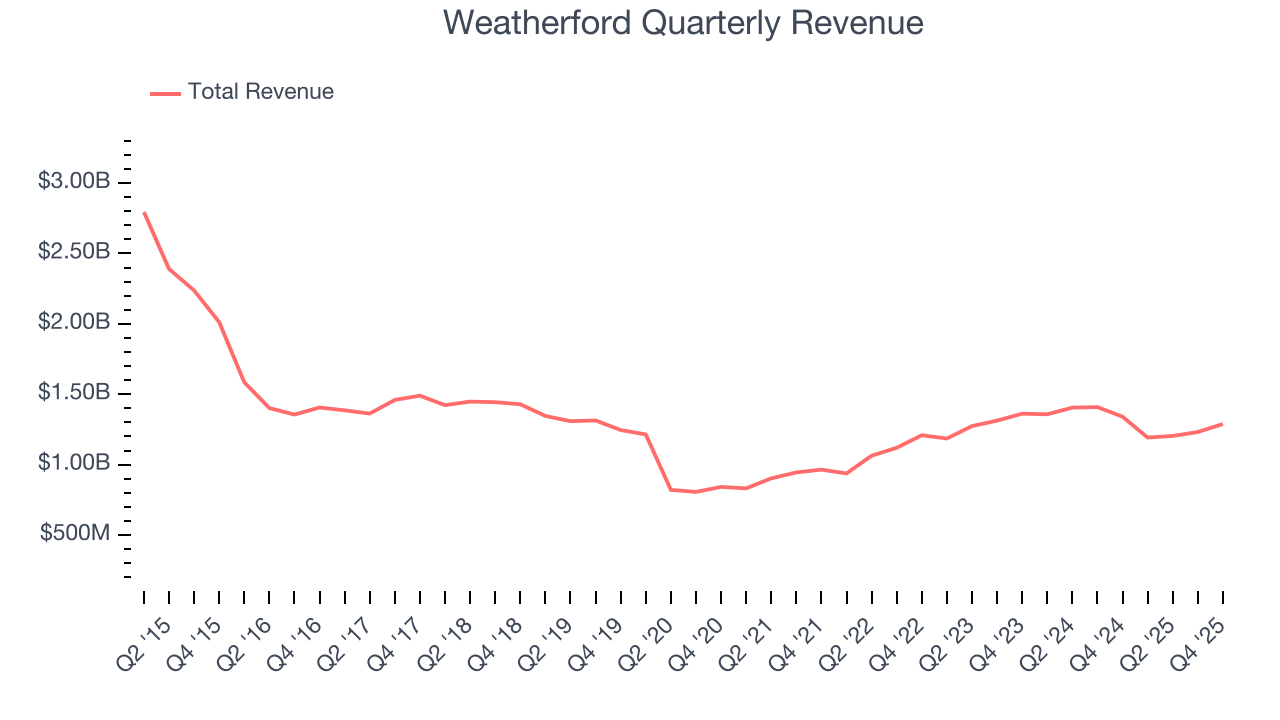
Within Energy, a singular timeframe, even if it’s quite long-term, only sheds light on how well a company rode the last commodity cycle. To better assess whether a company compounds through cycles, we validate our view with an even longer, ten-year view. Weatherford’s performance shows it grew in the past five-year but relinquished its gains over the last ten years, as its revenue fell by 6.3% annually.
This quarter, Weatherford’s revenue fell by 3.9% year on year to $1.29 billion but beat Wall Street’s estimates by 2.3%.
7. Gross Margin
In any given year, energy gross margins are heavily influenced by prices, hedging, and cost inflation, but over a full cycle these gross margins reveal which producers are structurally advantaged through superior “rock” quality, infrastructure access, and cost position.
Weatherford, which averaged 31.5% gross margin over the last five years, exhibiting bottom-tier unit economics in the sector. It means the company will struggle at higher commodity prices than peers with better gross margins. 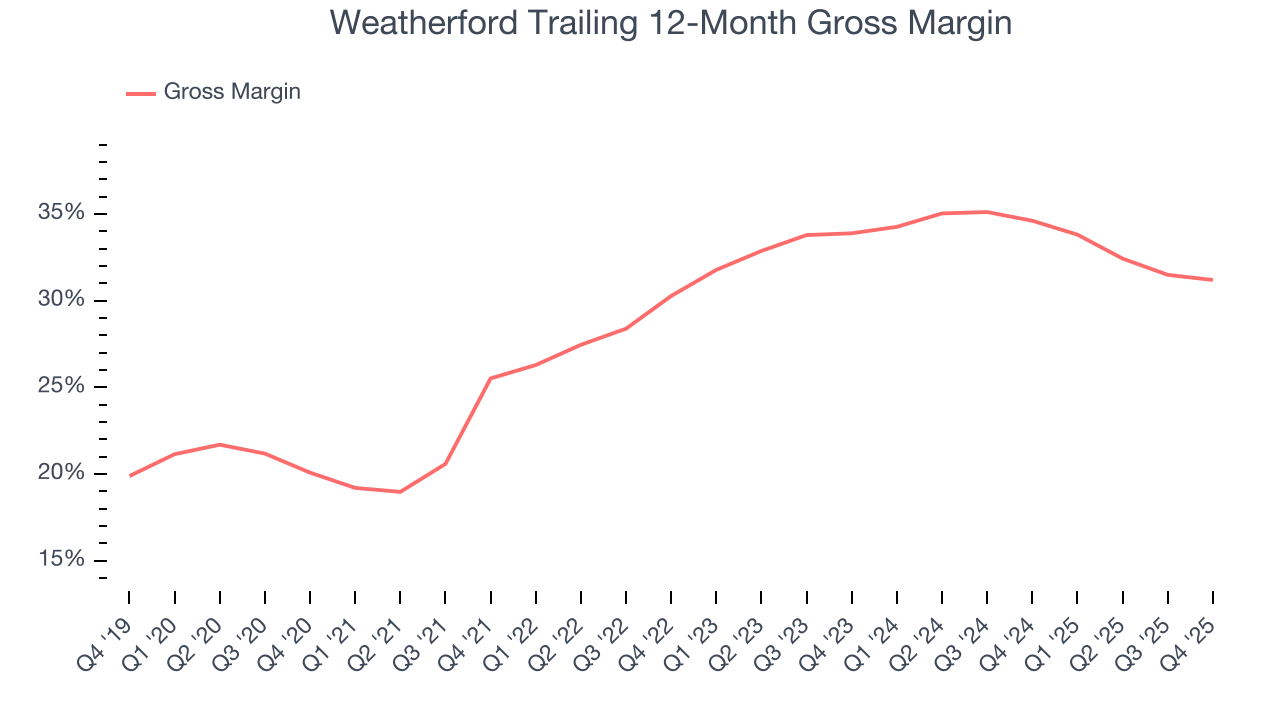
Weatherford’s gross profit margin came in at 30.8% this quarter , marking a 1.1 percentage point decrease from 31.9% in the same quarter last year. Note that energy margins can be volatile due to commodity price changes.
8. Adjusted EBITDA Margin
Weatherford was profitable over the last five years but held back by its large cost base. Its average EBITDA margin of 21% was weak for an upstream and integrated energy business.
On the plus side, Weatherford’s EBITDA margin rose by 5.3 percentage points over the last year.
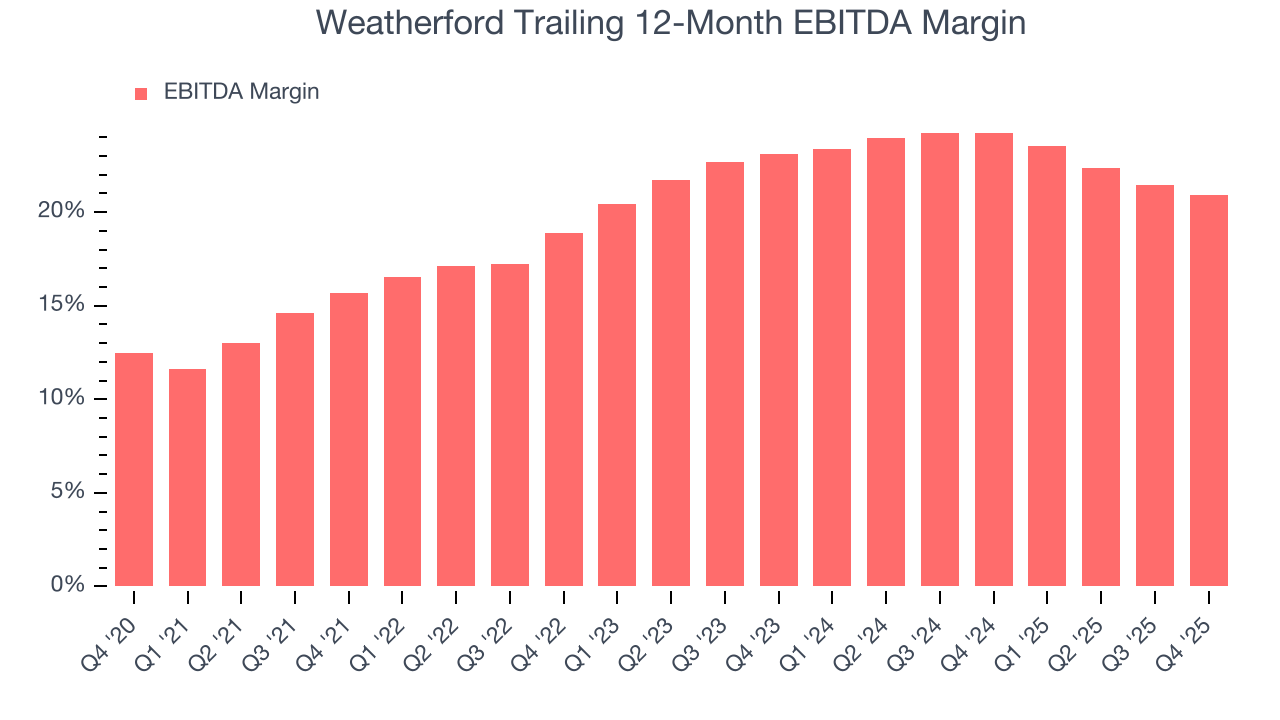
In Q4, Weatherford generated an EBITDA margin profit margin of 21.6%, down 1.9 percentage points year on year. This reduction is quite minuscule and indicates the company’s overall cost structure has been relatively stable. This adjusted EBITDA is in-line with Wall Street’s estimates.
9. Cash Is King
Adjusted EBITDA shows how profitable a company’s existing “rock” is before financing and reinvestment, while free cash flow shows how much value remains after paying to replace those wells. Because production declines over time, strong EBITDA can coexist with weak FCF if drilling is expensive or declines are steep. FCF therefore captures both operating efficiency and the cost of sustaining production.
Weatherford has shown decent cash profitability, giving it some flexibility to reinvest or return capital to investors. The company’s free cash flow margin averaged 9.4% over the last five years, slightly better than the broader energy upstream and integrated energy sector.
While the level of free cash flow margins is important, their consistency matters just as much.
Weatherford’s ratio of quarterly free cash flow volatility to WTI crude price volatility over the past five years was 4.6 (lower is better), indicating excellent insulation from commodity swings. This stability supports capital access in downturns and positions Weatherford to act as a consolidator when weaker peers are forced to retrench.
You may be asking why we wait until the free cash flow line to perform this stability analysis versus commodity prices. Why not compare revenue or EBITDA to WTI in the case of Weatherford? Because what ultimately matters is not how much revenue or profit you earn when prices are high but how much cash you can generate when prices are low. Free cash flow is the superior metric because it includes everything from hedging prowess to growth and maintenance capex to management behavior during good times and bad.
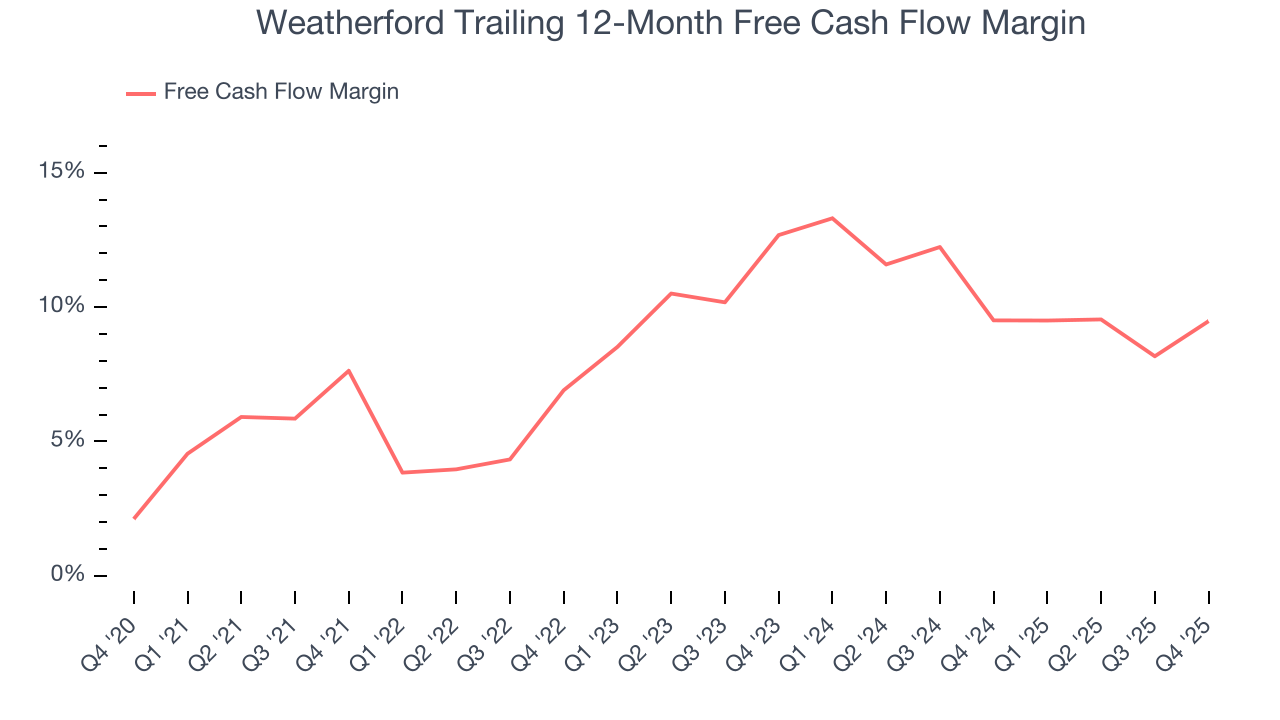
Weatherford’s free cash flow clocked in at $222 million in Q4, equivalent to a 17.2% margin. This result was good as its margin was 5.1 percentage points higher than in the same quarter last year, building on its favorable historical trend.
10. Return on Invested Capital (ROIC)
Free cash flow shows how much money a producer generated, while ROIC shows how efficiently that money was earned. ROIC measures the operating profit produced for each dollar of capital invested, whether from debt or equity. Cash generation measures quantity while ROIC measures the quality of value creation.
We at StockStory like to look at ROIC over a ten-year period because energy investment cycles can involve up to five years of ramping production and another five years of harvesting. A decade view captures buying, extracting, and monetizing rather than just part of that picture. Weatherford’s ten-year average ROIC was negative 3.3%, meaning management lost money while trying to expand the business. Its returns were among the worst in the energy upstream and integrated energy sector.
We like to invest in businesses with high returns, but the trend in a company’s ROIC is what often surprises the market and moves the stock price. Weatherford’s ROIC has increased significantly over the last few years. This is a good sign, and we hope the company can continue improving.
11. Balance Sheet Assessment
Weatherford reported $1.04 billion of cash and $1.49 billion of debt on its balance sheet in the most recent quarter. As investors in high-quality companies, we primarily focus on two things: 1) that a company’s debt level isn’t too high and 2) that its interest payments are not excessively burdening the business.
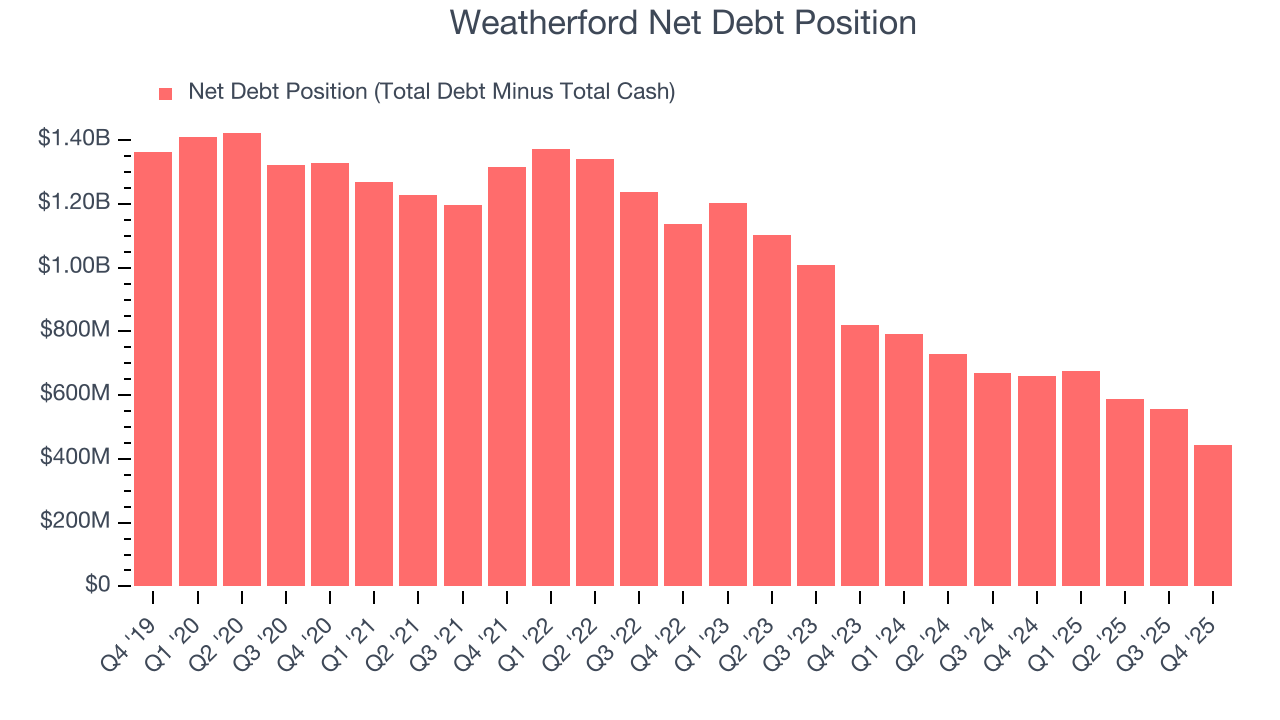
With $1.03 billion of EBITDA over the last 12 months, we view Weatherford’s 0.4× net-debt-to-EBITDA ratio as safe. We also see its $91 million of annual interest expenses as appropriate. The company’s profits give it plenty of breathing room, allowing it to continue investing in growth initiatives.
12. Key Takeaways from Weatherford’s Q4 Results
It was good to see Weatherford beat analysts’ EPS expectations this quarter. We were also glad its revenue outperformed Wall Street’s estimates. Overall, we think this was a decent quarter with some key metrics above expectations. The stock traded up 3.4% to $94.62 immediately following the results.
13. Is Now The Time To Buy Weatherford?
Updated: March 27, 2026 at 1:01 AM EDT
Before investing in or passing on Weatherford, we urge you to understand the company’s business quality (or lack thereof), valuation, and the latest quarterly results - in that order.
Weatherford isn’t a terrible business, but it isn’t one of our picks. First off, its revenue growth over the last five years was bottom-tier for the sector, and analysts expect its demand to deteriorate over the next 12 months. While its rising returns show management's prior bets are at least better than before, the downside is its relatively low ROIC suggests management has struggled to find compelling investment opportunities. On top of that, its revenue has declined over the last ten years.
Weatherford’s P/E ratio based on the next 12 months is 17.4x. Beauty is in the eye of the beholder, but our analysis shows the upside isn’t great compared to the potential downside. We're fairly confident there are better investments elsewhere.
Wall Street analysts have a consensus one-year price target of $107.42 on the company (compared to the current share price of $98.09).